

Abstract
Calreticulin (CALR) is a Ca2+-binding protein that shuttles among cellular compartments with proteins bound to its N/P domains. The knowledge that activation of the human erythropoietin receptor induces Ca2+ fluxes prompted us to investigate the role of CALR in human erythropoiesis. As shown by Western blot analysis, erythroblasts generated in vitro from normal sources and JAK2V617F polycythemia vera (PV) patients expressed robust levels of CALR. However, Ca2+ regulated CALR conformation only in normal cells. Normal erythroblasts expressed mostly the N-terminal domain of CALR (N-CALR) on their cell surface (as shown by flow cytometry) and C-terminal domain (C-CALR) in their cytoplasm (as shown by confocal microscopy) and expression of both epitopes decreased with maturation. In the proerythroblast (proEry) cytoplasm, C-CALR was associated with the glucocorticoid receptor (GR), which initiated the stress response. In these cells, Ca2+ deprivation and inhibition of nuclear export increased GR nuclear localization while decreasing cytoplasmic detection of C-CALR and C-CALR/GR association and proliferation in response to the GR agonist dexamethasone (Dex). C-CALR/GR association and Dex responsiveness were instead increased by Ca2+ and erythropoietin. In contrast, JAK2V617F proErys expressed normal cell-surface levels of N-CALR but barely detectable cytoplasmic levels of C-CALR. These cells contained GR mainly in the nucleus and were Dex unresponsive. Ruxolitinib rescued cytoplasmic detection of C-CALR, C-CALR/GR association, and Dex responsiveness in JAK2V617F proErys and its effects were antagonized by nuclear export and Ca2+ flux inhibitors. These results indicates that Ca2+-induced conformational changes of CALR regulate nuclear export of GR in normal erythroblasts and that JAK2V617F deregulates this function in PV.
Graphical abstract

Calreticulin (CALR) is an endoplasmic reticulum (ER)-resident protein that regulates the functions of numerous proteins by chaperoning them to their active sites in response to Ca2+ [1,2]. Structurally and functionally, mature human CALR (residues 18-417; UniProt ID: P27797) can be divided into three domains, a globular N-terminal domain (N-domain, N-CARL, residues 18–197), an extended proline-rich P-domain (residues 198–308), and an acidic C-terminal domain (C-domain, C-CARL, residues 309–417) [3,4]. The chaperone function of this protein requires both N-CALR, which binds other proteins, and C-CALR, which contains the KDEL motif required for translocation of the protein and its complexes across membranes. CALR does not contain a transmembrane domain and is anchored to the membrane by C-CALR binding to specific adaptors such as CD59 in neutrophils [5]. On the plasma membrane, CALR acts as a receptor for orphan ligands such as thrombospondin [6]. In the cytoplasm, CALR shuttles other proteins between Golgi and ER [1,7]. In murine cells, it is also present in the nucleus, where it mediates the export of all nuclear receptors, including the glucocorticoid receptor (GRα) [8,9].
CALR is an intrinsically disordered protein, the function of which is exquisitely dependent on its tertiary structure [10,11]. Biophysical studies on recombinant constructs containing the globular domain and C-CALR revealed that Ca2+ alters the conformation of the protein by affecting the levels of C-CALR being exposed [12]. In the absence of Ca2+ or at low Ca2+ concentrations (0.01–100 nmol/L), C-CALR is deeply buried in the globular domain. It becomes loosely bound to the globular domain, and therefore susceptible to modulation, at Ca2+ concentrations of 50–500 μmol/L, whereas it is completely exposed in the presence of a 5 mmol/L Ca2+ concentration [12]. However, because the constructs used in this study did not contain N-CALR, it is not known whether alterations in C-CALR exposure may affect exposure of N-CALR as well. This hypothesis is supported by X-ray crystallography of the truncated construct of human CALR containing the N-domain and the N-terminal half of the C-domain connected by a GSG tripeptide instead of the extended P-domain, indicating a tertiary structure in which C-CALR folds toward the N-domain [4].
Binding of glucocorticoids to GRα initiates a JAK2-dependent signaling cascade that activates the stress response [13,14]. This cascade induces nuclear translocation of GRα and insures its binding to glucocorticoid-responsive elements regulating the expression of stress-responsive genes [13]. Studies on murine fibroblasts transfected with green fluorescent protein-tagged proteins indicated that CALR resets the stress response by inducing nuclear export of GRα, thereby making the cells susceptible to novel ligand activation [9]. In murine cells, this function requires N-CALR, which binds GRα [15] and is induced by Ca2+ [16], an indication that it may be regulated by C-CALR [12]. In contrast, studies on CALR in human erythroid cells are sparse and its functions in stress erythropoiesis are still poorly defined.
The need for studies on the function of CALR in human erythropoiesis was highlighted by the discovery of somatic mutations in exon 9 of CALR disrupting the C-terminal domain of CALR in patients with the Philadelphia-negative myeloproliferative neoplasms (MPNs) essential thrombocytopenia and primary myelofibrosis not harboring JAK2 mutations [17–19]. CALR mutations are instead not detectable in patients with the MPN polycythemia vera (PV), who harbor mostly (>90%) the gain-of-function JAK2V617F mutation [17–19]. Surprisingly, the phenotype of CALR+ MPNs includes constitutive activation of JAK2 [17,18] and these patients respond to treatment with JAK inhibitors such as ruxolitinib [20,21]. Studies in human megakaryocytic–erythroleukemic cell lines and in mouse models have elucidated that CALR binds to the cytokine receptor homology domain of all the receptors of the hematopoietic superfamily, including the thrombopoietin (MPL) and erythropoietin (EPO-R) receptors [22,23]. In addition, binding of the mutated, but not of wild-type, CALR to MPL, but not to EPO-R, acts as a ligand-mimetic activating JAK2 [22,23], establishing an important link between the CALR/MPL/JAK2 axis and the pathobiology of CALR+ MPN. However, the biological functions exerted by the binding of wild-type CALR to the hematopoietic superfamily receptors in normal cells and whether these functions are impaired by JAK2V617F in PV have not yet been established.
In cultures containing the synthetic GRα agonist dexamethasone (Dex), hematopoietic progenitors from normal sources (NS) activate the stress response, generating great numbers of the immature erythroid cells proerythroblasts (proErys) within 10–14 days [24,25]. These cultures, defined by us as human erythroid massive amplification (HEMA) cultures [26], are a model for human stress erythropoiesis. In this model, the combination of JAK2 and GR activation elicits a signal, which retains proErys in proliferation, allowing great expansion. In addition, hematopoietic progenitors from JAK2+-PV generate in culture large numbers of proErys, but they do so independently of Dex [27]. In fact, in these cells, by mechanisms still not completely elucidated, GRα is constitutively retained in the nucleus in an active state [27]. Using these observations as foundation, we aimed to generate a deeper understanding of the functions of CALR in human stress erythropoiesis and to explore whether these functions are altered by JAK2V617F in PV.
Methods
Human subjects
Buffy coats from regular blood donations (NS) were provided by the Transfusion Center of La Sapienza University (Rome, Italy). Blood from 21 JAK2V617F-PV patients who underwent phlebotomy as part of their treatment was provided by Dr. A. Tafuri (GR-MPD/A, CE: Prot.530/12 Rif.2498/14.06.2012) and by the Myeloproliferative Disease Research Consortium Tissue Bank (protocol MPD-RC 116). Samples were collected according to guidelines established by local ethical committees for human subject studies in accordance with the 1975 Helsinki Declaration revised in 2000 and made available as de-identified material.
Cell lines
The HEL cell line derived from a patient with Hodgkin’s disease who later developed erythroleukemia [28] carries the JAK2V617F mutation and was provided by Dr. Papayannopoulou (Washington University, Seattle, WA, USA) in 2006 and maintained since then under good cell practice conditions. The JAK2V617F-negative K562 cell line was used as a negative control.
Generation of human proErys in HEMA
Mononuclear cells (MNCs) were separated by Ficoll and cultured (106 cells/mL) under HEMA conditions with recombinant human stem cell factor (SCF, 100 ng/mL, Amgen, Thousand Oaks, CA, USA), EPO (5 U/mL, Janssen, Raritan, NJ), interleukin-3 (IL-3, 1 ng/mL, R&D Systems, Minneapolis, MN, USA), Dex (10−6 mol/L) and estradiol (10−6 mol/L) (both from Sigma-Aldrich, St Louis, MO, USA) as described previously [26]. At day 10, cells were analyzed by flow cytometry with CD36 and CD235a to assess maturation [27,29] and subjected to further analyses.
Cell manipulations
Stimulation with Dex and growth factors (GFs)
Day 10 Erys were first GF deprived (GFD) for 4 hours in Iscove’s modified Dulbecco’s medium (#21980, Life Technologies, Carlsbad, California, USA) supplemented with 10% (v/v) fetal bovine serum (FBS) that had been charcoal treated to remove glucocorticoids (F6765, Sigma-Aldrich) and then exposed for 0, 15 minutes, and 4 hours to GFs (SCF, IL-3, or EPO) with or without Dex (10−6 mol/L) or to Dex alone. In selected experiments, cells were exposed to GFs and Dex in combination with the pan-GR inhibitor RU486 (5 μmol/L, Danco Laboratories) [30].
Inhibition of protein synthesis
Protein half-life determinations were performed on day 10 Erys exposed to the protein synthesis inhibitor cycloheximide (50 μg/mL, #C4859, Sigma-Aldrich) [31] for 0, 4, 8, 12, 16, and 24 hours.
In vivo Ca2+ deprivation
Day 10 Erys were pretreated in HEMA conditions for 4 hours with the selective intracellular Ca2+ chelator BAPTA [32] (10 μmol/L, #120503, Abcam, Cambridge, MA, USA) in combination with either a compound that raises intracellular Ca2+ levels (ionomycin [33], Io, 100 nmol/L, #sc30085, Santa Cruz Biotechnology, Santa Cruz, CA, USA) or an inhibitor of Ca2+ in the ER (thapsigargin [34], TG, 100 nmol/L, #586005, Calbiochem, San Diego, CA, USA) as described previously [16].
Inhibition of nuclear export
Day 10 Erys were cultured for 30–60 minutes in HEMA conditions with or without the inhibitor of nuclear export leptomycin (3 μg/mL, #L2913, Sigma-Aldrich) [35].
Inhibition of JAK/STAT signaling
Day 10 Erys were cultured for 2–24 hours in HEMA culture with and without the pan-JAK inhibitor ruxolitinib (10 μmol/L, #S1378, Sellechem, Houston, TX, USA) [36].
Protein lysates
Cells were washed twice in CaCl2-and MgCl2-free phosphate-buffered saline (PBS, #70011-044, Invitrogen, Carlsbad, CA, USA) and lysed in lysis buffer containing 50 mmol/L Tris-HCl, pH 7.4; 1% NP40; 0.25% sodium deoxycholate; 150 mmol/L NaCl; 1 mmol/L of the Ca2+ chelator EDTA; 1 mmol/L PMSF; 1μ/mL each aprotinin, leupeptin, and pepstatin; 1 mmol/L Na3VO4; 1 mmol/L NaF (all from Sigma-Aldrich) as described previously [27]. This procedure reduces the Ca2+ content of the medium in which the proteins are dissolved. To determine the effects of Ca2+ on the conformation of CALR in solution, in selected experiments, cells were washed twice in PBS containing 0.9 or 10 mmol/L CaCl2 and then lysed in buffer prepared as above but without EDTA.
Western blot (WB) analysis
Protein extracts (30 μg/lane) separated on sodium dodecyl sulfate-polyacrylamide gel electrophoresis (SDS-PAGE) containing β-mercaptoethanol (5% v/v), were blotted on nitrocellulose membranes as described previously [27] and probed with antibodies against N-CALR (#12238, Cell Signaling Technology, Boston, MA, USA), C-CALR (sc-6467, Santa Cruz Biotechnology), GRα (sc-33780), GRαSer211 (#4161s, Cell Signaling Technology), GRβ (#3581, Abcam), STAT5 (sc-835, Santa Cruz Biotechnology), pSTAT5-Y694 (#9351, Cell Signaling Technology), p38 (Cell Signaling Technology), p-Pp38 (#T180/Y182, Cell Signaling Technology), GAPDH (CB1001, Calbiochem), HSP90 (#SMC149A, Stress Marq, Cadboro Bay, CA, USA), or Lamin B1 (#Ab16048, Abcam). The N-CALR and C-CALR antibodies used in this study were raised against synthetic peptides mapping, respectively, residues near the N-terminal or the C-terminal domain not disclosed by the manufacturers and were characterized in previous studies [37,38]. Membranes were then incubated with appropriate horseradish peroxidase-coupled secondary antibodies (Calbiochem) and immune complexes detected with an enhanced chemiluminescence kit (Amersham, Buckinghamshire, UK). Nuclear and cytoplasmic fractions were prepared using the kit NE-PER (#78833, Thermo Scientific-Pierce Biotechnology, Rockford, IL). The intensity of each band was quantified with the IS Image Studio Lite version 4.0 program for Windows (Microsoft Software, Inc., North Hampton, MA) and expressed as relative content after normalization with respect to the respective loading control (GAPDH). For protein half-life determinations, the content of each protein was expression as the fold change with respect to the content at time 0.
Flow cytometry
Cells were incubated with CD36 and CD235a (R&D Systems) for maturation assessment [26,29], in combination with either anti-N-CALR or C-CALR antibodies or irrelevant IgG. Fluorescent signals were measured with the FACS Aria (Becton Dickinson, Franklin Lakes, NJ, USA), analyzed with FlowJo software (TreeStar, Inc., Ashland, OR, USA), and expressed as mean fluorescence intensity. Dead cells were excluded by Sytox Blue staining (0.002 mmol/L, Molecular Probes, Eugene, OR, USA). Cell maturation states were confirmed by visual examination of cytocentrifuged smears (Cytospin3, Shandon, Astmoor, UK).
Confocal microscopy
Cultured cells were fixed with paraformaldehyde, left to attach to polylysine-coated glass slides, permeabilized with 0.1% Triton X-100 (Bio-Rad Laboratories, Richmond, CA, USA) incubated with blocking buffer (bovine serum albumin in PBS 2.5%) for 1 hour, and incubated overnight at 4°C with N-CALR, C-CALR or GR antibodies. After two washes in PBS (Sigma-Aldrich), cells were incubated with Alexa Fluor-conjugated secondary antibodies for 30 minutes at room temperature in the dark, washed twice with PBS, and mounted with 4′,6-diamidino-2-phenylindole (DAPI; Invitrogen) to visualize nuclei. Evaluations were performed with the FV1000 confocal microscope (Olympus, Tokyo, Japan) equipped with a 60× oil-immersion objective. Standard threshold levels were defined in red (emission at 546 nm, N-CALR and C-CALR), green (emission at 488 nm, GR), and blue (emission at 408 nm, DAPI) mode for colored images and in grey mode for single channels, as described previously [39]. Individual and merged signals were quantified with the freeware software ImageJ (version 1.29, NIH, Bethesda, MD). Magnification bias was minimized by expressing the results as percentages of area covered by single (red or green) or merged (yellow = red + green) signals/total area analyzed. In selected experiments, cells were fixed with ice-cold methanol 100% for 20 minutes and then processed for immunostaining.
3-(4,5-dimethylthiazolyl-2)-2,5-diphenyltetrazolium bromide (MTT) assay
Erys were grown in multiwells according to the conditions described above and proliferation assessed 24 hours later by adding MTT (5 mg/mL, Sigma-Aldrich) as described previously [29]. Colorimetric reactions were measured as optical density at 570 nm (Victor TM 1420, Perkin Elmer, Waltham, MA, USA). Determinations were performed in duplicate.
Statistical analyses
Results were analyzed by ANOVA (Windows Origin 6.0, Microcal Software Inc., North Hampton, MA), Wilcoxon–Mann–Whitney test (two-sided), or multiregression modelling (SAS software version 9.2, SAS Institute, Cary, NC, USA).
Results
MNCs from JAK2+-PV express normal levels of CALR but the protein from these cells is insensitive to conformational changes induced in solution by Ca2+
To begin assessing whether conformation changes of CALR affects normal and JAK2+ erythropoiesis, epitope-mapping studies with the N-CALR- and C-CALR-specific antibodies on MNCs from NS and JAK2+-PV were performed by WB. As expected, MNCs from JAK2+-PV expressed greater than normal levels of p38 and pp38 (downstream targets of JAK2 known to be activated in MPNs [40]), which were analyzed as a control. JAK2+-PV also expressed levels of N-CALR greater than normal but had levels of C-CALR similar to those expressed by NS (Fig. 1A and B). N-CALR and C-CALR from NS and JAK2+-PV both migrated as a single band with an apparent molecular weight of 55 KDa, which is consistent with the molecular mass reported for the human wild-type protein by other investigators [18] but greater than the 48 KDa expected on the basis of its sequence. In general, SDS-PAGE disrupts all noncovalent interactions and linearizes the protein structure, making all parts equally accessible to antibodies. However, intrinsically disordered proteins containing hydrophilic residues that bind SDS poorly, such as the Xenopus XPA and the prostate-associated gene 4 protein, retain their secondary structure under SDS-PAGE conditions, migrating noticeably slower than expected on the basis of their polypeptide composition [41–45]. Therefore, it is possible that CALR, an intrinsically disordered protein containing a proline-rich domain and highly acidic C-tail, also migrates with an apparent molecular mass lower than expected because it is partially resistant to SDS and retains the in vivo conformation and epitope accessibility in SDS-PAGE. According to this hypothesis, the greater levels of N-CALR detected in JAK2+-PV reflect a greater exposure of this epitope, possibly due to greater intracellular Ca2+ content, in these cells. We tested this hypothesis by determining the levels of N-CALR and C-CALR in lysates containing either low (0.9 mmol/L) or high (10 mmol/L) CaCl2 concentrations. Indeed, at 10 mmol/L Ca2+, MNCs from NS expressed more N-CALR and C-CALR than at 0.9 mmol/L, whereas those from JAK2+-PV contained the same robust levels of these epitopes at both Ca2+ concentrations (Fig. 1C). These preliminary results indicate that the presence of JAK2V617F, by a mechanism still to be identified, saturates the Ca2+-binding activity of CALR in MNCs.
Figure 1.

Presence of Ca2+ in solution affects the detection of N-CALR from MNCs of normal sources, but not that from MNCs of JAK2V617F-PV. (A) WB analyses with antibodies specific for N-CALR, C-CALR, the phosphorylated form of p38 (pp38), and p38 (as disease-specific control) and GAPDH (as a loading control) of MNC from seven of the normal blood donors (NS) and 12 of the JAK2+-PV patients (each line a different subject) investigated in this study. Lysis buffers contained 0.9 mmol/L Ca2+. (B) Quantification of the content of N-CALR, C-CALR, pp38, and p38 with respect to GAPDH and of the pp38/p38 ratio in MNCs from NS (open circles, n = 7) or JAK2+-PV (open triangles, n = 12). Results are presented as individual data points and as Mean (±SEM) (closed circles). p values were calculated by ANOVA. (C) WB analyses with antibodies specific for N-CALR, C-CALR, and GAPDH of MNC lysates from one NS and two JAK2+-PV patients containing either 0.9 or 10 mmol/L Ca2+, as indicated.
JAK2V617F increases the proliferative potential of proErys and induces ligand-independent GRα activation
As reported previously [27], MNCs from NS generated significantly more Erys in cultures with Dex than in cultures without Dex, whereas those from JAK2+-PV generated the same great numbers of Erys with and without Dex (Fig. 2A). The greater expansion of NS Erys obtained in the presence of Dex was associated with retention of larger numbers of cells in an immature state, whereas Erys from JAK2+-PV were similarly immature with and without Dex (Fig. 2B and C).
Figure 2.

MNCs from PV generate great numbers of immature Erys in cultures with or without Dex and these cells are hypersensitive to Dex. (A) Number of cells (as fold increase) generated by day 10 in HEMA cultures stimulated with or without Dex by MNCs from NS or PV subjects, as indicated. Numbers of cells generated by NS MNCs with and without Dex are statistically different (by ANOVA), whereas those obtained by PV MNC are not. Overall, PV MNCs generated numbers of cells three times greater than those generated by NS MNCs (p = 0.021). The number of subjects included in each group is indicated by n. See legend of Figure 1B for further details. (B) Representative flow cytometric analyses for CD36 and CD235a expression of cells obtained by day 10 in cultures of NS MNCs and JAK2+-PV MNCs with and without Dex. Erys were divided into distinctive maturation stages on the basis of standard criteria based on the pattern of CD36pos/CD235aneg expression indicated by rectangles (proErys, purple; basophilic Erys, red; polychromatophilic Erys, dark green; and orthrocromatic Erys, blue) [26,29]. Numbers near the rectangles indicate the frequency of the different populations. Non-Erys are indicated by green dots. This gating is color coded throughout the manuscript. (C) Representative May–Grunwald staining of cytospin preparations of cells obtained at day 10 in cultures of NS or JAK2+-PV MNCs with and without Dex as indicated. Original magnification 200×. (D) Short-term (24 hours) proliferation of Erys generated by day 10 in HEMA cultures from NS (n = 6, open circles) and JAK2+-PV (n = 10, open triangles) in response to GFs (SCF, IL-3, and EPO) with or without Dex (10−6 mmol/L) and with and without the GR inhibitor RU486 (50 μmol/L), as indicated. Some of the experiments were performed in duplicate. This, as well as the other, proliferation assays were performed in media containing FBS deprived of glucocorticoids by charcoal treatment. Results are presented as individual data points and as mean (±SEM). Data were analyzed by ANOVA and p values among groups are indicated. (Color version available online.)
Phosphoproteomic analyses indicated that Dex activates phosphorylation of GRα at S211, the event that sustains nuclear translocation [46], by 1.6-fold (p = 0.049) within 15 minutes in NS Erys, but not in JAK2+-PV Erys, suggesting that, in the latter, GRα is constitutively activated ([47]; also see http://capmm.gmu.edu/data). This hypothesis was tested by comparing proliferation rates of NS and JAK2+-PV Erys in response to GFs with and without Dex (Fig. 2D). Not only was the proliferation of Erys from NS GF dependent, but also that of Erys from JAK2+-PV, consistent with results obtained with purified JAK2+ hematopoietic progenitors by the Weissman group [48]. Dex significantly increased proliferation sustained by GFs in NS Erys, but not in those from JAK2+-PV, although RU486 exerted similar inhibitory effects on the proliferation of both cell types. These results indicate that the Dex-independent proliferation of JAK2+-PV Erys is due to constitutive activation of GRα.
Erys from JAK2+-PV contain normal levels of CALR but the protein from these cells is unresponsive to conformation changes induced in solution by Ca2+
To start to delineate the mechanism leading to Dex-independent GRα activation in JAK2+-PV, the conformation of the putative GRα nuclear export CALR in Erys from NS and JAK2+-PV was compared. As shown by WB, Erys generated from NS or JAK2+-PV contained comparable levels of N-CALR and C-CALR and of GRα analyzed as control (Fig. 3A and B). However, the knowledge that Ca2+ is a second messenger of EPO-R [49] suggested to us that CALR from Erys from NS (normal EPO response), JAK2+-PV (hyperresponse), or megakaryocytic-erythroleukemic JAK2−-K562 and JAK2+-HEL cell lines (EPO nonresponsive) may exhibit variegated levels of Ca2+ binding that would be reflected in different sensitivities to conformational changes induced by Ca2+ in solution. This hypothesis was tested by comparing the effects of 0.9 and 10 mmol/L Ca2+ on the detectability of N-CALR and C-CALR from lysates of NS Erys, JAK2+-Erys, JAK2−-K562, and JAK2+-HEL cells (Fig. 3C). In lysates from NS, both N-CALR and C-CALR were barely detectable at 0.9 mmol/L CaCl2 and their detectability levels significantly increased at 10 mmol/L. In contrast, in lysates from JAK2+-PV Erys, robust levels of C-CALR and N-CALR were detected at both CaCl2 concentrations, whereas in Erys from the K562 and HEL cells, the two epitopes were clearly detected at 0.9 mmol/L and became barely detectable at 10 mmol/L.
Figure 3.


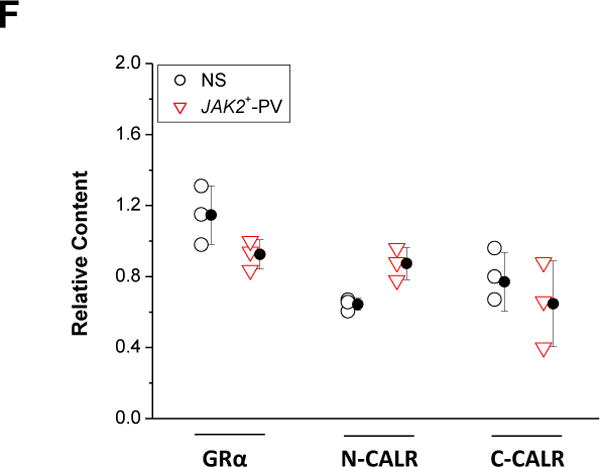

Erys generated from JAK2+-PV express normal levels of CALR, but CALR from these cells is insensitive to conformational changes induced by Ca2+. (A) Representative WB analyses for GRα, C-CALR, and N-CALR of Erys obtained from NS or PV (each line a different donor). GAPDH was analyzed as loading control. Expected molecular weights are indicated on the left. Lysates contained 10 mmol/L Ca2+. (B) Individual data points and mean (±SEM) content of GRα, N-CALR, and C-CALR with respect to GAPDH in Erys from NS (n = 10, open circles) and JAK2+-PV (n = 10, open triangles). Results are expressed as ratio between the densitometric value of each band and that of the respective GAPDH and are presented as individual data points (some of the data points overlap) and mean (±SEM). (C) WB analyses with antibodies specific for N-CALR, C-CALR, and GAPDH of Erys lysates from one NS and one JAK2+-PV patient. The lysates were supplemented with either 0.9 or 10 mmol/L Ca2+, as indicated. The megakaryocytic–erythroleukemic JAK2−-K562 and JAK2+-HEL cell lines were analyzed in parallel as a control. (D) Representative WB of half-life analysis of GRα, N-CALR, and C-CALR in Erys from one NS and one JAK2+-PV patient incubated with cycloheximide for 0–24 hours, as indicated. Quantification of GRα (black line), N-CALR (red line), and C-CALR (green line) in the different groups is presented in the panels on the right. Results are presented as fold change of the relative expression with GAPDH with respect to the relative expression at time 0 and are expressed as mean (±SD) of those obtained in three different experiments per group. The horizontal lines mark 50% reduction levels. *Values statistically different (p < 0.05 by ANOVA) from time 0. (E) To assess whether cycloheximide treatment affects the apparent molecular weight of N-CALR, the lysates from NS analyzed in (D) were run in duplicate on SDS-PAGE containing 10% acrylamide that separates the 55 KDa region with higher stringency. The gel was blotted and the nitrocellulose membrane cut in two parts, which were hybridized separately with antibodies specific for N-CALR and C-CALR. The two parts were then realigned and signals revealed by long-term exposure to the enhancer developer (to increase signals from low abundant bands). Both N-CALR and C-CALR were detected as one band. Furthermore, there was no difference in the migration of N-CALR bands in Erys treated with cycloheximide for 24 hours (in which the band was barely detectable) and that of C-CALR in untreated Erys (which express maximal levels of N-CALR). These results indicate that decrements in N-CALR signals observed after 24 hours of cycloheximide treatments are not due to protein degradation. (F) Quantification of GRα, N-CALR, and C-CALR in Erys from NS (blue bars) or JAK2+-PV patients (red bars) pretreated with the selective intracellular Ca2+ chelator BAPTA (10 μmol/L) [32] in combination with the compound that raises the intracellular levels of Ca2+, Io (1 μmol/L), for 4 hours. Protein of interest were quantified with respect to the corresponding GAPDH and the results were then expressed as relative content with respect to that observed in the corresponding Erys pretreated with medium. Results are presented as individual data points and as mean (±SEM) of those observed with three separate donors per each group. Similar results were obtained in Erys treated with BAPTA in combination with the inhibitor of Ca2+ in the ER, TG (1 μmol/L) (data not shown). (G) Representative WB determinations of the effects of in vivo inhibition of Ca2+ flux on the half-life of N-CALR and C-CALR in Erys from NS and JAK2+-PV patients. Ca2+ flux was inhibited by preincubating the cells for 4 hours with BAPTA in combination with either Io or TG, as described previously [16]. This time course analysis was stopped after 12 hours because of the massive maturation observed in Erys that were exposed to inhibitors of Ca2+ fluxes for 16–24 hours. (H) Quantification of N-CALR (red) and C-CALR (green) in cells from NS and JAK2+-PV pretreated with medium alone (straight line), Io + BAPTA (dash line), or TG+BAPTA (dotted line) and then exposed to cycloheximide for 0–12 hours. Results are presented as mean (±SEM) of three experiments. Panels D and G for further details. (Color version available online.)
To gain insights into the effects of Ca2+ on the exposure of the CALR epitopes in vivo, protein half-life was determined (Fig. 3D). GRα was analyzed as control. In NS Erys, the half-life of GRα and N-CALR was ~8 hours, whereas that of C-CALR was >12–24 hours. In contrast, in JAK2+-PV Erys, the half-life of GRα was still ~8 hours, but that of both N-CALR and C-CALR was >12–24 hours. The shorter N-CALR half-life in NS Erys was neither associated with the appearance of multiple bands (Fig. 3D) nor with changes in apparent molecular weight when the protein was analyzed at higher SDS-PAGE stringency (Fig. 3E), suggesting that it was due to conformational changes, possibly reflecting reduced content of proteins controlling Ca2+ flux induced by cycloheximide. This hypothesis was tested by determining the half-life of N-CALR and C-CALR (and GRα as a control) in NS and JAK2+-PV Erys pretreated with the Ca2+ flux inhibitors Io + BAPTA and TG + BAPTA [16]. These pretreatments per se did not affect N-CALR, C-CALR, or GRα content (Fig. 3F) nor GRα half-life, which remained ~8 hours (data not shown). However, they increased N-CALR half-life to levels similar to that of C-CALR (>12 hours) in NS Erys and had no effect on that of JAK2+-PV Erys, which remained >12 hours (Fig. 3G and H).
These experiments highlights differences in the Ca2+-saturation of CALR among Erys from NS and JAK2+-PV, which may be related to the activation state of EPO-R in the two cell types.
Normal Erys expose mainly N-CALR on their surface and C-CALR in their cytoplasm and exposure of both epitopes decreases with maturation
To clarify the cellular distribution of CALR in erythroid cells, epitope-mapping studies of CALR in Erys from NS were performed by flow cytometry and confocal microscopy. Using flow cytometry, both N-CALR and C-CALR were readily detected on the cell surface of Erys from NS (Fig. 4A). N-CALR was the epitope exposed at the greatest levels and its expression remained constant from proErys to polychromatic-Erys and decreased by 50% in orthocromatic-Erys (Fig. 4B). Cell-surface expression of N-CALR and C-CALR was not affected by adding Ca2+ in the sample buffer (data not shown).
Figure 4.

N-CALR is the epitope most exposed on the cell-surface and its expression is upregulated by GFs in Erys from NS. In contrast, N-CALR is expressed at high levels in Erys from JAK2+-PV independently from their stimulation. (A) Representative flow cytometry determinations of cell-surface C-CALR and N-CALR expression on Erys from NS and JAK2+-PV. Erys were divided into distinctive maturation stages, as discussed in Figure 2B. Green histograms indicate representative isotype controls. Numbers within the histograms indicate the mean fluorescent intensity (MFI) of the CALR signal. Results are representative of those observed with different donors. The number of donors included in each group is indicated by n. (B) Levels of N-CALR expressed by the different classes indicated by the histograms on the top. Results are expressed as individual data points and as mean (±SED) MFI for N-CALR obtained in independent experiments with NS and JAK2+-PV proErys, as indicated. *Values statistically different (p < 0.01 by ANOVA) from those observed with NS are indicated. (C) Levels of N-CALR expressed on the cell surface of proErys from NS and JAK2+-PV MPNs exposed to Dex, EPO, and SCF for 15 minutes and 4 hours, as indicated. Results are presented as individual data points and as mean (±SEM) of those observed in three different experiments per group, each one with a different donor, performed in duplicate. Statistical analyses were performed with ANOVA and significant p values are indicated within the panels. (Color version available online.)
Confocal microscopy detected both N-CALR and C-CALR in nonpermeabilized Erys, which retain their plasma membranes, but detected mainly C-CALR in cells subjected to permeabilization to reveal intracellular proteins (Fig. 5A). C-CALR signals were robust in the cytoplasm of proErys but barely detectable in the cytoplasm of orthochromatic cells (Fig. 5B) and were systematically colocalized with signals for GR (Fig. 5A–C). Both C-CALR and C-CALR/GR colocalization signals were enhanced by adding Ca2+ to the permeabilization buffer (Fig. 5A).
Figure 5.


C-CALR is the epitope most exposed on the cytoplasm of normal Erys and its expression decreases with maturation. (A) Representative confocal microscopy of proErys obtained from NS stained for N-CALR and C-CALR (red signal), as indicated. Cells were also exposed to GR antibodies (green) and nuclei were counterstained with DAPI. Cells were analyzed with and without Triton permeabilization to highlight cell-surface and intracellular protein content, respectively. The permeabilization buffer contained either 0.9 mmol/L Ca2+ or none, as indicated. Original magnification 1500×. The representative scale bar corresponds to 10 μm. (B) Confocal microscopy of representative permeabilized proErys and orthoErys obtained by day 10 in cultures of NS stained with a C-CALR antibody (red signal). Nuclei are counterstained with DAPI (blue). Maturation states are recognized by size [29]. Original magnification 1500×. (C) Details of individual and merged confocal GR (green) and C-CALR (red) signals in one representative proEry from NS. The insert details at higher magnification the boundaries between nuclear (DAPI, blue) and C-CALR (red) signals. Original magnification 3000× (see also Movies 1 and 2). (D) Details of individual and merged confocal C-CALR (red) and GR (green) (top panels) or C-CALR (red) and Lamin B1 (green) signals (middle and bottom panels) in proErys from an additional NS experiment. In this experiment, cells were fixed in methanol to preserve the integrity of the nuclear membrane. Nuclei are stained with DAPI (blue). Because Lamin B1 labels the inner side of the nuclear membrane [50], lack of colocalization of C-CALR and Lamin B1 signals confirms that the GR/C–CALR association occurs in the cytoplasm at the boundary with the nucleus. Original magnification 1500×. Scale bars are not presented.
Significant levels of C-CALR were never detected in nuclei from NS proErys (Fig. 5C, Movies 1 and 2). Furthermore, double C-CALR/GR and C-CALR/Lamin B1 (a component of the inner nuclear membrane [50]) staining clarified that C-CALR/GR signals were associated with the perinuclear area of the cytoplasm. However, C-CALR signals remained distinct from that of Lamin B1 (Fig. 5D), indicating that C-CALR/GR colocalization occurs in the cytoplasm at the border with the nucleus.
ProErys from JAK2+-PV expose maximal levels of N-CALR on their cell surface and barely detectable levels of C-CALR in their cytoplasm
The effects of JAK2V617F on the cellular distribution of CALR in proErys were determined by flow cytometry and confocal microscopy. ProErys from JAK2+-PV expressed cell-surface levels of N-CALR significantly greater (by 2-fold) than those expressed by NS proErys (Fig. 4A and B). Treatment with factors that activate JAK2 (Dex, EPO, or SCF) for 4 hours significantly increased (by 2-fold) cell-surface expression of N-CALR in NS proErys, but had no effect on that of JAK2+-PV Erys (Fig. 4C), suggesting that the slightly greater expression of N-CALR in the malignant cells is a consequence of constitutive JAK2 activation.
In contrast to NS proErys, C-CALR was barely detectable in the cytoplasm of proErys from JAK2+-PV (Fig. 6A and B). Because JAK2+-PV Erys expressed normal cytoplasmic levels of C-CALR, as shown by WB (Fig. 3A and B), failure to detect this epitope by confocal microscopy likely reflects alterations of protein conformation due to intracellular cues. As predicted by their constitutive GRα activation (Fig. 2D), in these malignant cells, GR signals were prevalently detected in nuclei (Fig. 6A and B).
Figure 6.


Erys from JAK2+-PV do not contain detectable levels of C-CALR in the cytoplasm and express GR mostly in their nucleus. (A) Single and merged images of confocal microscopy with antibodies specific for C-CALR (red) and GR (green) of one representative proEry obtained at day 10 in cultures of JAK2+-PV (the same cultures analyzed in Figs. 2–4). Nuclei were counterstained with DAPI. In proErys from JAK2+-PV, C-CALR was not detected and GR was detected mainly in nuclei. Original magnification 1500×. The representative scale bar corresponds to 10 μm. (B) Quantification of total (GR) and nuclear (GR nucl) GR, total C-CALR and CALR/GR colocalization (coloc) signals observed in proErys from multiple NS (n = 3) and JAK2+-PV (n = 3) experiments for a total of 16 cells per experimental point. Results are presented as box plots (median ± first and third quartile and whiskers with the lower of maximum and minimum value) of those obtained with 15–26 cells per experimental point. The table on the right summarizes statistically significant differences among groups.
In NS proErys, cytoplasmic colocalization of C-CALR/GR is negatively regulated by Dex and positively regulated by EPO
To start assessing the function(s) of C-CALR in stress erythropoiesis, we first determined content and localization of GRα, N-CALR, and C-CALR in Erys GFD and then treated them with Dex, EPO, and SCF by WB (Fig. 7A and B). ProErys from JAK2+-PV were analyzed in parallel as a control (Fig. 7A and C). Proteins present on plasma or nuclear membranes segregated in the cytoplasmic and nuclear fractions, respectively. None of the stimulation investigated altered the total content of the proteins analyzed (Fig. 7A).
Figure 7.


Cytoplasmic detection of C-CALR, as well as of its association with GR, is reduced by Dex and increased by EPO in normal proErys, whereas these manipulations are ineffective on the cytoplasmic detection of C-CALR in proErys from JAK2+-PV. (A) WB analyses for GRα, N-CALR, and C-CALR of total cell lysates from day 10 Erys obtained from NS (left) or JAK2+-PV patients (right). Cells were subject to GFD in medium containing 10% charcoal-treated FBS for 4 hours and then stimulated for 15 minutes or 4 hours with Dex, EPO, and SCF alone or in combination, as indicated. GAPDH was analyzed as a loading control. (B) WB analyses for GRα (total and phosphorylated at S211), N-CALR, and C-CALR of cytoplasmic and nuclear fractions of Erys obtained from NS. In Experiment 1, cells were subjected to GFD for 4 hours and then stimulated for 15 minutes with Dex either alone or in combination with RU486. Lamin B1 (LamB1) is presented as loading control of the nuclear fraction. In Experiment 2, cells were analyzed either as such (proliferation = Prol) or after GFD and then treatment with Dex, EPO, Dex + EPO, SCF, or SCF + Dex for 4 hours, as indicated. Blue and red arrows indicate levels of GRα lower or greater than those observed in GFD cells, respectively. HSP90 and Lamin B1 were analyzed as loading controls of the cytoplasmic and nuclear fraction, respectively. (C) WB analyses for GRα and C-CALR of cytoplasmic and nuclear fractions of Erys obtained from one JAK2+-PV. Cells were subjected to GFD and then stimulated with SCF for 15 minutes or 2 hours. Lamin B1 was analyzed as loading control. The total lysate (T) from unmanipulated cells was analyzed as a control. (D) Merged images of confocal microscopy of representative permeabilized proErys from NS and JAK2+-PV, as indicated. Cells were analyzed after GFD and exposure to Dex, EPO, or SCF for 15 minutes and 4 hours. Red and green signals were obtained with C-CALR and GR antibodies, respectively. Nuclei were stained with DAPI. The same cells were analyzed in (B) and (C). Original magnification 1500×. The representative scale bar corresponds to 10 μm. (E, F) Effect of 4 hours of treatment with Dex, EPO, or SCF on the colocalization of GR and C-CALR in proErys from NS (E) or JAK2+-PV. (F) Shown are single and merged color images of permeabilized proErys incubated with anti-GR (green) and anti-C-CALR (red) antibodies, as indicated. Nuclei are stained with DAPI (blue). Original magnification 2000×. (G) Quantification of individual and merged C-CALR and GR signals observed by confocal microscopy in proErys from NS and JAK2+-PV exposed to the different manipulations. Each experiment was performed in triplicate and results are presented as box plots of those obtained with 24–39 NS cells and five to 10 JAK2+-PV cells per experimental point. The tables summarize differences among groups that are statistically significant by Wilcoxon–Mann–Whitney test. (Color version available online.)
A first experiment determined that Dex rapidly (within 15 minutes) induced GR phosphorylation at S211 and increased levels of GRα detected in nuclear fractions from NS Erys (Fig. 7B). These increases were not observed in cells exposed to Dex + RU486. In contrast, regardless of the stimuli, N-CALR and C-CALR were mostly detected in cytoplasmic fractions.
A second experiment analyzed the cellular partitioning of GRα, N-CALR, and C-CALR in NS Erys exposed to Dex, EPO, and SCF, alone or in combination, for 4 hours (Fig. 7B). Also in this case, Dex, alone or with EPO or SCF, increased the level of GRα detected in nuclear fractions. These levels were also modestly increased by SCF but strongly decreased by EPO. Again, these stimuli did not affect the prevalent cytoplasmic localization of N-CALR and C-CALR. In contrast, GRα was prevalently detected in nuclear fractions of JAK2+-PV Erys irrespective of the stimuli (Fig. 7C).
The effect of Dex, EPO, and SCF on the cellular location of GR and C-CALR in proErys from NS and JAK2+-PV was also assessed by confocal microscopy. In NS proErys, low levels of GR were observed in the nucleus after GFD (Fig. 7D). Nuclear localization of GR was stimulated by exposure to Dex, EPO, or SCF for 15 minutes, but decreased by Dex or EPO stimulation by 4 hours (p values were significant against GFD only for Dex; Fig. 7D, E, and G). Conversely, both Dex and EPO significantly increased the cytoplasmic levels of C-CALR (Dex by 15 minutes and EPO by 4 hours) and those of C-CALR/GR colocalization by 4 hours, suggesting that C-CALR drives cytoplasmic localization of GR. The great numbers of individual NS proErys analyzed (410 cells) allowed us to test this hypothesis by performing multiregression analyses comparing single C-CALR and total and cytoplasmic GR signals as the independent parameters against merged signals (colocalization) as the dependent parameter (Table 1). Although the levels of C-CALR/GR colocalization were directly correlated with the cytoplasmic levels of both C-CALR and GR, the greatest p values were observed for C-CALR (p < 0.00001 vs. 0.045). Further support was provided by confocal microscopy studies showing that treatments with the nuclear export inhibitor leptomycin greatly decreased levels of C-CALR/GR colocalization, while increasing nuclear localization of GR, in proErys from NS untreated or treated with EPO for 4 hours (Fig. 8A) and greatly reduced the ability of these NS Erys to proliferate in response to Dex (Fig. 8B). In contrast, Dex, EPO, or SCF had modest effects on the detection of GR (which remained mainly nuclear) and of C-CALR (which remained barely detectable) in proErys from JAK2+-PV (Fig. 7D, F, and G).
Table 1.
Multiregression modeling of the cytoplasmic colocalization of C-CALR and GR
| Linear regression with respect to values of CALR/GR colocalization (%)
| ||||
|---|---|---|---|---|
| Coefficient B | SE | p value | 95% confidence interval | |
| CALR | 0.07 | 0.02 | 0.0000 | (0.04–0.10) |
| GR total | 0.03 | 0.02 | 0.0640 | (−0.002–0.065) |
| CALR | 0.07 | 0.02 | 0.0000 | (0.03–0.10) |
| GR in cytoplasm | 0.02 | 0.01 | 0.0450 | (0.00–0.05) |
The modeling used individual C-CALR and GR signals as the independent variables and merged C-CALR/GR signals as the dependent variables. Calculations were made with values obtained with 410 single proErys.
Figure 8.


Leptomycin reduces cytoplasmic colocalization of C-CALR and GR and Dex responsiveness in proErys from normal sources. (A) Details of individual and merged confocal C-CALR (red) and GR (green) signals in representative NS proErys either untreated or treated with the nuclear export inhibitor leptomycin [35] for 30 or 60 minutes. ProErys were analyzed as such (Prol) or after treatment with EPO for 4 hours, as indicated. Nuclei are stained with DAPI (blue). Original magnification 1500×. The representative scale bar corresponds to 10 μm. (B) MTT incorporation of day 10 Erys from NS that were exposed or not to leptomycin for 30 minutes. NS proErys are from the same experiment analyzed in (A). Cells were subjected to GFD for 2 hours in charcoal-treated FBS and cultured with GFs (SCF, IL-3, and EPO) with or without Dex and with or without RU486 for 24 hours, as indicated. Results are expressed as a percentage of those obtained with GFs alone and are presented as individual data points and as mean (±SEM) of those obtained in three separate experiments. p values (by ANOVA) among groups are indicated. (Color version available online.)
Ruxolitinib increases the cytoplasmic exposure of C-CALR, restoring C-CALR/GR colocalization and Dex responsiveness, in proErys from JAK2+-PV
To assess the effects of JAK2V617F on the cytoplasmic exposure of C-CALR, on its GR colocalization, and on overall Dex responsiveness, confocal microscopy and proliferation assays on proErys from JAK2+-PV treated or not with the JAK1/2 inhibitor ruxolitinib were performed. Preliminary WB compared the content of N-CALR, C-CALR, and GRα in untreated and ruxolitinib-treated Erys from JAK2+-PV (Fig. 9A–C). These experiments included analyses of pSTAT5, as a control of JAK2 inhibition, and of GRβ, the dominant-negative isoform that retains GRα in the nuclei of human cells [51,52] expressed at levels greater than normal in JAK2+-PV [27]. As expected, ruxolitinib decreased the levels of pSTAT5, but had modest, if any, effects on the GRα and GRβ content of these malignant cells (Fig. 9A). It also significantly increased (by 30%) C-CALR content, but had no effect on N-CALR (Fig. 9B and C). In contrast, ruxolitinib did not affect C-CALR content of NS Erys (Fig. 9C) or of JAK2+-HEL cells (data not shown), which were analyzed as a control.
Figure 9.


Inhibition of JAK signaling increases C-CALR exposure in the cytoplasm restoring C-CALR/GR colocalization and Dex responsiveness in JAK2+-PV. (A) WB analyses for pSTAT5/STAT5, GRα, and GRβ of total cell lysates from day 10 Erys expanded from JAK2+-PV and subjected to GFD and then stimulated with GFs with or without ruxolitinib for 24 hours. GAPDH was analyzed as a loading control. (B) WB analyses for GRα, N-CALR, and C-CALR of total cell lysates from Erys expanded from one JAK2+-PV cultured with or without ruxolitinib for 24 hours and then GFD for 2 hours. GAPDH was loaded as an internal control. (C) Quantification of N-CALR and C-CALR content with respect to GAPDH analyzed as a control in Erys expanded from three JAK2+-PV cultured for 2–24 hours with or without ruxolitinib, as indicated. The C-CALR content of Erys from one NS is reported for comparison. C-CALR content in JAK2+-PV Erys cultured with or without ruxolitininb is statistically different (by ANOVA). Results are presented as individual data points and as mean (±SEM) where applicable (n = 3). (D) Merged images of confocal microscopy of representative permeabilized proErys expanded from JAK2+-PV. Cells were cultured with or without ruxolitinib for 2–24 hours (the same cells as in (A) and (B)). Cells were labelled with anti-C-CALR (red) or anti-GR (green) antibodies. Areas of colocalization are in yellow. Nuclei were stained with DAPI. Original magnification 1500×. The representative scale bar corresponds to 10 μm. (E) Quantification of individual and merged C-CALR and GR signals observed by confocal microscopy in proErys from three JAK2+-PV exposed or not to ruxolitinib, Results are presented as box plots of those obtained with 12 NS cells and 18 JAK2+-PV per experimental point. The table summarizes differences among the groups that are statistically significant by Wilcoxon–Mann–Whitney test. (F) Single and merged color images detected by confocal microscopy of GR (green) and C-CALR (red) in proErys from JAK2+-PV exposed to ruxolitinib. Areas of colocalization are in yellow and are indicated by arrows. The individual and merged cytoplasmic signals of GR and C-CALR are detected in the perinuclear areas. Original magnification 2000×. (G) Under the conditions used in this study, treatment with ruxolinitib does not affect the viability of Erys from NS (n = 3–6) or JAK2+-PV patients (n = 4–8). Survival was assessed by toluidine blue exclusion. The same cells were analyzed in (D) and (E). Results are presented as individual data points and as mean (±SEM). (H) MTT incorporation of day 10 Erys from NS and JAK2+-PV preincubated or not with ruxolitinib for 2–4 hours and then GFD for 2 hours in charcoal-treated FBS and cultured with GFs (SCF, IL-3, and EPO) with or without Dex for 24 hours. Results are expressed as a percentage of the levels of incorporation observed with GFs alone in the untreated group and are presented as individual data points and as mean (±SEM) of those obtained in six separate NS and JAK2+-PV experiments. p values were calculated by ANOVA. (Color version available online.)
Consistent with these results, ruxolitinib significantly increased cytoplasmic levels of C-CALR and C-CALR/GR colocalization while reducing nuclear localization of GR detected in proErys from JAK2+-PV by confocal microscopy (Fig. 9D and E). C-CALR/GR colocalization occurred in the perinuclear area of the cytoplasm (Fig. 9F).
Under the conditions of the study, ruxolitinib did not affect cell viability (Fig. 9G), but, as predicted by the confocal microscopy observations, it rescued Dex responsiveness of JAK2+-PV proErys. In fact, Dex increased proliferation sustained by GFs of ruxolitinib-treated Erys from both JAK2+-PV and NS Erys (positive controls), whereas untreated JAK2+-PV Erys remained Dex unresponsive (negative controls) (Fig. 9H).
Ca2+ regulates the nuclear export activity of C-CALR in NS and this regulation is restored by ruxolitinib in JAK2+ proErys
To assess the functions of Ca2+ in the nuclear export activity of C-CALR in NS and whether these functions are rescued by ruxolitinib in JAK2+-PV, confocal microscopy studies and proliferation assays of untreated NS and ruxolitinib-treated JAK2+-PV Erys exposed or not to Io + BAPTA or TG + BAPTA were performed (Fig. 10). These treatments greatly decreased C-CALR and C-CALR/GR colocalization signals in the cytoplasm while increasing that of GR in nuclei both in NS Erys and in ruxolitinib-treated Erys from JAK2+-PV (Fig. 10A and B). After being treated with Io + BAPTA or TG + BAPTA, NS and JAK2+-PV ruxolitinib-treated Erys became Dex unresponsive, expressing similar levels of proliferation when exposed to GFs with or without Dex (Fig. 10C).
Figure 10.


Inhibition of Ca2+ flux increases cytoplasmic colocalization of C-CALR/GRα and Dex responsiveness in untreated proErys from JAK2+-PV but reduces that of proErys from JAK2+-PV treated with ruxolitinib and of untreated Erys from NS. (A) Details of individual and merged confocal C-CALR (red) and GR (green) signals in proErys from NS either untreated or treated with Io + BAPTA or TG + BAPTA. Original magnification 1500×. The representative scale bar corresponds to 10 μm. (B) Details of individual and merged confocal C-CALR (red) and GR (green) signals in proErys from JAK2+-PV treated or not with ruxolitinib for 2 hours and then exposed to Io + BAPTA or TG + BAPTA, as described in Figure 3G. Nuclei are stained with DAPI (blue). Original magnification 1500×. The representative scale bar corresponds to 10 μm. (C) MTT incorporation of day 10 Erys from untreated NS and from untreated or ruxolitinib-treated JAK2+-PV that had been exposed or not to Io + BAPTA or TG + BAPTA (the same cells presented in (A) and (B)). Cells were GFD for 2 hours in charcoal-treated FBS and then cultured with GFs (SCF, IL-3, and EPO) with or without Dex and with or without RU486 for 24 hours. Results are expressed as a percentage of the levels of incorporation observed with GFs alone in the experimental group not exposed to Ca2+ flux inhibitors and are presented as individual data points and as mean (±SEM) of those obtained in three separate NS and JAK2+-PV experiments. Controls not exposed to Ca2+ flux inhibitors were analyzed in duplicate. p values were calculated by ANOVA. (Color version available online.)
Confocal microscopy studies of malignant cells treated with leptomycin confirmed that ruxolitinib favors nuclear export of GR from JAK2+-proErys (Fig. 11A). In fact, as already shown for NS proErys (Fig. 8A), leptomycin greatly reduced the cytoplasmic levels of C-CALR and C-CALR/GR colocalization in ruxolitinib-treated JAK2+-PV proErys while increasing the nuclear levels of GR.
Figure 11.
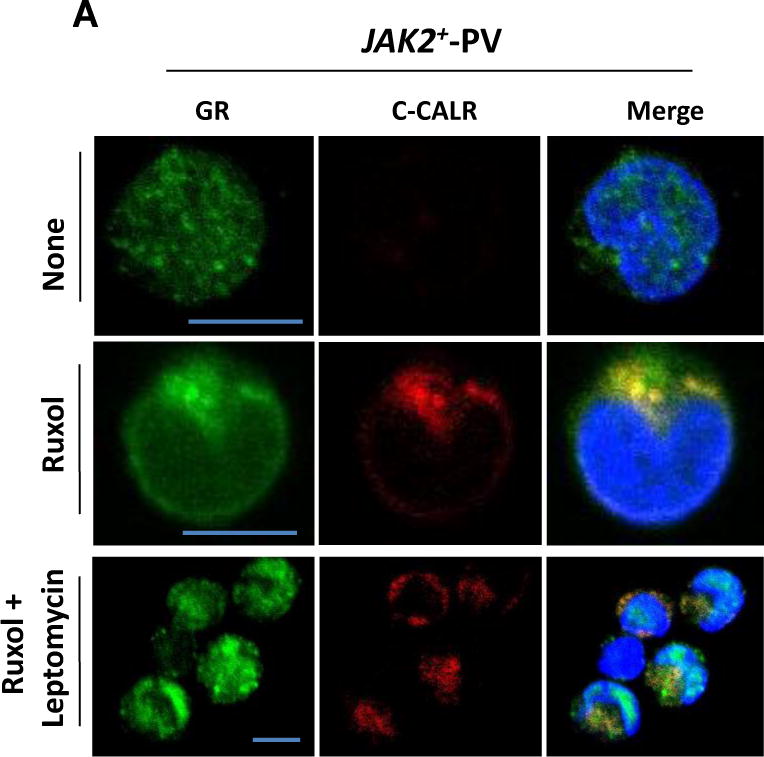

Inhibition of nuclear export reduces cytoplasmic colocalization of C-CALR/GRα and Dex responsiveness in proErys from JAK2+-PV treated with ruxolitinib. (A) Details of individual and merged confocal C-CALR (red) and GR (green) signals in untreated proErys from JAK2+-PV and in JAK2+-PV proErys treated with ruxolitinib for 2 hours or treated with ruxolitinib for 2 hours and then exposed to leptomycin for 30 minutes, as indicated. Nuclei are stained with DAPI (blue). Original magnification 1500×. The representative scale bar corresponds to 10 μm. (B) MTT incorporation of day 10 Erys from untreated (left) or ruxolitinib-treated (right) JAK2+-PV that were exposed or not to leptomycin for 30 minutes. JAK2+-PV are from the same experiment analyzed in (A). Cells were subjected to GFD for 2 hours in charcoal-treated FBS and cultured with GFs (SCF, IL-3, and EPO) with or without Dex and with or without RU486 for 24 hours, as indicated. Results are expressed as a percentage of the levels of incorporation observed with GFs alone in the untreated group and are presented as individual data points and as mean (±SEM) of those obtained in three separate JAK2+-PV experiments. p values were calculated by ANOVA. nd = Not done. (Color version available online.)
Proliferation assays confirmed that nuclear export of GR resets the stress response of ruxolitinib-treated JAK2+-PV proErys (Fig. 11B). In fact, similar to NS Erys (Fig. 8B), leptomycin greatly reduced the ability of ruxolitinib-treated Erys from JAK2+-PV to respond to Dex and had no effect on the proliferation of untreated JAK2+-PV Erys, which remained Dex unresponsive.
Discussion
Erythropoiesis is exclusively regulated by the interaction of EPO with its receptor, EPO-R, and activation of JAK2 signaling [53]. Under steady-state conditions, JAK2 signaling induces proErys to undergo terminal erythroid maturation [54]. In contrast, under conditions of stress, JAK2 signaling induce proErys to undergo self-replication [55]. It is generally accepted that GRα is responsible for “switching” the response to JAK2 activation from maturation to proliferation under conditions of stress [24,25]. However, for the stress response to be effective, a mechanism(s) should be in place that counteracts GRα switching back the cellular response to JAK2 activation from proliferation to maturation. The nature of the mechanism(s) that resets the stress response is still poorly defined.
In 1979, Misiti and Spivak suggested for the first time that Ca2+ represents a second messenger of EPO-R by showing that Ca2+ ionophores specifically synergize with EPO in inducing murine CFU-E to form colonies in vitro [56]. Studies from the Miller group confirmed these results in human cells and documented that EPO raises by 6-fold the intracellular levels of Ca2+, as determined by digital fluorescent in vivo imaging, for up to 18 minutes in human proErys generated in culture, as the cells studied here, by day 10 [57]. In these cells, Ca2+ levels increased from the 50 nmol/L range at baseline to the 300 nmol/L range after EPO stimulation. Further studies demonstrated that activation of Ca2+ mobilization by EPO-R requires protein kinase C (PKC) signaling [58], is stage specific (it is not observed in Erys generated by day 8 [57]), promotes maturation [49], and is restricted to human cells because deletion of the erythroid-specific Ca2+ channel gene Trpc2 does not induce an erythroid phenotype in mice [59]. It has also been known for some time that, in murine nonhematopoietic cells, Ca2+ flux regulates the function of CALR to import GRα from the nucleus [1,9]. However, whether CALR exerts GR nuclear import function in human erythroid cells and whether also in these cells this function is regulated by Ca2+ flux possibly downstream of EPO-R signaling has not yet been investigated. The data presented here fill this gap.
We provide biochemical evidence indicating that day 10 Erys expanded in vitro from NS and JAK2+-PV express robust levels of N-CALR and C-CALR and that exposure of these epitopes in solution and in vivo is modulated by Ca2+ only in Erys from NS. Flow cytometry and confocal microscopy observations indicated that the erythroid cells that express the greatest levels of N-CALR and C-CALR are the proErys; that is, the cells capable of responding to EPO and Dex [29,55].
Confocal microscopy observations indicated that C-CALR is the epitope exposed in the cytoplasm of proErys and that exposure of this epitope is upregulated by Ca2+ and EPO and downregulated by inhibitors of Ca2+ flux. In addition, in NS proErys, C-CALR was colocalized with GR in the perinuclear areas and this association was upregulated by EPO and Ca2+ and downregulated by inhibitors of Ca2+ flux. It was also downregulated by Dex, which promoted nuclear translocation of GRα. Conversely, nuclear localization of GR was negatively regulated by Ca2+ and EPO and positively regulated by inhibitors of Ca2+ flux. The perinuclear C-CALR/GR association, the inverse relationship between effects exerted by Dex and Ca2+/EPO on C-CALR/GR association, and GR nuclear retention and multivariate analyses of confocal microscopy signals from a large number of single cells provide circumstantial evidence for the hypothesis that C-CALR, in response to Ca2+ signals downstream of EPO, drives nuclear export of GRα in human proErys, resetting their stress response. This hypothesis was further tested by determining that treatment with both an inhibitor of nuclear export and those of Ca2+ flux greatly reduced both cytoplasmic C-CALR/GRα colocalization and proliferation in response to Dex of NS proErys.
In conclusion, these results indicate that, in normal proErys, Ca2+ signaling downstream of EPO-R induces conformation changes of C-CALR that sustain nuclear export of GR, resetting the stress response and allowing the cells to undergo terminal maturation. In other words, CALR is the switch that, under conditions of stress, turns EPO-R/JAK2 signaling from the proliferation to the maturation mode (see Graphical Abstract).
MNC from JAK2+-PV generated similar great numbers of Erys in HEMA with and without Dex and JAK2+-Erys did not proliferate in response to Dex, although their proliferation was inhibited by RU486, suggesting that, in these cells, GR is constitutively active. Further proof that GR is constitutively active in JAK2+-PV proErys was provided by confocal microscopy study indicating that, in these malignant cells, GR is retained in the nucleus. We hypothesized that the abnormal nuclear retention of GRα is caused by impairment of the nuclear export function of C-CALR induced by JAK2V617 F. This hypothesis was tested by determining that JAK2+ proErys express barely detectable levels of C-CALR in their cytoplasm, which was rescued by treatment with ruxolitinib. In addition, ruxolitinib significantly increased the levels of C-CALR/GR association and restored the responsiveness of JAK2+ proErys to Dex. All of the effects of ruxolitinib were similarly antagonized by the inhibitor of nuclear export and by those of Ca2+ flux, further supporting the hypothesis that hyperstimulation of EPO-R by JAK2V617 F induces an intracellular Ca2+ milieu that impairs the nuclear export function of C-CALR in PV. Further support for this interpretation is provided by phosphoproteomic data indicating that JAK2+ Erys express greater than normal levels of activation of the proteins that favor Ca2+ fluxes VAV3 [60] and PKC [58] (phosphoproteomic data are available at http://capmm.gmu.edu/data) and became Dex responsive when treated with the pan-PKC inhibitor Go6983 (ARM, unpublished observations). In addition, JAK2+ Erys are induced to express C-CALR and C-CALR/GR association in the cytoplasm and to respond to Dex by treatment with inhibitors of Ca2+ flux.
In conclusion, these results indicate that, in JAK2+-PV proErys, hyperactivation of EPO-R signaling, possibly by increasing Ca2+ flux, inhibits exposure of C-CALR, impairing its nuclear export functions and leading to constitutive GR activation. This inability of malignant cells to reset the stress response retains EPO-R signaling in the proliferation mode, resulting in erythrocytosis (see Graphical Abstract).
This study used nuclear export as a bait to assess whether JAK2V617F affects the functions of wild-type C-CALR in PV. Further elucidation of the pathobiology of MPNs will require determinations of the full spectrum of C-CALR functions impaired by JAK2V617F and of its relationship to functional abnormalities of this domain induced by CALR mutations [17–20].
Conclusions
Thanks to its intrinsically disordered nature, C-CALR in response to Ca2+ undergoes conformational changes that trigger its function to export GR from the nucleus, resetting the stress response of normal erythroid cells. Impairment of this function in JAK2V617F-positive erythroid cells maintains EPO-R signaling in proliferation mode, contributing to erythrocytosis in PV.
Supplementary Material
Acknowledgments
The authors thank Prof. Marlene Bouvier for the generous gift of full-length human CALR and its isolated P- and C-domains and Dr. Carolyn Whitsett for critical reading of the manuscript.
This work was supported by grants from the National Cancer Institute–National Institutes of Health (P01-CA108671), the Heart, Lung and Blood Institute–National Institutes of Health (1R01-HL116329), and Associazione Italiana Ricerca Cancro (AIRC 17608).
G.G. and A.T. provided buffy coats discarded from regular blood and cord blood donations and from MPNs and assured compliance of the study with the institutional review board. M.F., L.V., F.M., M.M., O.P., and V.N.U. performed experiments and analyzed data. M.F., L.V., and A.R.M. designed research. V.N.U. and A.R.M. analyzed the data and wrote the manuscript. All authors have read the manuscript, concur with its content, and state that its content has not been submitted elsewhere.
Footnotes
Supplementary data related to this article can be found online at http://dx.doi.org/10.1016/j.exphem.2017.02.001.
Conflict of interest disclosure
The authors declare no competing financial interests.
References
- 1.Michalak M, Corbett EF, Mesaeli N, Nakamura K, Opas M. Calreticulin: one protein, one gene, many functions. Biochem J. 1999;344:281–292. [PMC free article] [PubMed] [Google Scholar]
- 2.Jiang Y, Dey S, Matsunami H. Calreticulin: roles in cell-surface protein expression. Membranes (Basel) 2014;4:630–641. doi: 10.3390/membranes4030630. [DOI] [PMC free article] [PubMed] [Google Scholar]
- 3.Michalak M, Groenendyk J, Szabo E, Gold LI, Opas M. Calreticulin, a multi-process calcium-buffering chaperone of the endoplasmic reticulum. Biochem J. 2009;417:651–666. doi: 10.1042/BJ20081847. [DOI] [PubMed] [Google Scholar]
- 4.Chouquet A, Paidassi H, Ling WL, et al. X-ray structure of the human calreticulin globular domain reveals a peptide-binding area and suggests a multi-molecular mechanism. PLoS One. 2011;6:e17886. doi: 10.1371/journal.pone.0017886. [DOI] [PMC free article] [PubMed] [Google Scholar]
- 5.Ghiran I, Klickstein LB, Nicholson-Weller A. Calreticulin is at the surface of circulating neutrophils and uses CD59 as an adaptor molecule. J Biol Chem. 2003;278:21024–21031. doi: 10.1074/jbc.M302306200. [DOI] [PubMed] [Google Scholar]
- 6.Goicoechea S, Pallero MA, Eggleton P, Michalak M, Murphy-Ullrich JE. The anti-adhesive activity of thrombospondin is mediated by the N-terminal domain of cell surface calreticulin. J Biol Chem. 2002;277:37219–37228. doi: 10.1074/jbc.M202200200. [DOI] [PubMed] [Google Scholar]
- 7.Williams DB. Beyond lectins: the calnexin/calreticulin chaperone system of the endoplasmic reticulum. J Cell Sci. 2006;119:615–623. doi: 10.1242/jcs.02856. [DOI] [PubMed] [Google Scholar]
- 8.Dedhar S, Rennie PS, Shago M, et al. Inhibition of nuclear hormone receptor activity by calreticulin. Nature. 1994;367:480–483. doi: 10.1038/367480a0. [DOI] [PubMed] [Google Scholar]
- 9.Holaska JM, Black BE, Love DC, Hanover JA, Leszyk J, Paschal BM. Calreticulin is a receptor for nuclear export. J Cell Biol. 2001;152:127–140. doi: 10.1083/jcb.152.1.127. [DOI] [PMC free article] [PubMed] [Google Scholar]
- 10.Shivarov V, Ivanova M, Tiu RV. Mutated calreticulin retains structurally disordered C terminus that cannot bind Ca(2+): some mechanistic and therapeutic implications. Blood Cancer J. 2014;4:e185. doi: 10.1038/bcj.2014.7. [DOI] [PMC free article] [PubMed] [Google Scholar]
- 11.Wijeyesakere SJ, Gafni AA, Raghavan M. Calreticulin is a thermostable protein with distinct structural responses to different divalent cation environments. J Biol Chem. 2011;286:8771–8785. doi: 10.1074/jbc.M110.169193. [DOI] [PMC free article] [PubMed] [Google Scholar]
- 12.Villamil Giraldo AM, Lopez Medus M, Gonzalez Lebrero M, et al. The structure of calreticulin C-terminal domain is modulated by physiological variations of calcium concentration. J Biol Chem. 2010;285:4544–4553. doi: 10.1074/jbc.M109.034512. [DOI] [PMC free article] [PubMed] [Google Scholar]
- 13.Zhou J, Cidlowski JA. The human glucocorticoid receptor: one gene, multiple proteins and diverse responses. Steroids. 2005;70:407–417. doi: 10.1016/j.steroids.2005.02.006. [DOI] [PubMed] [Google Scholar]
- 14.Bauer A, Tronche F, Wessely O, et al. The glucocorticoid receptor is required for stress erythropoiesis. Genes Dev. 1999;13:2996–3002. doi: 10.1101/gad.13.22.2996. [DOI] [PMC free article] [PubMed] [Google Scholar]
- 15.Roderick HL, Campbell AK, Llewellyn DH. Nuclear localisation of calreticulin in vivo is enhanced by its interaction with glucocorticoid receptors. FEBS Lett. 1997;405:181–185. doi: 10.1016/s0014-5793(97)00183-x. [DOI] [PubMed] [Google Scholar]
- 16.Holaska JM, Black BE, Rastinejad F, Paschal BM. Ca2+-dependent nuclear export mediated by calreticulin. Mol Cell Biol. 2002;22:6286–6297. doi: 10.1128/MCB.22.17.6286-6297.2002. [DOI] [PMC free article] [PubMed] [Google Scholar]
- 17.Klampfl T, Gisslinger H, Harutyunyan AS, et al. Somatic mutations of calreticulin in myeloproliferative neoplasms. N Engl J Med. 2013;369:2379–2390. doi: 10.1056/NEJMoa1311347. [DOI] [PubMed] [Google Scholar]
- 18.Nangalia J, Massie CE, Baxter EJ, et al. Somatic CALR mutations in myeloproliferative neoplasms with nonmutated JAK2. N Engl J Med. 2013;369:2391–2405. doi: 10.1056/NEJMoa1312542. [DOI] [PMC free article] [PubMed] [Google Scholar]
- 19.Nunes DP, Lima LT, Chauffaille Mde L, et al. CALR mutations screening in wild type JAK2(V617F) and MPL(W515K/L) Brazilian myeloproliferative neoplasm patients. Blood Cells Mol Dis. 2015;55:236–240. doi: 10.1016/j.bcmd.2015.07.005. [DOI] [PubMed] [Google Scholar]
- 20.Passamonti F, Caramazza D, Maffioli M. JAK inhibitor in CALR-mutant myelofibrosis. N Engl J Med. 2014;370:1168–1169. doi: 10.1056/NEJMc1400499. [DOI] [PubMed] [Google Scholar]
- 21.Cervantes F, Vannucchi AM, Kiladjian JJ, et al. COMFORT-II investigators Three-year efficacy, safety, and survival findings from COMFORT-II, a phase 3 study comparing ruxolitinib with best available therapy for myelofibrosis. Blood. 2013;122:4047–4053. doi: 10.1182/blood-2013-02-485888. [DOI] [PubMed] [Google Scholar]
- 22.Chachoua I, Pecquet C, El-Khoury M, et al. Thrombopoietin receptor activation by myeloproliferative neoplasm associated calreticulin mutants. Blood. 2016;127:1325–1335. doi: 10.1182/blood-2015-11-681932. [DOI] [PubMed] [Google Scholar]
- 23.Araki M, Yang Y, Masubuchi N, et al. Activation of the thrombopoietin receptor by mutant calreticulin in CALR-mutant myeloproliferative neoplasms. Blood. 2016;127:1307–1316. doi: 10.1182/blood-2015-09-671172. [DOI] [PubMed] [Google Scholar]
- 24.von Lindern M, Zauner W, Mellitzer G, et al. The glucocorticoid receptor cooperates with the erythropoietin receptor and c-Kit to enhance and sustain proliferation of erythroid progenitors in vitro. Blood. 1999;94:550–559. [PubMed] [Google Scholar]
- 25.Zhang L, Prak L, Rayon-Estrada V, et al. ZFP36L2 is required for self-renewal of early burst-forming unit erythroid progenitors. Nature. 2013;499:92–96. doi: 10.1038/nature12215. [DOI] [PMC free article] [PubMed] [Google Scholar]
- 26.Migliaccio G, Di Pietro R, di Giacomo V, et al. In vitro mass production of human erythroid cells from the blood of normal donors and of thalassemic patients. Blood Cells Mol Dis. 2002;28:169–180. doi: 10.1006/bcmd.2002.0502. [DOI] [PubMed] [Google Scholar]
- 27.Varricchio L, Masselli E, Alfani E, et al. The dominant negative beta isoform of the glucocorticoid receptor is uniquely expressed in erythroid cells expanded from polycythemia vera patients. Blood. 2011;118:425–436. doi: 10.1182/blood-2010-07-296921. [DOI] [PMC free article] [PubMed] [Google Scholar]
- 28.Martin P, Papayannopoulou T. HEL cells: a new human erythroleukemia cell line with spontaneous and induced globin expression. Science. 1982;216:1233–1235. doi: 10.1126/science.6177045. [DOI] [PubMed] [Google Scholar]
- 29.Falchi M, Varricchio L, Martelli F, et al. Dexamethasone targeted directly to macrophages induces macrophage niches that promote erythroid expansion. Haematologica. 2015;100:178–187. doi: 10.3324/haematol.2014.114405. [DOI] [PMC free article] [PubMed] [Google Scholar]
- 30.Bourgeois S, Pfahl M, Baulieu EE. DNA binding properties of glucocorticosteroid receptors bound to the steroid antagonist RU-486. EMBO J. 1984;3:751–755. doi: 10.1002/j.1460-2075.1984.tb01879.x. [DOI] [PMC free article] [PubMed] [Google Scholar]
- 31.Siegel MR, Sisler HD. Inhibition of protein synthesis in vitro by cycloheximide. Nature. 1963;200:675–676. doi: 10.1038/200675a0. [DOI] [PubMed] [Google Scholar]
- 32.Dieter P, Fitzke E, Duyster J. BAPTA induces a decrease of intracellular free calcium and a translocation and inactivation of protein kinase C in macrophages. Biol Chem Hoppe Seyler. 1993;374:171–174. doi: 10.1515/bchm3.1993.374.1-6.171. [DOI] [PubMed] [Google Scholar]
- 33.Morgan AJ, Jacob R. Ionomycin enhances Ca2+ influx by stimulating store-regulated cation entry and not by a direct action at the plasma membrane. Biochem J. 1994;300:665–672. doi: 10.1042/bj3000665. [DOI] [PMC free article] [PubMed] [Google Scholar]
- 34.Lytton J, Westlin M, Hanley MR. Thapsigargin inhibits the sarcoplasmic or endoplasmic reticulum Ca-ATPase family of calcium pumps. J Biol Chem. 1991;266:17067–17071. [PubMed] [Google Scholar]
- 35.Kudo N, Wolff B, Sekimoto T, et al. Leptomycin B inhibition of signal-mediated nuclear export by direct binding to CRM1. Exp Cell Res. 1998;242:540–547. doi: 10.1006/excr.1998.4136. [DOI] [PubMed] [Google Scholar]
- 36.Zhou T, Georgeon S, Moser R, Moore DJ, Caflisch A, Hantschel O. Specificity and mechanism-of-action of the JAK2 tyrosine kinase inhibitors ruxolitinib and SAR302503 (TG101348) Leukemia. 2014;28:404–407. doi: 10.1038/leu.2013.205. [DOI] [PubMed] [Google Scholar]
- 37.Schardt JA, Eyholzer M, Timchenko NA, Mueller BU, Pabst T. Unfolded protein response suppresses CEBPA by induction of calreticulin in acute myeloid leukaemia. J Cell Mol Med. 2010;14:1509–1519. doi: 10.1111/j.1582-4934.2009.00870.x. [DOI] [PMC free article] [PubMed] [Google Scholar]
- 38.Nauseef WM, McCormick SJ, Clark RA. Calreticulin functions as a molecular chaperone in the biosynthesis of myeloperoxidase. J Biol Chem. 1995;270:4741–4747. doi: 10.1074/jbc.270.9.4741. [DOI] [PubMed] [Google Scholar]
- 39.Paddock SW, Eliceiri KW. Laser scanning confocal microscopy: history, applications, and related optical sectioning techniques. Methods Mol Biol. 2014;1075:9–47. doi: 10.1007/978-1-60761-847-8_2. [DOI] [PubMed] [Google Scholar]
- 40.Desterke C, Bilhou-Nabera C, Guerton B, et al. FLT3-mediated p38-MAPK activation participates in the control of megakaryopoiesis in primary myelofibrosis. Cancer Res. 2011;71:2901–2915. doi: 10.1158/0008-5472.CAN-10-1731. [DOI] [PubMed] [Google Scholar]
- 41.Iakoucheva LM, Kimzey AL, Masselon CD, Smith RD, Dunker AK, Ackerman EJ. Aberrant mobility phenomena of the DNA repair protein XPA. Protein Sci. 2001;10:1353–1362. doi: 10.1110/ps.ps.40101. [DOI] [PMC free article] [PubMed] [Google Scholar]
- 42.Tompa P. Intrinsically unstructured proteins. Trends Biochem Sci. 2002;27:527–533. doi: 10.1016/s0968-0004(02)02169-2. [DOI] [PubMed] [Google Scholar]
- 43.Receveur-Brechot V, Bourhis JM, Uversky VN, Canard B, Longhi S. Assessing protein disorder and induced folding. Proteins. 2006;62:24–45. doi: 10.1002/prot.20750. [DOI] [PubMed] [Google Scholar]
- 44.Zeng Y, He Y, Yang F, et al. The cancer/testis antigen prostate-associated gene 4 (PAGE4) is a highly intrinsically disordered protein. J Biol Chem. 2011;286:13985–13994. doi: 10.1074/jbc.M110.210765. [DOI] [PMC free article] [PubMed] [Google Scholar]
- 45.Uversky VN, Dunker AK. Multiparametric analysis of intrinsically disordered proteins: looking at intrinsic disorder through compound eyes. Anal Chem. 2012;84:2096–2104. doi: 10.1021/ac203096k. [DOI] [PubMed] [Google Scholar]
- 46.Wang Z, Frederick J, Garabedian MJ. Deciphering the phosphorylation “code” of the glucocorticoid receptor in vivo. J Biol Chem. 2002;277:26573–26580. doi: 10.1074/jbc.M110530200. [DOI] [PubMed] [Google Scholar]
- 47.Hricik T, Federici G, Zeuner A, et al. Transcriptomic and phosphoproteomic analyzes of erythroblasts expanded in vitro from normal donors and from patients with polycythemia vera. Am J Hematol. 2013;88:723–729. doi: 10.1002/ajh.23487. [DOI] [PMC free article] [PubMed] [Google Scholar]
- 48.Jamieson CH, Gotlib J, Durocher JA, et al. The JAK2 V617F mutation occurs in hematopoietic stem cells in polycythemia vera and predisposes toward erythroid differentiation. Proc Natl Acad Sci U S A. 2006;103:6224–6229. doi: 10.1073/pnas.0601462103. [DOI] [PMC free article] [PubMed] [Google Scholar]
- 49.Schaefer A, Magocsi M, Marquardt H. Signalling mechanisms in erythropoiesis: the enigmatic role of calcium. Cell Signal. 1997;9:483–495. doi: 10.1016/s0898-6568(97)00094-6. [DOI] [PubMed] [Google Scholar]
- 50.Moir RD, Yoon M, Khuon S, Goldman RD. Nuclear lamins A and B1: different pathways of assembly during nuclear envelope formation in living cells. J Cell Biol. 2000;151:1155–1168. doi: 10.1083/jcb.151.6.1155. [DOI] [PMC free article] [PubMed] [Google Scholar]
- 51.Yudt MR, Jewell CM, Bienstock RJ, Cidlowski JA. Molecular origins for the dominant negative function of human glucocorticoid receptor beta. Mol Cell Biol. 2003;23:4319–4330. doi: 10.1128/MCB.23.12.4319-4330.2003. [DOI] [PMC free article] [PubMed] [Google Scholar]
- 52.Derijk RH, Schaaf MJ, Turner G, et al. A human glucocorticoid receptor gene variant that increases the stability of the glucocorticoid receptor beta-isoform mRNA is associated with rheumatoid arthritis. J Rheumatol. 2001;28:2383–2388. [PubMed] [Google Scholar]
- 53.Kuhrt D, Wojchowski DM. Emerging EPO and EPO receptor regulators and signal transducers. Blood. 2015;125:3536–3541. doi: 10.1182/blood-2014-11-575357. [DOI] [PMC free article] [PubMed] [Google Scholar]
- 54.Palis J. Primitive and definitive erythropoiesis in mammals. Front Physiol. 2014;5:3. doi: 10.3389/fphys.2014.00003. [DOI] [PMC free article] [PubMed] [Google Scholar]
- 55.Migliaccio G, Masiello F, Tirelli V, et al. Under HEMA conditions, self-replication of human erythroblasts is limited by autophagic death. Blood Cells Mol Dis. 2011;47:182–197. doi: 10.1016/j.bcmd.2011.06.001. [DOI] [PubMed] [Google Scholar]
- 56.Misiti J, Spivak JL. Erythropoiesis in vitro. Role of calcium. J Clin Invest. 1979;64:1573–1579. doi: 10.1172/JCI109618. [DOI] [PMC free article] [PubMed] [Google Scholar]
- 57.Miller BA, Cheung JY, Tillotson DL, Hope SM, Scaduto RC., Jr Erythropoietin stimulates a rise in intracellular-free calcium concentration in single BFU-E derived erythroblasts at specific stages of differentiation. Blood. 1989;73:1188–1194. [PubMed] [Google Scholar]
- 58.Divecha N, Irvine RF. Phospholipid signaling. Cell. 1995;80:269–278. doi: 10.1016/0092-8674(95)90409-3. [DOI] [PubMed] [Google Scholar]
- 59.Hirschler-Laszkiewicz I, Zhang W, Keefer K, et al. Trpc2 depletion protects red blood cells from oxidative stress-induced hemolysis. Exp Hematol. 2012;40:71–83. doi: 10.1016/j.exphem.2011.09.006. [DOI] [PMC free article] [PubMed] [Google Scholar]
- 60.Inabe K, Ishiai M, Scharenberg AM, Freshney N, Downward J, Kurosaki T. Vav3 modulates B cell receptor responses by regulating phosphoinositide 3-kinase activation. J Exp Med. 2002;195:189–200. doi: 10.1084/jem.20011571. [DOI] [PMC free article] [PubMed] [Google Scholar]
Associated Data
This section collects any data citations, data availability statements, or supplementary materials included in this article.