Abstract
The development of new analytical methods to accurately quantify hydrogen peroxide is of great interest. In the current study, we developed a new magnetic resonance (MR) method for noninvasively quantifying hydrogen peroxide (H2O2) in aqueous solutions based on chemical exchange saturation transfer (CEST), an emerging MRI contrast mechanism. Our method can detect H2O2 by its specific CEST signal at ~6.2 ppm downfield from water resonance, with more than 1000 times signal amplification compared to the direct NMR detection. To improve the accuracy of quantification, we comprehensively investigated the effects of sample properties on CEST detection, including pH, temperature, and relaxation times. To accelerate the NMR measurement, we implemented an ultrafast Z-spectroscopic (UFZ) CEST method to boost the acquisition speed to 2 s per CEST spectrum. To accurately quantify H2O2 in unknown samples, we also implemented a standard addition method, which eliminated the need for predetermined calibration curves. Our results clearly demonstrate that the presented CEST-based technique is a simple, noninvasive, quick, and accurate method for quantifying H2O2 in aqueous solutions.
Graphical Abstract
Hydrogen peroxide (H2O2) is widely used in a variety of industrial applications.1 It is the most versatile agent for pulp- and paper-bleaching,2 treating pollutants, and eliminating organic and inorganic contaminants in wastewater.3 It is also an important biological molecule involved in redox processes, for instance as a key component in cell signaling pathways, and highly relevant to oxidative stress and inflammation.4,5 In tissue engineering, H2O2 is utilized as a highly efficient and clean oxygen generating agent that has been demonstrated to supply oxygen to transplanted stem cells.6,7 In the latter application, H2O2-encapsulated polymeric carriers are incorporated into stem cell supporting scaffolds that contain catalase, and after being released from the carriers, H2O2 is hydrolyzed by catalase into H2O and O2.8–11 Due to the importance of H2O2, numerous analytical methods have been developed to detect and quantify it, including potassium permanganate titration,12 infrared, Raman spectrophotometry,13,14 and fluorescence spectroscopy.15 Most of these methods however are destructive as they require the addition of reagents to the original samples. As a versatile noninvasive analytical tool, 1H NMR spectroscopy has also been exploited for the quantification of H2O2.16–19 For example, Stephenson and Bell quantified H2O2 using its unique 1H NMR signal at around 10–11 ppm in both aqueous and nonaqueous solutions.17 Relaxometric NMR analysis can also report the detection of H2O2 due to its transverse relaxation time (T2) enhancing ability.18 Unlike the method reported by Stephenson, NMR relaxometry has been applied to monitor heterogeneous catalysis systems dynamically, despite its detectability being only around 0.1%. Recently, another ultrasensitive 1H NMR method was reported with a 20 μM detection limit.19 However, this method requires the combined use of DMSO-d6, cryoprotective and low-temperature measurements (260 K or −13 °C) which required a total acquisition time of approximately 10 min.
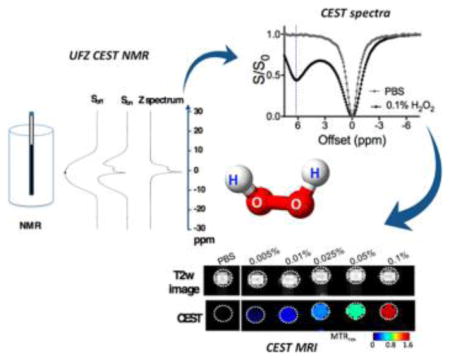
In this study, we aimed to develop a new H2O2 detecting MR method using chemical exchange saturation transfer (CEST), a recently emerged MR contrast-generating technology.20–23 The CEST technology has been demonstrated in many studies for specifically detecting a wide array of labile protons of the exchange rate (kex) in the slow to intermediate regime (i.e., kex < Δω, where Δω is the chemical shift difference between the proton and water).24–26 The CEST principle can be applied to the detection of H2O2 because, in aqueous solution, H2O2 forms a hydrogen bonding network,27 where each H in H2O2 interacts with two O atoms from neighboring H2O2 and OH−, resulting in exchangeable protons with a chemical shift at ~11 ppm, or Δω ~ 6.3 ppm, making it quite suitable for CEST detection.28 It should be noted that, different from NMR convention, the chemical shift offset by CEST MRI convention is defined as the frequency difference (Δω) between a proton pool and water protons, which will be used in the rest of this work. In the present study, we sought to exploit this unique CEST signal for the accurate quantification of H2O2 in aqueous solutions. The acquisition speed of spectral detection can be significantly improved using a fast detection strategy, namely, ultrafast Z-spectroscopy (UFZ),29–31 making the method ideal for the quantification of uniform aqueous samples in a small volume. Moreover, as demonstrated in our studies, this method can be directly used for MRI detection of H2O2 without the need for any extra imaging agents.
MATERIALS AND METHODS
Chemicals and Sample Preparation
All compounds were purchased from Sigma (St. Louis, MO, USA). The concentration of H2O2 in the stock solution was verified using a Fluorimetric Hydrogen Peroxide Assay kit (Sigma). All the samples were prepared freshly immediately before NMR or MRI measurements.
Preparation of Samples for MR Imaging
All MRI samples were prepared using 1.5 mL Eppendorf tubes and transferred to 1 mm o.d. capillaries for MRI measurement.32 H2O2 solutions at concentrations of 0%, 0.005%, 0.01%, 0.025%, 0.05%, and 0.1%, corresponding to 0, 1.47, 2.94, 7.4, 14.7, and 29.4 mM, were prepared in 10 mM phosphate buffered saline (PBS) and titrated to pH = 6.0. To investigate the influence of sample relaxation times on CEST quantification, solutions of 0.05% H2O2 (7.4 mM, pH = 6.0) with different T1/T2 times were prepared by adding Gd-DTPA at final concentrations of 0.01, 0.1, and 0.5 mM.
MRI Measurement and Analysis
All in vitro MRI data sets were acquired at 37 °C on a 9.4 T Bruker Avance system equipped with a 20 mm birdcage RF coil using a previously reported protocol.32 A modified single slice rapid acquisition with relaxation enhancement (RARE) pulse sequence was used to acquire CEST weighted images with saturation offset frequencies from −8 to 8 ppm (step = 0.2 ppm) with respect to water resonance (set to 0 ppm by MRI convention). The imaging parameters were TR = 10 s, effective TE = 43.2 ms, RARE factor = 32, slice thickness = 1 mm, matrix size = 64 × 64, resolution = 0.25 × 0.25 mm2, and number of averages = 2. The saturation parameters were as follows: rectangular RF pulse; saturation times (Tsat) = 1, 2, 3, 4, and 6 s; and saturation field strengths (B1) = 1.2, 2.4, 3.6, 4.7, and 5.9 μT. The WASSR method32,33 was used to correct B0 inhomogeneity.
All data were processed using custom-written Matlab scripts. Conventionally, MTRasym is used to quantify CEST effect by, to a large extent, removing other effects from the acquired Z-spectrum, including the water direct saturation effect and possible magnetization transfer (MT) effects, which are assumed to be symmetric with respect to the water resonance.23 The MTRasym is defined as
| (1) |
where Δω is the frequency difference of the protons of interest with respect to the water protons and S and S0 are the signals acquired with and without saturation, respectively.
To achieve a linear relationship over a broad concentration range, we also adapted the MTRrex metric34 in our study, which is the reciprocal format of Z-spectral data:
| (2) |
To achieve T1 relaxation time compensated CEST quantification, we used the apparent exchange-dependent relaxation (AREX) metric:34
| (3) |
Longitudinal (T1) relaxation times of the samples were measured using a RARE-based saturation recovery sequence with eight TR times ranging between 200 and 15,000 ms. T1 values were estimated by fitting the ROI intensities to eq 4 using Matlab,
| (4) |
where S(TR) is the MRI signal at a certain TR time, and the theoretical maximal MRI signal S0 and T1 time are the parameters to be estimated.
In addition, transverse (T2) relaxation times were measured using the same RARE sequence with a CPMG preparation period inserted before the imaging readout.35 The inter-echo time delay (τCMPG) was fixed at 10 ms, and the pulse numbers were varied from 4 to 1024. The acquisition time for each T2-weighted image was 25 s. T2 relaxation times were estimated by fitting the ROI values to eq 5 using Matlab,
| (5) |
where S(TE) are the MRI signal at each TE time, and the theoretical maximal MRI signal S0 and T2 time are the parameters to be estimated.
Preparation of Samples for NMR Measurement
All NMR samples were prepared in 5 mm NMR tubes. To study the pH effect on CEST, the pH of H2O2 solutions (concentration = 0.025% or 7.4 mM) was titrated to 4, 4.5, 5.5, 6, 6.5, 7, 7.5, and 8. Concentration calibration curves at each pH were acquired using concentrations of 0, 0.0025%, 0.005%, 0.01%, 0.025%, and 0.05%, corresponding to 0, 0.74, 1.47, 2.94, 7.4, and 14.7 mM.
NMR Spectroscopy
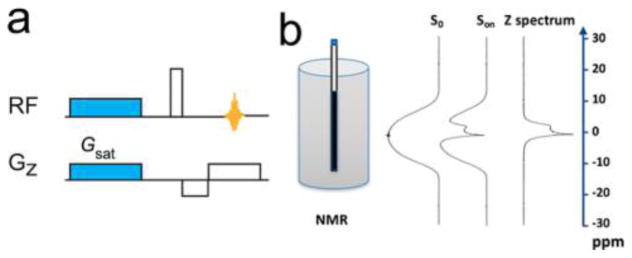
All NMR measurements were acquired using a Bruker Avance 300 MHz spectrometer with a standard z gradient for dephasing. Nondeuterated samples were used for the study, and chemical shift referencing was with respect to the H2O signal in the 1H NMR spectrum. The gradient echo UFZ sequence shown in Figure 1a was utilized and saturation was achieved with a continuous wave RF power (B1) of 5.7 μT for duration (Tsat) of 1.6 s. A gradient field of 12.5 μT/mm was applied concurrently with the RF saturation pulse along the Z-direction. To reduce the effect of eddy currents, a 5 ms delay was introduced between the saturation pulse gradient and the readout excitation pulse (4.29 μs, 58.28 kHz). The dephasing/rephasing gradients were both 12.5 μT/mm with opposite phases. As illustrated in Figure 1b, a reference scan (S0) in which the saturation power was set at 0 was performed for signal normalization, i.e., Snorm(z) = Son(z)/S0(z). The normalization by S0 can effectively cancel out the effect of B0 inhomogeneity from the final Z-spectra. For each CEST experiment, the scan time was 1.7 s; however, a 20 s wait period was introduced between the reference and the CEST scan to allow the magnetization to fully recover. When not otherwise noted, all NMR measurements were conducted at 37 °C. The temperature effect of CEST quantification was studied by measuring the CEST signal of 0.1% H2O2 solutions (6.0 and 7.0) at 22, 27, 32, 37, 42, and 47 °C.
Figure 1.
Illustration of (a) UFZ pulse sequence and (b) how to generate a Z-spectrum using the UFZ method.
A standard addition (spiking) method was used to determine the H2O2 concentration in an unknown sample without predetermined calibration curves.36 In brief, three groups of H2O2 solutions (pH 6.0) at concentrations of 0.01, 0.025, and 0.05% were used as “unknown” samples. In each group, four different T1 times were achieved by adding Gd-DTPA at final concentrations of 0.01, 0.1, and 0.5 mM, resulting in a total of 12 unknown samples. After the first NMR measurement of each original sample, a 25 μL standard H2O2 solution (concentration = 0.2% and pH = 6.0) was added to the NMR tube and CEST was measured again. The addition of spiking standard and CEST measurement were repeated three times. Assuming that the addition of small volumes of spiking standards did not change the properties of the original samples significantly, the measured CEST signal changes proportionally to the H2O2 concentration according to eq 6. Thus, a linear regression was performed on the plots of the measured CEST signal with respect to the concentration added at each time, and the original H2O2 concentration was estimated by the x-intercept of the extrapolated regression line,
| (6) |
where C is a constant, determined by the saturation parameters and the CEST properties of the exchangeable protons. V0 and Vadd are the volumes of the original sample and standard solution, respectively. Cunknown and Cstd are the concentration to be determined and that of spiking standard solutions, respectively.
RESULTS AND DISCUSSION
CEST NMR and MRI Detection of H2O2 in Aqueous Solution
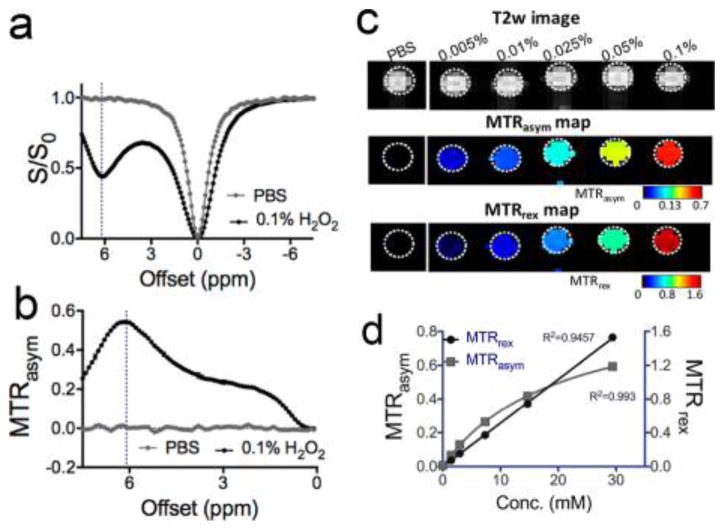
Unless otherwise noted, chemical shifts by the magnetization transfer MRI convention are used throughout this work. Whereas only a small T2 contrast and negligible T1 contrast can be detected (Figure S1, Supporting Information), H2O2 (0.1%, pH 6.0, and 37 °C) produced a distinct CEST signal at 6.2 ppm (Figure 2a,b). The 6.2 ppm CEST signal is attributed to the H atoms in the H2O2–H2O hydrogen bond network. This chemical shift is slightly smaller than the 6.3 ppm reported by Stephenson and Bell (acquired at room temperature) 17 possibly due to the fact that our studies were carried out at 37 °C. The 1.5 ppm signal is attributed to the H2O (or OH−) interacting with H2O2, which is consistent with the NMR spectroscopic study of H2O2 in aqueous solution.37 Alternatively, this could be a broader component toward the water frequency which may be due to partial coalescence with water protons. Figure 2b shows that 0.1% H2O2 (~30 mM per molecule or 60 mM per exchangeable proton) produced a remarkable CEST effect, i.e., an MTRasym of 0.543, corresponding to a 54.3% change in water signal, using a saturation pulse of 4.7 μT and 4 s. Considering the concentration of water protons is 110 M, our result suggests that CEST detection achieved an amplification ratio of (54.3% × 110 M)/(60 mM) ≃ 1000. It should be noted that the CEST signal highly depends on saturation parameters such as B1 and Tsat (Figure S2, Supporting Information). The exchange rate of H2O2 was estimated to be 460 and 1.4 kHz for CEST signals at 1.5 and 6.2 ppm, respectively, at pH 6.0 and 37 °C using the Bloch fitting of QUEST data (Figure S3, Supporting Information),38 in good agreement with previous reports.28 This specific CEST signal hence allows a high spatial resolution MRI detection of H2O2 as shown in Figure 2c. Our results show that CEST MRI can be used to detect H2O2 in solution down to the millimolar concentration range (0.005% = 1.47 mM). Figure 2d showed that concentration dependence of two CEST quantification metrics, MTRasym and MTRrex, with the former fitted with a linear function and the later fitted with the Michaelis–Menten function.39 Among them, the MTRrex provides a larger dynamic range linearly with the concentrations of H2O2 and therefore was chosen to quantify the CEST signal of H2O2 in the rest of this work.
Figure 2.
CEST MRI detection of H2O2: (a) Z-spectra and (b) MTRasym plots of 0.1% H2O2 in pH 6.0 PBS and just PBS solution; (c) T2-weighted image, MTRasym map, and MTRrex map of six samples containing different H2O2 in pH 6.0 PBS; (d) concentration dependence of the mean CEST signals (triplicate), as quantified by MTRasym and MTRrex.
CEST Quantification as a Function of T1 Times
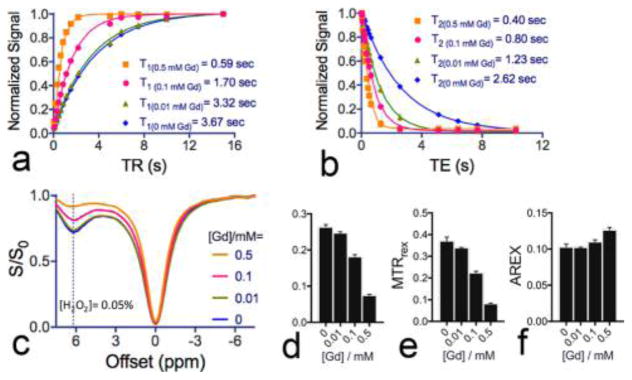
To investigate the confounding effects of sample T1 relaxation times on CEST quantification, we prepared 0.1% H2O2 solutions doped with different Gd-DTPA and acquired the CEST signal of them. As shown in Figure 3a, after the addition of Gd-DTPA, sample T1 relaxation times decreased from 3.670 ± 0.017 to 0.591 ± 0.005 s, and in Figure 3b, T2 times decreased from 2.618 ± 0.072 s to 0.403 ± 0.005 s. As expected, the decrease in T1 times resulted in a striking reduction in CEST signal (Figure 3c). For example, when T1 was changed from 3.67 to 0.59 s, MTRasym decreased by 72% (Figure 3d) and MTRrex by 78% (Figure 3e), the same within error as expected for an inverse parameter. In contrast, when the apparent exchange-dependent relaxation (AREX) parameter, a previously reported relaxation time compensated CEST metric,34 was used, the relative change was reduced to 0.5% (AREX = 0.103 ± 0.003) and 6.9% (AREX = 0.110 ± 0.003) for samples with 0.01 mM (T1 = 3.32 s) and 0.1 mM (T1 = 1.70 s) Gd-DTPA, respectively, compared to the sample without Gd-DTPA (AREX = 0.103 ± 0.004 and T1 = 3.67 s). Even when 0.5 mM Gd-DTPA was added (T1 = 0.59 s), the AREX was calculated to be 0.127 ± 0.004, corresponding to a relatively small change of 22.9%. The relatively large error may be caused by markedly shortened T2 time by Gd-DTPA (i.e., changed from 2.62 to 0.4 s). Our results suggested that using AREX to quantify the CEST signal of H2O2 could effectively compensate the confounding effect of relaxation times up to a certain limit and improve the CEST quantification when the changes in T1 relaxation times are not dramatic.
Figure 3.
Quantification of the CEST signals of H2O2 samples with different T1 and T2 relaxation times: (a) T1 and (b) T2 measurements of four samples containing different concentrations of Gd-DTPA and 0.1% H2O2; (c) corresponding Z-spectra of the four samples; (d) MTRasym, (e) MTRrex, and (f) AREX of the four samples based on the Z-spectra shown in panel c.
pH Dependence of the CEST Signal of H2O2
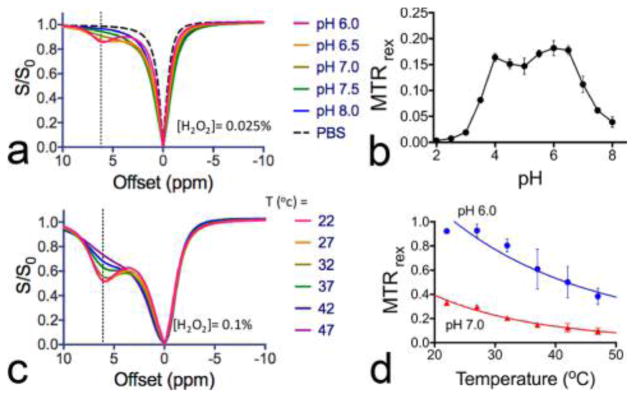
Since proton exchange is either acid- or base-catalyzed, the solution pH often affects the CEST signal strongly. The pH effect on the CEST signal of H2O2 is clear from the changes in the Z-spectral shape of H2O2 solutions at different pHs (Figure 4a). To fully investigate the pH dependence, we measured the CEST signal of 0.025% H2O2 from pH 2 to pH 8 at 6.2 ppm (Figure 4b). In the pH range studied, 0.025% H2O2 produced the strongest CEST signal at pH ~ 6, i.e., an MTRrex of 0.182 ± 0.015. In the pH range from 5 to 8, where base catalysis is the dominant mechanism,27 exchange rates increase with increasing pH. Hence, the CEST signal increased with increasing pH in the pH range of 5–6. However, when pH was higher than 6.0, because the exchange rate becomes too fast, the CEST signal decreased with increasing pH. For example, the MTRrex at pH 7.5 is only 0.062 ± 0.006, approximately 34.1% of that at pH 6.0. When pH is below 5.0, the proton exchange is dominated by acid-catalysis mechanism and exchange rates increase with decreasing pH.27 Similar to the trend showing in the pH range of 5–8, the CEST signal first slightly increases when pH drops from 5 to 4 and then decreases steeply when pH further decreases from 4 to 2 because exchange rates become too fast.
Figure 4.
Effects of pH and temperature on the CEST signal of H2O2: (a) Z-spectra and (b) MTRrex values at 6.2 ppm of H2O2 solution at different pHs at 37 °C; (c) Z-spectra and (d) MTRrex values at 6.2 ppm of pH 6.0 and pH 7.0 H2O2 solutions at different temperatures (dots) and the fitting of the temperature data into the Arrhenius equation39 (lines).
Temperature Dependence of the CEST Signal H2O2
Similar to pH, temperature may strongly affect proton exchange rates and hence CEST signals. As such, we investigated the effect of temperature on the CEST signal of H2O2 over the range from 22 to 47 °C. As shown in Figure 4c, a strong negative temperature dependence can be observed on the CEST signal of H2O2 solutions (0.1%) at pH 6.0 and 7.0. For example, when temperature increased from 22 to 37 °C, the MTRrex of 0.1% H2O2 at pH 6.0 dropped by 34% (from 0.922 to 0.608) and that at pH 7.0 dropped by 55% (from 0.329 to 0.148). This negative temperature dependence at these pH values can be attributed to the increased exchange rates at higher temperature following the Arrhenius equation.28,40 Because the exchange rate of H2O2 is already in the intermediate regime when pH > 6, an increased exchange rate would reduce the apparent CEST signal due to coalescence of the H2O2 proton resonance with the water proton resonance. Our results therefore suggest that measuring at a low temperature may potentially improve the sensitivity of CEST detection greatly when pH > 6. Moreover, the temperature should be assured to be constant throughout the CEST measurement series.
CEST Detectability
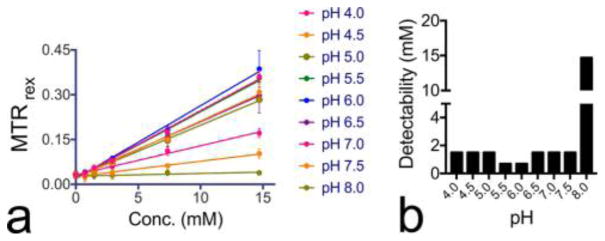
To determine the CEST MR detectability at each pH, defined as the minimal concentration that CEST MR can reliably detect for the current RF coil, we first acquired the calibration curves of H2O2 at different pH values over the concentration range from 0.74 to 14.7 mM. To avoid systematic errors, three independent measurements were performed on different days with samples freshly prepared each time. As shown in Figure 5, the obtained calibration curves showed a good linearity for all pHs. Then we used the Student’s t test (two-tailed and paired) to determine the minimal concentration generating a statistically significant CEST signal (i.e., P > 0.005) with respect to that of simple PBS samples, and listed the results in Table S-1 (Supporting Information). At most pH values, CEST detectability was about 1.5 mM; the highest detectability (~0.74 mM) could be achieved at pH 5.5 and pH 6.0, whereas the lowest detectability (~14.7 mM) was observed at pH 8.0. Our results imply that a millimolar level detectability can be achieved except for H2O2 in solutions with basic pH, providing a more sensitive and fast approach than traditional NMR methods. For comparison, the fast relaxometry-based NMR approach was reported to have a detectability ~ 0.1% (29.4 mM) for pH between 4.5 and 5.5, and 0.5% (147 mM) when pH = 7.18 Our method appears to be 2 orders of magnitude more sensitive. The 1H NMR technique reported by Stephenson and Bell had a detection limit down to 1 mM in aqueous solution at 21 °C using a 400 MHz NMR spectrometer, with a temporal resolution of 30 s,17 with a line width, however, of over 250 Hz. Considering our CEST NMR measurements were conducted at 37 °C using a lower field scanner (300 MHz) and at an acquisition time of ~2 s, our method is indeed more sensitive and, more importantly, readily applied to inhomogeneous samples.29 However, it should be noted that the actual detectability also depends on the level of noise, which can be strongly affected by the hardware and experiment condition in an MRI or NMR study.
Figure 5.
(a) Calibration curves of H2O2 solutions at different pHs; (b) detectability of H2O2 at different pHs.
Another 1H NMR method was recently reported by Constantinos et al. to have a detection limit of 20 μM.19 However, it required the combination of DMSO-d6, cryoprotection, a low measurement temperature (–13 °C), and a long acquisition time (10 min). In contrast, our approach does not require specific agents and sample preparation procedure, and measurement conducted at 37 °C, hence, could have a broader application. Moreover, based on the temperature dependence studies shown in Figure 4d, our CEST MRI can also gain much higher sensitivity at a low temperature.
Quantification of H2O2 Using Standard Addition
While calibration curves such as those shown in Figure 5 can be used to quantify H2O2 in unknown samples, an accurate CEST quantification requires measurements of pH and T1 relaxation times, and use of acquisition parameters identical to those used for the predetermined calibration curves. It is highly desirable to have a more robust method that can be used to quantify H2O2 without the need for a priori calibration curve. To this end, we used a standard addition (spiking) strategy, a commonly used analytical technique to overcome matrix interference.36 To demonstrate the utility of this standard addition method, we chose to vary the sample T1 time among the three most confounding factors (pH, temperature, and T1 time) and set it as the unknown factor in the present study. Sample T1 times were adjusted from 3.2 to 0.6 s using Gd-DTPA. CEST signals before and after each addition of standard solution were measured and plotted as the final concentrations of standard solution added (eq 6).
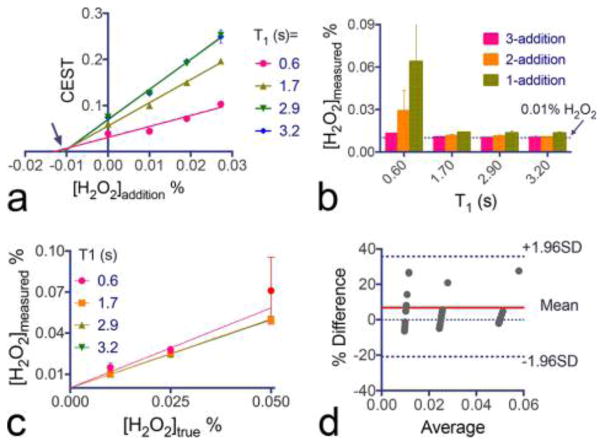
Figure 6a shows that the original concentration of H2O2 in the sample can be determined by the x-intercept of the linear regression. Our results showed that the linear regression with three additions fitted well with the experimental data and, except in the sample with dramatically shortened T1, provided an excellent estimation of the original concentration, i.e., measured concentration (Cmeasured) = 0.010 ± 0.001% for all the samples (true concentration Ctrue = 0.01%). When T1 was 0.6 s, Cmeasured was estimated to be 0.015 ± 0.003%. To investigate how many additions are required to generate an accurate estimation, we compared the measured H2O2 concentration as a function of the number of standard additions. As shown in Figure 6b, except the samples with very short T1, the results obtained using one addition produced a 30–40% error (Cmeasured = 0.013–0.014%) and those for the two addition protocol a 10–20% error (Cmeasured = 0.011–0.012%), indicating that a three addition should be used to obtain sufficiently high accuracy.
Figure 6.
Linear regression of H2O2 and Gd-DTPA mixture using three additions of spiking standard solutions: (a) linear regression of the CEST signals before and after three additions of 0.2% H2O2 standard solution (25 μL each time to an original 475 μL volume; the arrow points to the true original H2O2 concentration (0.01%)); (b) measured H2O2 concentrations using different numbers of standard addition, from 1 to 3, for the same 0.01% H2O2 with T1 times; (c) correlation and (d) Bland–Atman plot of the measured H2O2 concentrations and the “true” concentrations for all three H2O2 concentrations and four different T1 times, where x-axis and y-axis are the average and difference (%) of the measured concentration and the “true” values, respectively. All data points are shown as mean ± standard deviations of triplicate samples.
Using the same three standard addition method, we also measured H2O2 samples with concentrations of 0.025 and 0.05%, and correlated the measured H2O2 concentrations with their true values. Both the correlation study (Figure 6c) and Bland–Altman analysis (Figure 6d) showed a very good agreement between Cmeasured and Ctrue in each T1 time group; i.e., the Pearson correlation coefficients (R2) were 0.9994, 0.9998, 0.9998, and 0.9750 and the slopes of fitted lines were 1.167 ± 0.1324, 1.002 ± 0.00989, 1.005 ± 0.00584, and 0.9928 ± 0.009549 for T1 of 0.6, 1.7, 2.9, and 3.2 s, respectively. For T1 times of 3.2, 2.9, 1.7, and 0.6 s, respectively. The data point for 0.05% H2O2 at T1 time of 0.6 s is considered an outlier and excluded from the fitting. This outlier may be caused by the small signal increase after each addition when the concentration of the original solution is close to the standard solution (0.05% vs 0.2%) and only a small volume was added each time (i.e., 25 μL each time to an original 475 μL volume). To obtain high accuracy, one should always use the standard solution at a sufficiently high concentration. In addition, using high concentration standard solutions allows the use of smaller addition volumes, which can effectively reduce the potential impact of the addition solutions on the original solution properties, such as T1 times and pH.
Nevertheless, our results clearly demonstrated that accurate measurement of H2O2 concentration could be achieved using the standard addition approach, eliminating the need for a predetermined calibration curve, which best fits the measurement of a few samples. For high-throughput screening of a large volume of samples, the standard addition may result in a significant increase of measurement time. The standard addition is also not suitable for monitoring the change in H2O2 dynamically. In these scenarios, the standard method with predetermined calibration curves still should be used.
CONCLUSIONS
In the present study, we successfully developed a new MR method for the quantification of H2O2 in aqueous solutions using the CEST principle. The potential effects of sample properties, including pH, temperature, and relaxation times, on CEST MRI detection were comprehensively investigated. We used a recently developed UFZ CEST method to greatly boost the acquisition speed to be on the order of seconds. Furthermore, we demonstrated the use of the standard addition method to accurately determine the H2O2 concentration in unknown samples without the need for predetermined calibration curves. Our results clearly show that the present CEST-based technique is a noninvasive, quick, and accurate quantitative method for detecting H2O2 in aqueous solutions.
Compared to other available analytical methods, the proposed CEST method has a number of tempting advantages. First, the CEST mechanism provides a great amplification of the NMR signal of exchangeable protons. For instance, our results show that 0.1% H2O2 (~60 mM exchange proton) can generate a CEST effect of 54.3% (MTRasym), corresponding to an amplification ratio of ~1000. Second, the CEST NMR method is a noninvasive and simple method that can directly detect H2O2 in aqueous solution without the need for sample extraction and the use of deuterated solvents. Third, the UFZ CEST method allows ultrafast acquisition, e.g., <2 s per Z-spectrum in the current study, which no doubt is highly desirable for many applications where the H2O2 concentration needs to be monitored dynamically with high temporal resolution. Furthermore, the ease of sample preparation and fast acquisition allows the utilization of the standard addition approach to quantify H2O2 without the need for a priori information on the sample properties nor a predetermined calibration curve. Finally, as demonstrated in our study, CEST also allows MRI detection, which can be further accelerated by incorporating the UFZ approach, making this method potentially useful for heterogeneous samples and biomedical imaging, implying the proposed method has a broad spectrum of potential applications.
Supplementary Material
Acknowledgments
This work was supported by National Institutes of Health (NIH) Grants R03EB021573, R01CA211087, R21CA215860, and R01EB015032.
Footnotes
Notes
The authors declare no competing financial interest.
ASSOCIATED CONTENT
The Supporting Information is available free of charge on the ACS Publications website at DOI: 10.1021/acs.anal-chem. 7b01763.
Effect of H2O2, saturation time and power and pH dependence impacts, H2O2 exchange rate estimation, and CEST MR repeatability and detectability (PDF)
References
- 1.Jones CW. Applications of hydrogen peroxide and derivatives. Vol. 2 Royal Society of Chemistry; 1999. [Google Scholar]
- 2.Hage R, Lienke A. Angew Chem, Int Ed. 2005;45:206–222. doi: 10.1002/anie.200500525. [DOI] [PubMed] [Google Scholar]
- 3.Pardieck DL, Bouwer EJ, Stone AT. J Contam Hydrol. 1992;9:221–242. [Google Scholar]
- 4.Rhee SG. Science. 2006;312:1882–1883. doi: 10.1126/science.1130481. [DOI] [PubMed] [Google Scholar]
- 5.Veal EA, Day AM, Morgan BA. Mol Cell. 2007;26:1–14. doi: 10.1016/j.molcel.2007.03.016. [DOI] [PubMed] [Google Scholar]
- 6.Oh SH, Ward CL, Atala A, Yoo JJ, Harrison BS. Biomaterials. 2009;30:757–762. doi: 10.1016/j.biomaterials.2008.09.065. [DOI] [PubMed] [Google Scholar]
- 7.Harrison BS, Eberli D, Lee SJ, Atala A, Yoo JJ. Biomaterials. 2007;28:4628–4634. doi: 10.1016/j.biomaterials.2007.07.003. [DOI] [PubMed] [Google Scholar]
- 8.Ng SM, Choi JY, Han HS, Huh JS, Lim JO. Int J Pharm. 2010;384:120–127. doi: 10.1016/j.ijpharm.2009.10.005. [DOI] [PubMed] [Google Scholar]
- 9.Abdi SI, Ng SM, Lim JO. Int J Pharm. 2011;409:203–205. doi: 10.1016/j.ijpharm.2011.02.041. [DOI] [PubMed] [Google Scholar]
- 10.Abdi SIH, Choi JY, Lau HC, Lim JO. Tissue Eng Regener Med. 2013;10:131–138. [Google Scholar]
- 11.Bae SE, Son JS, Park K, Han DK. J Controlled Release. 2009;133:37–43. doi: 10.1016/j.jconrel.2008.09.006. [DOI] [PubMed] [Google Scholar]
- 12.Huckaba CE, Keyes FG. J Am Chem Soc. 1948;70:1640–1644. doi: 10.1021/ja01184a098. [DOI] [PubMed] [Google Scholar]
- 13.Vacque V. Spectrochimica Acta Part A: Molecular Spectroscopy. 1997;53:55–66. [Google Scholar]
- 14.Vacque V, Dupuy N, Sombret B, Huvenne JP, Legrand P. Appl Spectrosc. 1997;51:407–415. [Google Scholar]
- 15.Lazrus AL, Kok GL, Gitlin SN, Lind JA, Mclaren SE. Anal Chem. 1985;57:917–922. [Google Scholar]
- 16.Monakhova YB, Diehl BWK. Anal Methods. 2016;8:4632–4639. [Google Scholar]
- 17.Stephenson NA, Bell AT. Anal Bioanal Chem. 2005;381:1289–1293. doi: 10.1007/s00216-005-3086-7. [DOI] [PubMed] [Google Scholar]
- 18.Buljubasich L, Blumich B, Stapf S. Chem Eng Sci. 2010;65:1394–1399. [Google Scholar]
- 19.Tsiafoulis CG, Gerothanassis IP. Anal Bioanal Chem. 2014;406:3371–3375. doi: 10.1007/s00216-014-7745-4. [DOI] [PubMed] [Google Scholar]
- 20.van Zijl PC, Yadav NN. Magn Reson Med. 2011;65:927–948. doi: 10.1002/mrm.22761. [DOI] [PMC free article] [PubMed] [Google Scholar]
- 21.Ward K, Aletras A, Balaban R. J Magn Reson. 2000;143:79–87. doi: 10.1006/jmre.1999.1956. [DOI] [PubMed] [Google Scholar]
- 22.van Zijl PCM, Sehgal AA. eMagRes. 2016;5:1307–1332. [Google Scholar]
- 23.Liu G, Song X, Chan KW, McMahon MT. NMR Biomed. 2013;26:810–828. doi: 10.1002/nbm.2899. [DOI] [PMC free article] [PubMed] [Google Scholar]
- 24.Li Y, Chen H, Xu J, Yadav NN, Chan KW, Luo L, McMahon MT, Vogelstein B, van Zijl PC, Zhou S, Liu G. Oncotarget. 2016;7:6369–6378. doi: 10.18632/oncotarget.7141. [DOI] [PMC free article] [PubMed] [Google Scholar]
- 25.Liu G, Bettegowda C, Qiao Y, Staedtke V, Chan KW, Bai R, Li Y, Riggins GJ, Kinzler KW, Bulte JW, McMahon MT, Gilad AA, Vogelstein B, Zhou S, van Zijl PC. Magn Reson Med. 2013;70:1690–1698. doi: 10.1002/mrm.24955. [DOI] [PMC free article] [PubMed] [Google Scholar]
- 26.Liu H, Jablonska A, Li Y, Cao S, Liu D, Chen H, Van Zijl PC, Bulte JW, Janowski M, Walczak P, Liu G. Theranostics. 2016;6:1588–1600. doi: 10.7150/thno.15492. [DOI] [PMC free article] [PubMed] [Google Scholar]
- 27.Anbar M, Loewenstein A, Meiboom S. J Am Chem Soc. 1958;80:2630–2634. [Google Scholar]
- 28.Zhang S. Direct Detection of Hydrogen Peroxide via 1H CEST-MRI. Proceedings of the Joint Annual Meeting ISMRM-ESMRMB; May 19–25, 2007; Berlin, Germany. Concord, CA, USA: International Society for Magnetic Resonance in Medicine; 2007. [Google Scholar]
- 29.Xu X, Lee JS, Jerschow A. Angew Chem, Int Ed. 2013;52:8281–8284. doi: 10.1002/anie.201303255. [DOI] [PMC free article] [PubMed] [Google Scholar]
- 30.Boutin C, Leonce E, Brotin T, Jerschow A, Berthault P. J Phys Chem Lett. 2013;4:4172–4176. [Google Scholar]
- 31.Xu X, Yadav NN, Song X, McMahon MT, Jerschow A, van Zijl PC, Xu J. J Magn Reson. 2016;265:224–229. doi: 10.1016/j.jmr.2016.02.015. [DOI] [PMC free article] [PubMed] [Google Scholar]
- 32.Liu G, Gilad AA, Bulte JW, van Zijl PC, McMahon MT. Contrast Media Mol Imaging. 2010;5:162–170. doi: 10.1002/cmmi.383. [DOI] [PMC free article] [PubMed] [Google Scholar]
- 33.Kim M, Gillen J, Landman B, Zhou J, van Zijl P. Magn Reson Med. 2009;61:1441–1450. doi: 10.1002/mrm.21873. [DOI] [PMC free article] [PubMed] [Google Scholar]
- 34.Zaiss M, Xu J, Goerke S, Khan IS, Singer RJ, Gore JC, Gochberg DF, Bachert P. NMR Biomed. 2014;27:240–252. doi: 10.1002/nbm.3054. [DOI] [PMC free article] [PubMed] [Google Scholar]
- 35.Yadav NN, Xu J, Bar-Shir A, Qin Q, Chan KW, Grgac K, Li W, McMahon MT, van Zijl PC. Magn Reson Med. 2014;72:823–828. doi: 10.1002/mrm.25329. [DOI] [PMC free article] [PubMed] [Google Scholar]
- 36.Ellison SL, Thompson M. Analyst. 2008;133:992–997. doi: 10.1039/b717660k. [DOI] [PubMed] [Google Scholar]
- 37.Gun’ko V, Turov V, Turov A. Chem Phys Lett. 2012;531:132–137. [Google Scholar]
- 38.McMahon MT, Gilad AA, Zhou J, Sun PZ, Bulte JWM, van Zijl PCM. Magn Reson Med. 2006;55:836–847. doi: 10.1002/mrm.20818. [DOI] [PMC free article] [PubMed] [Google Scholar]
- 39.Ali MM, Liu G, Shah T, Flask CA, Pagel MD. Acc Chem Res. 2009;42:915–924. doi: 10.1021/ar8002738. [DOI] [PMC free article] [PubMed] [Google Scholar]
- 40.Zhang S, Malloy CR, Sherry AD. J Am Chem Soc. 2005;127:17572. doi: 10.1021/ja053799t. [DOI] [PMC free article] [PubMed] [Google Scholar]
Associated Data
This section collects any data citations, data availability statements, or supplementary materials included in this article.


