Abstract
Intracranial aneurysm (IA) is a devastating disease, the pathogenesis of which remains to be elucidated. The present study aimed to determine the molecular mechanism of IA and to identify potential therapeutic targets using bioinformatics analysis. The GSE54083 dataset, which includes data from patients with ruptured IA and superficial temporal artery controls, was downloaded from the Gene Expression Omnibus, and differentially expressed genes (DEGs) were identified in the ruptured IA samples using the limma package in R. Subsequently, the Database for Annotation, Visualization and Integrated Discovery software was used to perform function and pathway enrichment analyses and the Search Tool for the Retrieval of Interacting Genes database was used to construct the protein-protein interaction (PPI) network. Then, microRNA (miRNA) target and transcription factor (TF) target pairs were identified using the miR2Disease, MiRwalk2, ITFP and TRANSFAC databases. Finally, an integrated network of TF-target-miRNAs was constructed using Cytoscape. A total of 402 upregulated DEGs and 375 downregulated DEGs were identified from the ruptured IA samples compared with the superficial temporal artery samples. The majority of the upregulated DEGs were significantly enriched in the immune system development category, including CD40 ligand (CD40LG) and CD40 and the downregulated DEGs, such as striatin (STRN), were enriched in neuron projection development. In addition, nitric oxide synthase 1 (NOS1), a target of miRNA-125b, and myosin heavy chain 11 (MYH11), a target of minichromosome maintenance complex component 4 (MCM4), had higher degree scores in the integrated network. These findings suggest that CD40, CD40LG, NOS1, STRN, MCM4, MYH11 and miR-125b may be potential therapeutic targets for the treatment of IA.
Keywords: intracranial aneurysm, differentially expressed genes, transcription factors, microRNA, integrated network
Introduction
Intracranial aneurysm (IA), also termed cerebral aneurysm, is a localized abnormal widening of a cerebral artery lumen or arterial wall due to increased intracranial pressure (1). The estimated prevalence of IA is 2.3% worldwide (2). Usually, IAs can be divided in two subtypes: Unruptured IAs (UIA) and ruptured IAs (RIA). An estimated 50–80% of IAs will not rupture during a person's lifetime (3). As aneurysmal rupture is the main event leading to the occurrence of subarachnoid hemorrhage (4) and it often results in high disability or death rates (5), the management of UIAs for preventing RIAs is crucial (6). Genetic factors have a crucial role in regulating RIA pathogenesis (7); therefore, it is important to identify the genetic risk factors and elucidate the molecular mechanisms involved in IA.
Many genes, microRNAs (miRNAs) and transcription factors (TFs) have been associated with the progression of IA. Previous studies have revealed that the downregulation of elastin and lim domain kinase 1 may increase the risk of IA by weakening the altered arterial wall (8). In addition, the expression levels of colony stimulating factor 3 and AXL receptor tyrosine kinase are increased in patients with RIA (9). The upregulated ATP binding cassette subfamily A member 1, which is associated with intracellular lipid accumulation, may lead to IA by increasing the occurrence of inflammation in the IA wall (10). Additionally, the dysregulation of miRNA-9 is involved in IA by suppressing the proliferation and reducing the contractility of smooth muscle cells (11) and the upregulation of miRNA-92a, which negatively regulates the expression of kruppel-like factor 2 in a rabbit model, is also responsible for IA progression (12). The ETS proto-oncogene 1 TF promotes the development of IA via mediating the overexpression of monocyte chemoattractant protein-1 in IA walls (13). However, current research only partially explains the pathogenetic mechanisms of IA and further studies aimed at identifying IA-associated genes, miRNAs and TFs and elucidating their involvement in molecular mechanisms are required.
Nakaoka et al (14) have generated a gene expression profile of patients with IA and identified the differentially expressed genes (DEGs), revealing that the majority of DEGs are associated with inflammatory and immune responses. However, they did not use bioinformatics tools for an in-depth analysis of the miRNAs and TFs associated with IA. Therefore, the present study re-analyzed their expression data using a series of bioinformatics methods to identify crucial IA-associated genes, miRNAs and TFs that will allow the identification of the underlying mechanisms associated with IA.
Materials and methods
Affymetrix microarray data
The microarray dataset GSE54083, downloaded from the Gene Expression Omnibus (www.ncbi.nlm.nih.gov/geo), was analyzed using the GPL4133: Agilent-014850 Whole Human Genome Microarray 4×44K G4112F (Agilent Technologies, Inc., Santa Clara, CA, USA) platform. A total of 18 samples were present in this dataset, including 8 ruptured IA (RIA) and 10 superficial temporal artery (STA) samples. All 8 RIA samples were from females (age, 28–88 years) and the 10 STA samples included 8 females and 2 males (age, 34–61 years). All specimens were obtained through surgery at the Tokyo Metropolitan Fuchu Hospital (Tokyo, Japan), and all patients enrolled in the experiment provided written informed consent approved by the Ethics Committee of Tokyo Metropolitan Fuchu Hospital, Tokyo Women's University (Tokyo, Japan) (14).
Data preprocessing
Raw probe-level data was downloaded, and expression profile data preprocessing was performed using a robust multiarray average method based on the affy package (version 1.52.0; www.bioconductor.org/packages/release/bioc/html/affy.html) in R version 3.3.2 (15). Data preprocessing included background correction, filling in of missing data and quartile normalization.
Identification of DEGs and hierarchical clustering analysis
Following data preprocessing, DEGs between RIA and STA samples were analyzed using Bayes methods based using the limma package version 3.30.3 (www.bioconductor.org/packages/release/bioc/html/limma.html) in R (16), and raw P-values were revised using the Benjamini and Hochberg method (17). The cut-off criteria for defining DEGs were adjusted P<0.05 and |log2 fold change (FC)| >2. Clustering analysis was then conducted using the pheatmap package in R (cran.r-project.org/web/packages/pheatmap/index.html).
Functional and pathway enrichment analyses of DEGs
The Database for Annotation, Visualization and Integrated Discovery version 6.8 (DAVID; david-d.ncifcrf.gov) provides functional classification and annotation analyses of associated genes (18). In the present study, the DAVID database was used to perform Gene Ontology (GO) and Kyoto Encyclopedia of Genes and Genomes (KEGG) enrichment analyses of upregulated and downregulated DEGs. The significant GO terms and KEGG pathways enriched with upregulated and downregulated DEGs were selected with a criterion of P<0.05.
Protein-protein interaction (PPI) network construction
The Search Tool for the Retrieval of Interacting Genes version 9.1 (STRING; www.string-db.org) database can annotate all functional interactions among proteins by computational prediction methods (19), and the present study used STRING to predict the interactions among proteins encoded by DEGs. The PPI pairs with a combined score >0.4 were identified, and the interaction pairs were visualized by constructing a PPI network using Cytoscape version 3.0. Subsequently CytoNCA version 2.1.6 (apps.cytoscape.org/apps/cytonca), a Cytoscape plugin, was used for centrality analysis by examining the network topology (20), and the hub nodes were identified by a high score based on the scale-free property of the network.
Integrated network construction of TF-target-miRNA
Prior to integrated network construction, the TF and miRNA targets were identified. The miR2Disease database (www.mir2disease.org) was used to search for IA-associated miRNAs (21) and the miRNA target genes were predicted from MiRwalk2, MiRDB, RNA22, miRanda, RNAhybrid and TargetScan databases. A gene was categorized as a miRNA target when identified in at least 4 out of the aforementioned 6 databases. Genes shared between predicted miRNA targets and DEGs were selected for analyses to predict whether TFs were among DEGs and miRNA targets, which were performed based on ITFP (itfp.biosino.org/itfp) and TRANSFAC (www.gene-regulation.com/pub/databases.html) databases. Subsequently, TF targets that overlapped between the predicted TF target and TF DEGs were screened. Finally, the regulation relationships between the TF-target and miRNA-target were integrated, and the TF-target-miRNA network was constructed using Cytoscape (www.cytoscape.org).
Results
DEG screening and hierarchy cluster analysis
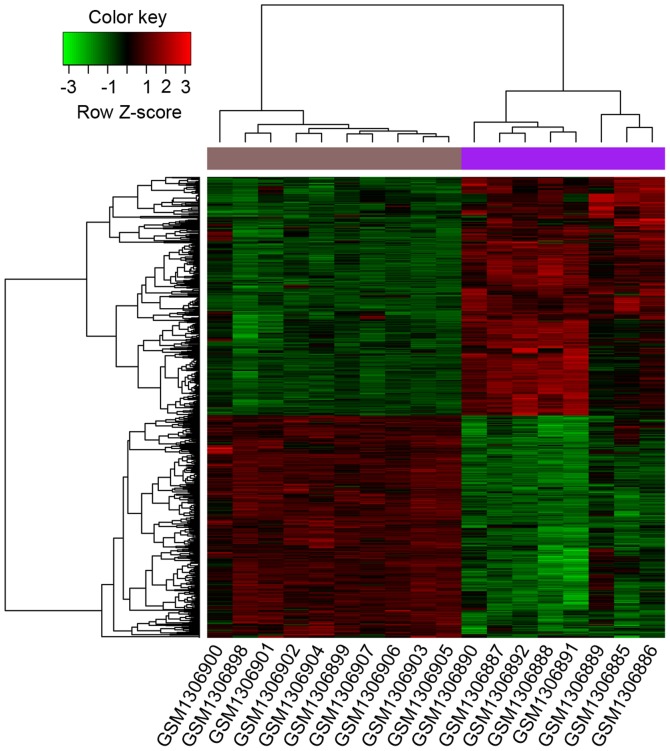
Based on the aforementioned criteria, a total of 777 DEGs were identified when the RIA samples were compared with the STA samples, including 402 that were upregulated and 375 that were downregulated. In addition, the hierarchy cluster analysis indicated that DEGs could correctly distinguish between RIA and STA samples based on significantly different expression patterns, confirming that the results were reliable and could be applied to subsequent analyses (Fig. 1).
Figure 1.
Hierarchical clustering map of DEGs. The horizontal axis shows the names of each sample and the right vertical axis shows the clusters of DEGs. The colored bars between the dendogram and heatmap indicate superficial temporal arteries samples in dark purple and RIA samples in light purple. Colors towards red represent high expression values and colors towards green represent low expression values. DEGs, differentially expressed genes; RIA, ruptured intracranial aneurysm.
Functional and pathway enrichment analyses of DEGs
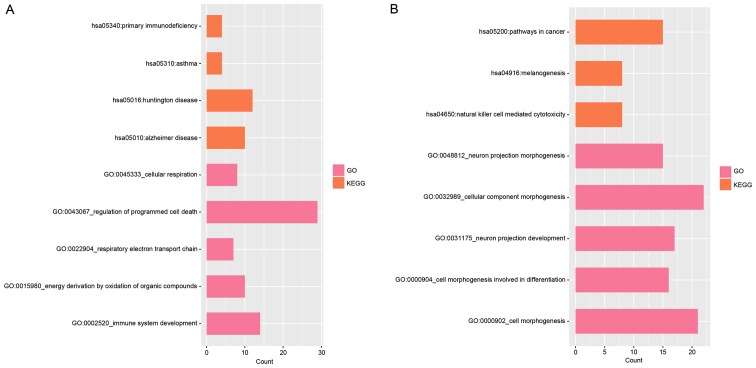
With a threshold of P<0.05, the upregulated DEGs were enriched in 37 GO terms and 4 KEGG pathways. The top 5 GO terms and 4 KEGG pathways are presented in Fig. 2A and mainly involved immune system development (GO terms, P=0.006), regulation of programmed cell death (GO terms, P=0.007) and primary immunodeficiency (KEGG, P=0.047) categories. The downregulated DEGs were closely associated with 135 GO terms and 3 KEGG pathways, which included natural killer cell-mediated cytotoxicity (KEGG, P=0.029) and neuron projection development (GO terms, P=1.828×10⁻⁵) (Fig. 2B).
Figure 2.
Function and pathway enrichment analysis. The functionally enriched GO terms and enriched pathways of (A) upregulated and (B) downregulated DEGs. GO, Gene Ontology; DEGs, differentially expressed genes.
PPI network analysis
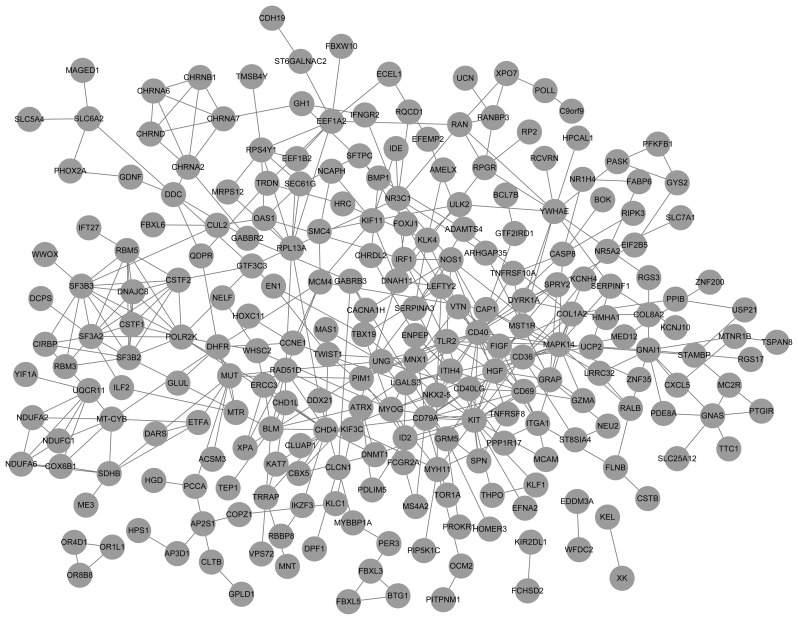
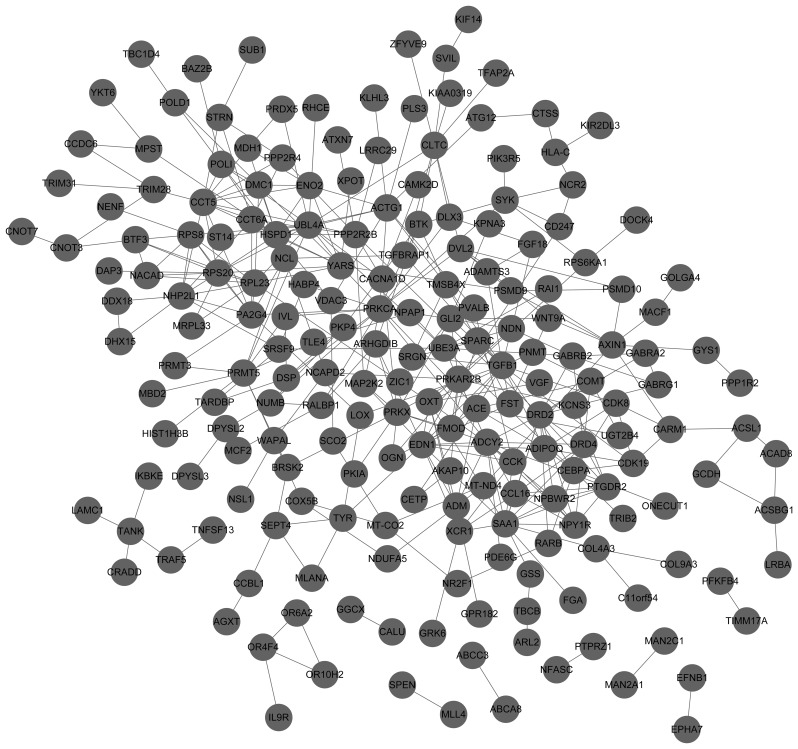
PPIs encoded by DEGs were identified using the STRING database and a subset of 239 upregulated DEGs with 440 interactions was included in the upregulated PPI network (Fig. 3). For the downregulated PPI network, there were 202 DEGs and 374 interactions (Fig. 4). In addition, the top 10 upregulated nodes, including CD40 and CD40LG and downregulated nodes, such as DRD2 and TGFB1 with a high degree score are presented in Table I.
Figure 3.
Protein-protein interaction network of upregulated differentially expressed genes. The nodes indicate the genes and the lines represent the corresponding interactions.
Figure 4.
Protein-protein interaction network of downregulated differentially expressed genes. The nodes indicate the genes and the lines represent the corresponding interactions.
Table I.
Top 10 upregulated and downregulated nodes of the protein-protein interaction network centrality analysis.
| A, Upregulated | |||
|---|---|---|---|
| Gene | Degree | Betweenness | Closeness |
| KIT | 20.0 | 4938.772 | 0.07957205 |
| MAPK14 | 17.0 | 9604.479 | 0.08109029 |
| CD40 | 17.0 | 6098.7065 | 0.08153477 |
| CD79A | 14.0 | 4231.3047 | 0.0800269 |
| CD36 | 13.0 | 4260.1753 | 0.07986577 |
| CHD4 | 12.0 | 5844.3154 | 0.07989258 |
| POLR2K | 11.0 | 3625.8403 | 0.0771725 |
| SF3A2 | 11.0 | 1057.66 | 0.07345679 |
| SF3B3 | 11.0 | 1219.1407 | 0.073615834 |
| CD40LG | 10.0 | 4938.772 | 0.07957205 |
| B, Downregulated | |||
| Gene | Degree | Betweenness | Closeness |
| TGFB1 | 16.0 | 3138.2646 | 0.03716029 |
| EDN1 | 14.0 | 3436.2148 | 0.037284363 |
| ADCY2 | 14.0 | 3696.108 | 0.037353653 |
| SAA1 | 14.0 | 2775.5098 | 0.036921382 |
| UBL4A | 14.0 | 4874.1514 | 0.03745807 |
| CCT5 | 13.0 | 2006.9825 | 0.03694853 |
| PRKCA | 13.0 | 5347.6064 | 0.037486013 |
| DRD2 | 13.0 | 1943.1166 | 0.036914602 |
| HSPD1 | 13.0 | 2716.8848 | 0.037249815 |
| RPS20 | 12.0 | 1213.8475 | 0.03707119 |
Integrated network analysis
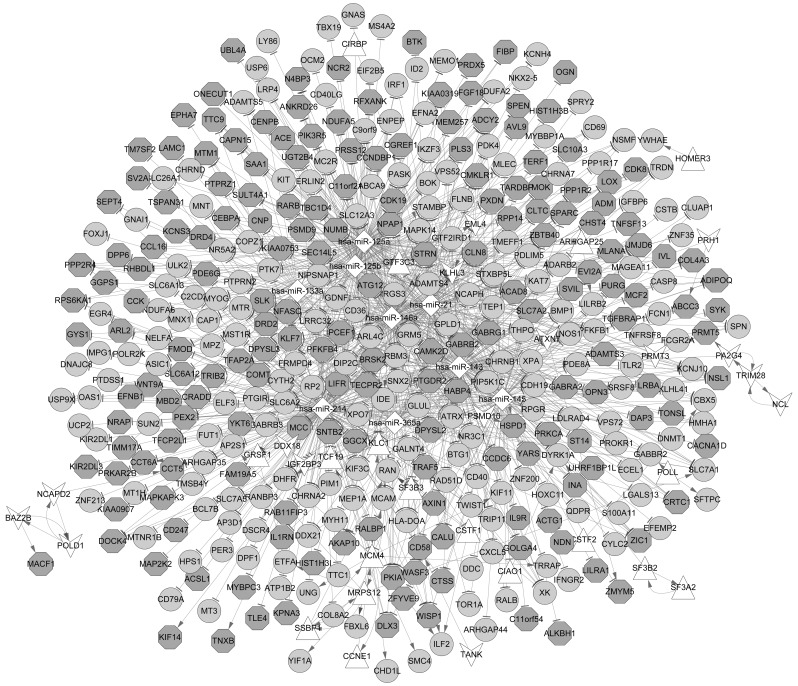
Based on the miR2Disease database, 12 IA-associated miRNAs were identified, and among these miRNAs, 9, including hsa-miR-125a, hsa-miR-125b, hsa-miR-145, hsa-miR-146a, hsa-miR-21 and hsa-miR-214 were confirmed to be regulators of the aforementioned DEGs. Additionally, a total of 18 upregulated DEGs, such as MCM4, MRPS12 and SF3B2 and 15 downregulated DEGs, including TRIM28 that had a regulatory function were categorized as TFs (Table II). Additionally, several DEGs with a high degree score, such as STRN and NOS1 are presented in Fig. 5.
Table II.
Upregulated genes and the downregulated genes that could also be taken as transcription factors.
| Upregulated | Downregulated |
|---|---|
| ARHGAP25, CCNE1, CIAO1, CIRBP, STF, CSTF2, GRSF1, GTF3C3, HOMER3, KLC1, MCM4, MRPS12, POLL, SF3A2, SF3B2, SF3B3, SSBP1, TCF19 | ATXN7, BAZ2B, DDX18, EML4I, GF2BP3, KLHL3, NCAPD2, NCL, PA2G4, POLD1, PRH1, PRMT3, PSMD10, TANK, TRIM28 |
Figure 5.
Integrative regulatory network of TF-target-miRNA. The circular nodes represent upregulated DEGs and the octagon nodes represent downregulated DEGs. The triangle-shaped nodes represent upregulated TFs, hexagon-shaped nodes represent downregulated TFs and diamond-shaped nodes represent miRNAs. DEGs, differentially expressed genes; TF, transcription factor; miRNA, microRNA.
Discussion
In the present study, 402 upregulated and 375 downregulated DEGs, were identified in the RIA samples. The majority of the DEGs were predicted to be associated with immune system development (e.g., CD40LG and CD40) and neuron projection development (e.g., STRN) functions and in terms of pathways, such as primary immunodeficiency (e.g., CD40LG) and natural killer cell-mediated cytotoxicity (e.g., MCM4). In addition, CD40 (adjusted P=0.00001) and NOS1 were hub genes in the constructed PPI networks. Additionally, DEGs, such as CD40LG (adjusted P=0.0023), NOS1 (adjusted P=0.00021), STRN (adjusted P=0.00011) and MYH11 (adjusted P=0.0011), the miRNA hsa-miR-125b and the TF MCM4 were highlighted in the TF-target-miRNA networks.
Inflammation has an important role in IA formation and rupture (22,23). Prior to IA rupture, inflammatory changes in the IA walls, such as T cells and macrophage infiltration and complement activation, are major events (24,25). Pyysalo et al (26) have reported that the etiology of the inflammatory alteration in patients with IA may be associated with odontogenic bacteria. Bacterial DNA was detected in 58% IA samples from the ruptured IA sac tissue, and the overexpression of toll-like receptor 2 (TLR2) has also been reported (26), suggesting that the inflammation was bacteria-driven. Similarly, the findings of the present study revealed that the expression of TLR2 (adjusted P=0.00002) was upregulated in IA samples. In addition, the present study revealed that the majority of the upregulated DEGs were enriched in the function of ‘immune system development’ (e.g., CD40LG and CD40) and the pathway of ‘primary immunodeficiency’ (e.g., CD40LG). The CD40 molecule (CD40) is expressed on macrophages, and matrix metalloproteinase-2 activation in the CD40LG pathway is crucial for abdominal aortic aneurysm (27). In addition, Ochs et al (28) have indicated that mutation of CD40LG may lead to primary immunodeficiency, and T-cell immunodeficiency may function as a key player in the formation of IA. Therefore, this suggested that CD40 and CD40LG contribute to the progression of IA by participating in immune system development and primary immunodeficiency. Additionally, striatin (STRN), a neuronal calmodulin-binding protein, was downregulated in neuronal dendrites and spines (29), and the present study found 17 downregulated DEGs (e.g., STRN) that were predicted to be enriched in neuron projection development. Therefore, the present study suggested that STRN may be associated with the development of IA via influencing the neuron projections development of IA cells.
Liu et al (30) have demonstrated that miR-125b, which is involved in modulating the cell proliferation of vascular smooth muscle cells, is closely associated with IA. The integrated network analysis revealed that nitric oxide synthase 1 (NOS1), a target gene of miR-125b, was predicted to be associated with IA. The overexpression of NOS1 (also termed neuronal NOS) may promote vascular nitric oxide (NO) release, and NO is responsible for macrophage-mediated vascular smooth muscle cell apoptosis (31,32). Therefore, the present study proposed that regulation of NOS1 by miR-125b may contribute to the progression of IA via modulating cell proliferation and apoptosis of vascular smooth muscle cells. Additionally, the mutation of minichromosome maintenance complex component 4 (MCM4) is involved in natural killer cell deficiency in humans (33), and the natural killer cell cytotoxicity pathway is closely associated with abdominal aortic aneurysms (34). In the present study, the MCM4 TF was shown to be at a high degree in the integrated network and was predicted to regulate the expression of MYH11. Additionally, mutation of myosin heavy chain 11 (MYH11) was inversely correlated with RIA (35), which suggested that the MCM4 TF regulates MYH11 for participating in the development of IA.
In conclusion, immune system development-associated DEGs, such as CD40LG and CD40, and regulation of cell proliferation and apoptosis of vascular smooth muscle cells by DEGs and miRNAs, such as NOS1 and miR-125b, as well as neuron projection development-associated DEGs, such as STRN, may contribute to the progression of IA. Additionally, these may provide potential therapeutic targets and act as diagnostic biomarkers for IA. However, further studies are required to verify these findings.
Acknowledgements
The present study was supported by Shanghai Municipal Commission of Health and Family Planning (grant no. 201440319) and Pudong New Area Municipal Commission of Health and Family Planning (grant no. PW2014A-15).
References
- 1.Chalouhi N, Hoh BL, Hasan D. Review of cerebral aneurysm formation, growth, and rupture. Stroke. 2013;44:3613–3622. doi: 10.1161/STROKEAHA.113.002390. [DOI] [PubMed] [Google Scholar]
- 2.Blignaut Gerrit, Loggenberg Eugene, Vries D, Coert The radiological appearance of intracranial aneurysms in adults infected with the human immunodeficiency virus (HIV) Orig Res Sa J Radiol. 2014;18:1–4. [Google Scholar]
- 3.Brown RD., Jr Management of cerebral aneurysms. Mayo Clinic Proceedings. 2004;79:288–302. doi: 10.4065/79.11.1471-e. [DOI] [PubMed] [Google Scholar]
- 4.Olafsson E, Hauser WA, Gudmundsson G. A population-based study of prognosis of ruptured cerebral aneurysm: Mortality and recurrence of subarachnoid hemorrhage. Neurology. 1997;48:1191–1195. doi: 10.1212/WNL.48.5.1191. [DOI] [PubMed] [Google Scholar]
- 5.Varble N, Meng H. Vortex imprints at the wall, but not in the bulk, distinguish ruptured from unruptured intracranial aneurysms. Presented at the DFD15 Meeting of The American Physical Society. 2015. http://meetings.aps.org/link/BAPS.2015.DFD.L23.8 http://meetings.aps.org/link/BAPS.2015.DFD.L23.8 (abstract L23.00008)
- 6.Lall RR, Eddleman CS, Bendok BR, Batjer HH. Unruptured intracranial aneurysms and the assessment of rupture risk based on anatomical and morphological factors: Sifting through the sands of data. Neurosurg Focus. 2009;26:E2. doi: 10.3171/2009.2.FOCUS0921. [DOI] [PubMed] [Google Scholar]
- 7.Mohan D, Munteanu V, Coman T, Ciurea AV. Genetic factors involves in intracranial aneurysms-actualities. J Med Life. 2015;8:336–341. [PMC free article] [PubMed] [Google Scholar]
- 8.Akagawa H, Tajima A, Sakamoto Y, Krischek B, Yoneyama T, Kasuya H, Onda H, Hori T, Kubota M, Machida T, et al. A haplotype spanning two genes, ELN and LIMK1, decreases their transcripts and confers susceptibility to intracranial aneurysms. Hum Mol Genet. 2006;15:1722–1734. doi: 10.1093/hmg/ddl096. [DOI] [PubMed] [Google Scholar]
- 9.Xu J, Ma F, Yan W, Qiao S, Xu S, Li Y, Luo J, Zhang J, Jin J. Identification of the soluble form of tyrosine kinase receptor Axl as a potential biomarker for intracranial aneurysm rupture. BMC Neurol. 2015;15:23. doi: 10.1186/s12883-015-0282-8. [DOI] [PMC free article] [PubMed] [Google Scholar]
- 10.Ollikainen E, Tulamo R, Lehti S, Lee-Rueckert M, Hernesniemi J, Niemelä M, Ylä-Herttuala S, Kovanen PT, Frösen J. Smooth muscle cell foam cell formation, apolipoproteins and ABCA1 in intracranial aneurysms: Implications for lipid accumulation as a promoter of aneurysm wall rupture. J Neuropathol Exp Neurol. 2016;75:689–699. doi: 10.1093/jnen/nlw041. [DOI] [PMC free article] [PubMed] [Google Scholar]
- 11.Luo J, Jin H, Jiang Y, Ge H, Wang J, Li Y. Aberrant Expression of microRNA-9 contributes to development of intracranial aneurysm by suppressing proliferation and reducing contractility of smooth muscle cells. Med Sci Monit. 2016;22:4247–4253. doi: 10.12659/MSM.897511. [DOI] [PMC free article] [PubMed] [Google Scholar]
- 12.Wu X, Zhang J, Huang Q, Yang P, Chen J, Liu J. MicroRNA-92a regulates expression of kruppel-like factor2 in rabbit model of intracranial aneurysm. Cell Mol Biol (Noisy-le-grand) 2015;61:44–48. [PubMed] [Google Scholar]
- 13.Aoki T, Kataoka H, Nishimura M, Ishibashi R, Morishita R, Miyamoto S. Ets-1 promotes the progression of cerebral aneurysm by inducing the expression of MCP-1 in vascular smooth muscle cells. Gene Ther. 2010;17:1117–1123. doi: 10.1038/gt.2010.60. [DOI] [PubMed] [Google Scholar]
- 14.Nakaoka H, Tajima A, Yoneyama T, Hosomichi K, Kasuya H, Mizutani T, Inoue I. Gene expression profiling reveals distinct molecular signatures associated with the rupture of intracranial aneurysm. Stroke. 2014;45:2239–2245. doi: 10.1161/STROKEAHA.114.005851. [DOI] [PubMed] [Google Scholar]
- 15.Irizarry RA, Hobbs B, Collin F, Beazer-Barclay YD, Antonellis KJ, Scherf U, Speed TP. Exploration, normalization, and summaries of high density oligonucleotide array probe level data. Biostatistics. 2003;4:249–264. doi: 10.1093/biostatistics/4.2.249. [DOI] [PubMed] [Google Scholar]
- 16.Li C, Wei Z, Li H. Network-based empirical bayes methods for linear models with applications to genomic data. J Biopharm Stat. 2010;20:209–222. doi: 10.1080/10543400903572712. [DOI] [PMC free article] [PubMed] [Google Scholar]
- 17.Benjamini Y, Hochberg Y. Controlling the false discovery rate: A practical and powerful approach to multiple testing. J R Statist Soc B. 1995;57:289–300. [Google Scholar]
- 18.da Huang W, Sherman BT, Lempicki RA. Systematic and integrative analysis of large gene lists using DAVID bioinformatics resources. Nat Protoc. 2009;4:44–57. doi: 10.1038/nprot.2008.211. [DOI] [PubMed] [Google Scholar]
- 19.Franceschini A, Szklarczyk D, Frankild S, Kuhn M, Simonovic M, Roth A, Lin J, Minguez P, Bork P, von Mering C, Jensen LJ. STRING v9.1: Protein-protein interaction networks, with increased coverage and integration. Nucleic Acids Res. 2013;41:D808–D815. doi: 10.1093/nar/gks1094. (Database issue) [DOI] [PMC free article] [PubMed] [Google Scholar]
- 20.Tang Y, Li M, Wang J, Pan Y, Wu FX. CytoNCA: A cytoscape plugin for centrality analysis and evaluation of protein interaction networks. Bio Systems. 2015;127:67–72. doi: 10.1016/j.biosystems.2014.11.005. [DOI] [PubMed] [Google Scholar]
- 21.Jiang Q, Wang Y, Hao Y, Juan L, Teng M, Zhang X, Li M, Wang G, Liu Y. miR2Disease: A manually curated database for microRNA deregulation in human disease. Nucleic Acids Res. 2009;37:D98–D104. doi: 10.1093/nar/gkn714. (Database issue) [DOI] [PMC free article] [PubMed] [Google Scholar]
- 22.Chalouhi N, Ali MS, Jabbour PM, Tjoumakaris SI, Gonzalez LF, Rosenwasser RH, Koch WJ, Dumont AS. Biology of intracranial aneurysms: Role of inflammation. J Cereb Blood Flow Metab. 2012;32:1659–1676. doi: 10.1038/jcbfm.2012.84. [DOI] [PMC free article] [PubMed] [Google Scholar]
- 23.Aoki T, Fukuda M, Narumiya S. Chronic inflammation in intracranial aneurysm formation. Inflamm Regen. 2013;33:283–287. doi: 10.2492/inflammregen.33.283. [DOI] [Google Scholar]
- 24.Tulamo R, Frösen J, Junnikkala S, Paetau A, Pitkäniemi J, Kangasniemi M, Niemelä M, Jääskeläinen J, Jokitalo E, Karatas A, et al. Complement activation associates with saccular cerebral artery aneurysm wall degeneration and rupture. Neurosurgery. 2006;59:1076–1077. doi: 10.1227/01.NEU.0000245598.84698.26. [DOI] [PubMed] [Google Scholar]
- 25.Kataoka K, Taneda M, Asai T, Kinoshita A, Ito M, Kuroda R. Structural fragility and inflammatory response of ruptured cerebral aneurysms. A comparative study between ruptured and unruptured cerebral aneurysms. Stroke. 1999;30:1396–1401. doi: 10.1161/01.STR.30.7.1396. [DOI] [PubMed] [Google Scholar]
- 26.Pyysalo MJ, Pyysalo LM, Pessi T, Karhunen PJ, Öhman JE. The connection between ruptured cerebral aneurysms and odontogenic bacteria. Öhman JE. 2013;84:1214–1218. doi: 10.1136/jnnp-2012-304635. [DOI] [PubMed] [Google Scholar]
- 27.Nagashima H, Aoka Y, Sakomura Y, Uto K, Sakuta A, Aomi S, Kurosawa H, Hagiwara N, Kawana M, Kasanuki H. Matrix metalloproteinase 2 is suppressed by trapidil, a CD40-CD40 ligand pathway inhibitor, in human abdominal aortic aneurysm wall. J Vasc Surg. 2004;39:447–453. doi: 10.1016/j.jvs.2003.07.005. [DOI] [PubMed] [Google Scholar]
- 28.Ochs HD, Hollenbaugh D, Aruffo A. The role of CD40L (gp39)/CD40 in T/B cell interaction and primary immunodeficiency. Semin Immunol. 1994;6:337–341. doi: 10.1006/smim.1994.1042. [DOI] [PubMed] [Google Scholar]
- 29.Bartoli M, Ternaux JP, Forni C, Portalier P, Salin P, Amalric M, Monneron A. Down-regulation of striatin, a neuronal calmodulin-binding protein, impairs rat locomotor activity. J Neurobiol. 1999;40:234–243. doi: 10.1002/(SICI)1097-4695(199908)40:2<234::AID-NEU9>3.0.CO;2-T. [DOI] [PubMed] [Google Scholar]
- 30.Liu D, Han L, Wu X, Yang X, Zhang Q, Jiang F. Genome-wide microRNA changes in human intracranial aneurysms. BMC Neurol. 2014;14:188. doi: 10.1186/s12883-014-0188-x. [DOI] [PMC free article] [PubMed] [Google Scholar]
- 31.Boyle JJ, Weissberg PL, Bennett MR. Human macrophage-induced vascular smooth muscle cell apoptosis requires NO enhancement of Fas/Fas-L interactions. Arterioscler Thromb Vasc Biol. 2002;22:1624–1630. doi: 10.1161/01.ATV.0000033517.48444.1A. [DOI] [PubMed] [Google Scholar]
- 32.Li J, Feng W, Chen L, He J. Downregulation of SMC1A inhibits growth and increases apoptosis and chemosensitivity of colorectal cancer cells. J Int Med Res. 2016;44:67–74. doi: 10.1177/0300060515600188. [DOI] [PMC free article] [PubMed] [Google Scholar]
- 33.Hughes CR, Guasti L, Meimaridou E, Chuang CH, Schimenti JC, King PJ, Costigan C, Clark AJ, Metherell LA. MCM4 mutation causes adrenal failure, short stature, and natural killer cell deficiency in humans. J Clin Invest. 2012;122:814–820. doi: 10.1172/JCI60224. [DOI] [PMC free article] [PubMed] [Google Scholar]
- 34.Hinterseher I, Schworer CM, Lillvis JH, Stahl E, Erdman R, Gatalica Z, Tromp G, Kuivaniemi H. Immunohistochemical analysis of the natural killer cell cytotoxicity pathway in human abdominal aortic aneurysms. Int J Mol Sci. 2015;16:11196–11212. doi: 10.3390/ijms160511196. [DOI] [PMC free article] [PubMed] [Google Scholar]
- 35.Ravindra VM, Karsy M, Schmidt RH, Taussky P, Park MS, Bollo RJ. Rapid de novo aneurysm formation after clipping of a ruptured middle cerebral artery aneurysm in an infant with an MYH11 mutation. J Neurosurg Pediatr. 2016;18:463–470. doi: 10.3171/2016.5.PEDS16115. [DOI] [PubMed] [Google Scholar]


