

Abstract
Adoptive T cell therapies have achieved significant clinical responses, especially in hematopoietic cancers. Two types of receptor systems have been used to redirect the activity of T cells, normal heterodimeric T-cell receptors (TCRs) or synthetic chimeric antigen receptors (CARs). TCRs recognize peptide-HLA complexes whereas CARs typically use an antibody-derived scFv (single-chain fragments variable) that recognizes cancer-associated cell-surface antigens. While both receptors mediate diverse effector functions, a quantitative comparison of the sensitivity and signaling capacity of TCRs and CARs has been limited due to their differences in affinities and ligands. Here we describe their direct comparison by using TCRs that could be formatted either as conventional αβ heterodimers, or as scFv constructs linked to CD3ζ and CD28 signaling domains or to CD3ζ only. Two high-affinity TCRs (KD values of approximately 50 and 250 nM) against MART1/HLA-A2 or WT1/HLA-A2 were used, allowing MART1 or WT1 peptide titrations to easily assess the impact of antigen density. Although CARs were expressed at higher surface levels than TCRs, they were 10 to 100-fold less sensitive, even in the absence of the CD8 co-receptor. Mathematical modeling demonstrated that lower CAR sensitivity could be attributed to less efficient signaling kinetics. Furthermore, reduced cytokine secretion observed at high antigen density for both TCRs and CARs suggested a role for negative regulators in both systems. Interestingly, at high antigen density, CARs also mediated greater maximal release of some cytokines, such as IL-2 and IL-6. These results have implications for next-generation design of receptors used in adoptive T cell therapies.
INTRODUCTION
Introduction of anti-cancer receptors, by gene transfer, into T cells has shown significant promise in the destruction of tumors (reviewed in (1)). T cell receptors (TCRs) and chimeric antigen receptors (CARs) have both been used in this approach, in order to target different classes of cell surface cancer antigens (e.g. (2–6)). TCRs provide the opportunity to target intracellular antigens that are processed and presented by an MHC-encoded protein (7). CARs recognize cancer-associated cell surface molecules using synthetic constructs that consist of a single-chain with antibody variable domains (scFvs) linked to a transmembrane region and intracellular signaling domains (8).
While TCR and CAR formats have some elements in common, the mechanistic details of signaling through CARs are less studied than TCRs (9, 10). The αβ TCR heterodimer assembles in a precisely controlled stoichiometry with the signaling machinery consisting of six CD3 subunits (CD3εγ, CD3εδ, CD3ζζ) (11). During pepMHC engagement by the TCR, the co-receptors CD4 or CD8 are brought into proximity with the TCR/CD3 complex. Efficient signaling of naïve T cells also requires the action of co-stimulatory molecules such as CD28. Each of these cell surface molecules has evolved to provide exquisitely sensitive signaling capabilities that allow different T cell types to generate polyfunctional activities. In contrast, CARs continue to be developed with properties that not only differ from conventional TCRs but that vary among themselves in terms of antigen, antigen density, scFv-affinity, scFv-specificity, and signaling domains (12). Variability in signaling components not only includes which domains are used but also the number and position of the signaling domains. First generation CARs contained only the CD3ζ signaling domains, which were shown to mediate activity but lacked T cell persistence (e.g. (13)). Second generation CARs, currently in use clinically, contain a co-stimulatory signal (typically either CD28 or 4-1BB) in tandem with the CD3ζ signaling domain (e.g. (8, 14)). Third-generation CARs have been developed that contain three domains and provide further diversity in which signaling pathways are incorporated into CAR activation of T cells (e.g. (15)). While most CARs contain scFv fragments as antigen-recognition domains, alternative receptor constructs such as designed ankyrin repeat proteins (DARPins) are in development (16).
While much has been learned about the sensitivity and mechanics of TCR-mediated signaling, direct comparison with the functional properties of CARs has been a challenge as there are multiple components that differ between TCRs and CARs. In principle, one could compare a CAR construct that binds to a pepMHC complex (reviewed in (17)) with a TCR that binds to the same pepMHC, but even these comparisons differ in receptor binding affinity and specificity. For example, recent efforts used an antibody called ESK1 that has high-affinity (KD= 0.2 nM) for the WT1/HLA-A2 complex (18). This antibody was tested for activity and toxicity in mice as a soluble Fc containing antibody, as a bi-specific molecule, and a CAR (19–21). However, recent crystallographic studies showed that the ESK1 antibody docked over the N-terminus of the WT1 peptide, with atomic interactions limited to the first four peptide residues, thus explaining why ESK1 cross-reacted with other human peptides that shared these residues such as the peptide PIGQ (22). Since the ESK1 antibody lacks specificity for WT1 peptide, it is unlikely to be applied in more sensitive therapeutic approaches, such as adoptive T cell therapies.
Even if a TCR-like antibody has the same specificity as a TCR, the direct comparison of TCR and CAR formats would be difficult, as they would no doubt differ substantially in affinity. Antibodies typically bind their ligands with dissociation constants (KD) in the nanomolar range, while TCRs typically bind pepMHC with KD values in the micromolar range (23). Recently a comparison of TCR and CAR sensitivities was done using a naturally occurring TCR and a scFv both of which bind, to WT1/HLA-A2 (24). Differences in functional activity and specificity were observed between the TCR and CAR but it remained to be determined whether these were attributable to differences in affinity, specificity (of the TCR versus the scFv), co-receptor involvement or expression levels of the two constructs. To more effectively compare the two receptors, we previously developed a CAR consisting of the α and β variable domains from a high-affinity murine TCR tethered to intracellular signaling domains typically used with CARs (25). This CAR construct had a decrease in sensitivity compared to its conventional TCR counterpart; however, it was still capable of directing the activity of CD8 and CD4 T cells against a B16-SIY tumor, in which the SIY peptide was upregulated.
To explore further the details of TCR and CAR-mediated T cell activity, we have developed human TCR systems against the two cancer antigens, WT1 and MART1. The WT1 antigen has been identified as a top target for cancer immunotherapies (26) and trials have been initiated to target this antigen (27), while the MART1 antigen is one of the most studied targets for adoptive T cell therapies (28, 29). Here we describe a comparison of TCRs to CARs using nanomolar affinity receptors for the WT1/HLA-A2 or MART1/HLA-A2 complexes. In both cases TCRs from T cell clones, isolated from a patient’s peripheral lymphocytes, were engineered in a single-chain TCR (Vβ-linker-Vα) format by yeast display to bind with high-affinity to WT1/HLA-A2 (described in this report) or MART1/HLA/A2 (30). This allowed the stabilized single-chain TCR molecules to be reconstituted as a conventional full-length TCR or as a CAR construct that contained T cell intracellular signaling domains as now used in clinical trials with CD19-directed CARs and other CARs (9).
Engineering of the two single-chain TCRs against MART1/HLA-A2 or WT1/HLA-A2 to affinities (KD values of approximately 50 and 250 nM) in the same range as many scFv fragments used in CARs allowed us to directly compare the activity mediated by a conventional TCR and a CAR, and to do so in the absence of the co-receptor CD8. CAR constructs exhibited 10 to 100-fold reductions in sensitivity to their respective pep/HLA-A2 complexes, as compared to the conventional TCR (αβ variable and constant domains). This lower sensitivity was despite higher surface expression of the CAR relative to the TCR. Reductions in sensitivity were observed with both first generation (CD3ζ signaling domain only) and second generation (CD28/CD3ζ signaling domains) CARs. These sensitivity values were observed even in the absence of the CD8 co-receptor, indicating that the TCR/CD3 machinery itself accounts for the differences (10, 12). Mathematical modeling suggested that the CAR result could be explained by either a 1000-fold reduction in the kinetic proofreading rate (kp) or by a 100-fold reduction in the activation rate (i.e. Kact, conversion of intracellular substrate to product), or by a combination of these mechanisms. Moreover, the CAR and TCR constructs appeared to differ in the maximal amount of some cytokines released at higher antigen densities. For example, the CAR construct stimulated both CD8 and CD4 T cells to secrete 1.5 to 2-fold higher levels of IL-6 than the TCR construct. Direct comparisons of normal TCR-mediated effects versus CAR-mediated effects, using the identical recognition machinery, should allow a greater understanding of next generation CAR formats, their sensitivities, and the influence of antigen-density on cancer cells (e.g. from different patients, or within the same patient) (8).
MATERIALS AND METHODS
Peptides, MHC and staining reagents
WT1 peptide (RMFPNAPYL) and the WT1 structurally similar peptide PIGQ (RMFPGEVAL) were synthesized by Genscript (Piscataway, NJ, USA). MART1 peptide (ELAGIGILTV) was synthesized by standard F-moc chemistry at the Macromolecular Core Facility at Penn State University College of Medicine (Hershey, PA, USA). T cells were stained with various concentrations of refolded HLA-A2-biotin and AAD-biotin. HLA-A2-biotin were refolded in complex with a UV-cleavable peptide, which was exchanged with the desired peptide in excess by exposure to UV light for >30 minutes (Rodenko et al., 2006). To generate HLA-A2 tetramer, HLA-A2-biotin monomer was incubated at a 4:1 ratio with SA-PE (BD Biosciences). Antibodies used to detect expression of TCRs on surface of T cells included: anti-TCR Vβ3.1 (Thermo Fisher), PE streptavidin (BD Pharmingen), Alex Fluor 647 F(ab′)2 fragment of goat anti-mouse IgG (H+L) (Life Technologies).
T cell transduction and activation
The D13.1.1 and T1 full-length TCR genes (human variable domains, murine constant domains containing engineered constant region cysteines, (31)) and D13.1.1-CAR and T1-CAR genes (human variable domains linked to murine CD28 and CD3ζ) and first generation D13.1.1-CAR (human variable domains linked to murine CD3ζ) were synthesized by GenScript. The D13.1.1 and T1 full-length genes were cloned into the pMP71 vector using NotI and EcoRI restriction sites (32). The D13.1.1-CAR and T1-CAR genes were cloned in the pMP71 vector using NotI and SalI restriction sites. Plat-E cells were plated at a concentration of 1 × 10⁶ cell/well (6 well plate) in DMEM media with added puromycin and blasticidin. After 24 h, approximately 30 μg of DNA was transfected into Plat-E cells and retroviral particles were harvested 48 h post-transfection. CD8 and CD4 T cells were harvested from AAD transgenic mice using CD4 and CD8 mouse untouched T cells dynabead kit (ThermoFisher). T cells were activated with anti-CD28 and anti-CD3 beads (ThermoFisher) and 30 U/mL of recombinant mouse IL-2 (Roche) for 24 h. 1 × 10⁶ T cells were then added to 1 mL of filtered (0.45 μm) retroviral supernatant with 50 μL of Lipofectamine 2000 (Life Technologies) per 6 mL of retroviral supernatant and an additional 30 U/ mL of recombinant IL-2. The cells were spinfected by spinning cells at 800 xg for 1 h in the presence of IL-2. Cells were then incubated at 37°C for 72 h. After 48 h, T cells were split 1:2 in IMDM.
For activation assays, 7.5 × 10⁴ T cells were incubated with 7.5 × 10⁴ T2 cells (HLA-A2+) and various concentrations of peptide in a final volume of 200 μL (96 well plate) for 24 h. 50 μL of supernatants were assayed for IFN-γ using Mouse IFN gamma ELISA Ready-SET-Go kit (eBioscience). To detect IL-2, IL-6, IL-10, MIP-1β and TNFα the Luminex Multiplex kit was used (Millipore) according to the manufacturer’s protocol. For IL-2 detection from transduced 58−/− cells, 2HB 96-flat bottom plates were coated with 50 μL of 2.5 mg/mL anti-murine IL-2 (BD Pharmingen) in 0.1M Na2HPO4 (pH=9) overnight at 4°C. 50 μL of supernatants were incubated in coated plates, followed by diluted (1:200) biotinylated anti-murine IL-2 (BD Pharmingen), followed by streptavidin-HRP (BD Pharmingen) diluted 1:10,000. Finally, TMB substrate (KPL) was added to well until a color change occurred. The reaction stopped by adding 1N H2SO4 and the absorbance was read at 450 nm.
Modeling and simulations
The following ordinary differential equations were used for the kinetic proofreading model:
where kon and koff are the TCR-pep-HLA kinetic rate constants, kp is the kinetic proofreading rate, Kact is the downstream activation rate, and γ is the background deactivation rate. The output of the model is P, which represents the active state of a downstream molecule (e.g. product of a reaction) with the total amount denoted as PT. We obtained the following steady-state solution to this system:
The model was modified to incorporate the incoherent feedforward loop with the following equations:
where φ is the background deactivation rate of Y, λ is the activation rate of P by Y and β is the inhibition rate of P by C1. This changes the steady-state solution to:
Active concentrations in the steady state equations are expressed as nondimensionalized fractions , and . Some calculations were generated using γ = 1, kon = 10−6, koff = 10−1, kp = 1, RT = 3*104, Kact = 1 or the indicated parameters. Calculations in Figure 5D used the following modified parameters: β = 1, φ = 1, kp = 10−2, Kact = 1.
Figure 5. Flow cytometry and activity analysis of D13.1.1 TCR, CAR-CD28/CD3ζ and CAR-CD3ζ constructs transduced in primary CD4 T cells.
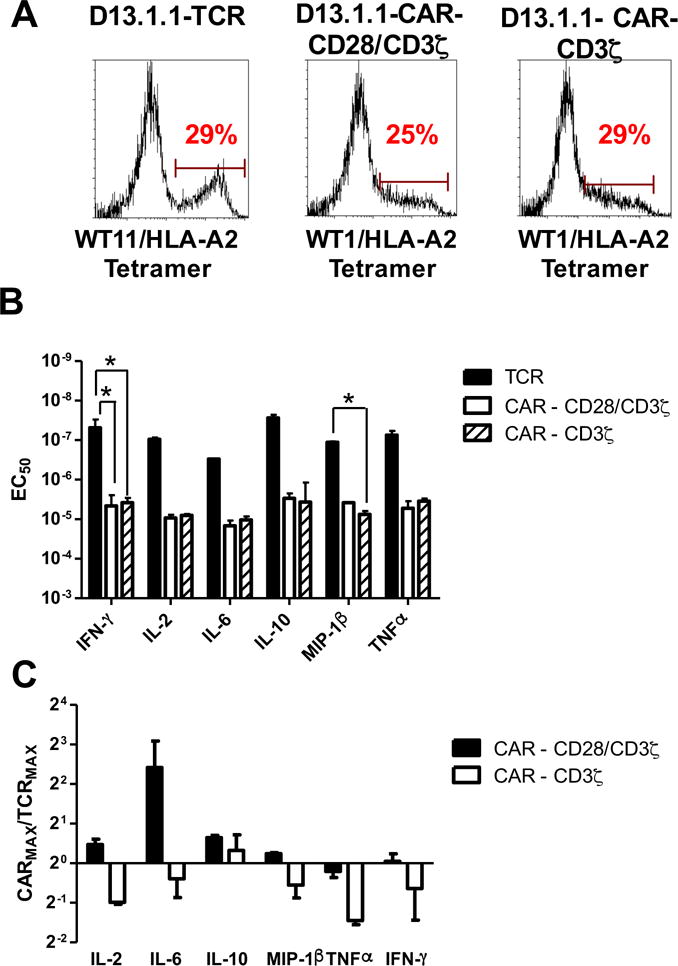
(A) CD4 T cells were isolated from AAD mice, activated in vitro with anti-CD3/CD28 beads, and transduced with D13.1.1 TCR, CAR-CD28/CD3ζ and CD3ζ CAR constructs. Transduced cells were stained with 50nM WT1/HLA-A2 tetramer (MFI and CV data shown in Fig. S2). (B, C) Transduced AAD CD4 T cells were incubated with T2 cells (HLA-A2+) at a 1:1 ratio and various concentrations of WT1 peptide. Supernatants were assayed for IL-2, IL-6, IL-10, MIP-1β, TNFα and IFN-γ concentrations using the Luminex Multiplex system (data shown in Fig. S2). (B) EC50 values from two separate experiments were calculated for each cytokine and plotted with the standard error represented with error bars. (C) The maximum concentration of each cytokine released for the CAR-CD28/CD3ζ and CD3ζ CAR were calculated relative to the respective maximum concentration for the TCR. The average ratios from two separate experiments are plotted with error bars representing the standard error (for TCR vs. CAR-CD28/CD3ζ ratios: p = 0.4 for IL-2 vs. IL-6, p = 0.9 for IL-2 vs. IL-10, p = 0.9 for IL-2 vs. MIP-1β, p = 0.9 for IL-2 vs. TNFα, p = 0.9 for IL-2 vs. IFN-γ, p = 0.4 for IL-6 vs. IL-10, p = 0.3 for IL-6 vs. MIP-1β, p = 0.3 for IL-6 vs. TNFα, p = 0.3 for IL-6 vs. IFN-γ,p = 0.9 for IL-10 vs. MIP-1β, p = 0.9 for IL-10 vs. TNFα, p = 0.9 for IL-10 vs. IFN-γ, p = 0.9 for MIP-1β vs. TNFα, p = 0.9 for MIP-1β vs. IFN-γ, p = 0.9 for TNFα vs. IFN-γ; for TCR vs. CAR- CD3ζ ratios: p = 0.9 for IL-2 vs. IL-6, p = 0.3 for IL-2 vs. IL-10, p = 0.9 for IL-2 vs. MIP-1β, p = 0.9 for IL-2 vs. TNFα, p = 0.9 for IL-2 vs. IFN-γ, p = 0.6 for IL-6 vs. IL-10, p = 0.9 for IL-6 vs. MIP-1β, p = 0.8 for IL-6 vs. TNFα, p = 0.9 for IL-6 vs. IFN-γ,p = 0.5 for IL-10 vs. MIP-1β, p = 0.2 for IL-10 vs. TNFα, p = 0.4 for IL-10 vs. IFN-γ, p = 0.9 for MIP-1β vs. TNFα, p = 0.9 for MIP-1β vs. IFN-γ, p = 0.9 for TNFα vs. IFN-γ). Note that the EC50 and maximum cytokine concentrations for the D13.1.1 TCR and CAR-CD28/CD3ζ in these experiments are also included in the averaged EC50 and maximum cytokine concentrations for these constructs in Fig. 4. * Indicates statistical significance (p < 0.05) determined using one-way ANOVA followed by Tukey’s test (maximum cytokine ratios) in Prism 6. P values generated from Tukey’s test are adjusted for multiple comparisons.
Statistics
Comparisons between various data outputs measured for TCRs and CARs were statistically analyzed using Prism6 graphing software, with either a student’s t-test (for single comparisons) or with a one-way analysis of variance and Tukey’s post test (for multiple comparisons). Significance was accepted at p < 0.05.
RESULTS
Engineering a high-affinity single-chain TCR for WT1/HLA-A2
To engineer a TCR that could operate independent of co-receptor and that could be used in a scFv-like format with affinity in the range of standard CARs, we used the yeast display system to improve the affinity of a TCR isolated from a CD8+ T cell clone raised against WT1/HLA-A2. The single-chain TCR consisted of the TCR Vβ domain linked to the Vα domain and fused to the AGA2 surface protein, with an N-terminal hemagglutinin tag (HA) and a C-terminal c-myc tag (Fig. 1A). Although HA and c-myc were detected on the surface of yeast, an anti-Vβ3 antibody did not detect the fusion protein (Fig. 1B), most likely because the V domains are not stable as a single-chain without select mutations (33, 34). To isolate a stabilized scFv form, a yeast display library of the hypermutated single-chain construct was generated by error-prone PCR, and the library was selected using fluorescence-activated cell sorting (FACS) for Vβ3 expression. A TCR clone, called D13, was isolated that expressed a positive population when stained with the anti-Vβ3 antibody (Fig. 1B).
Figure 1. Isolation of a high-affinity single-chain TCR against WT1/HLA-A2.
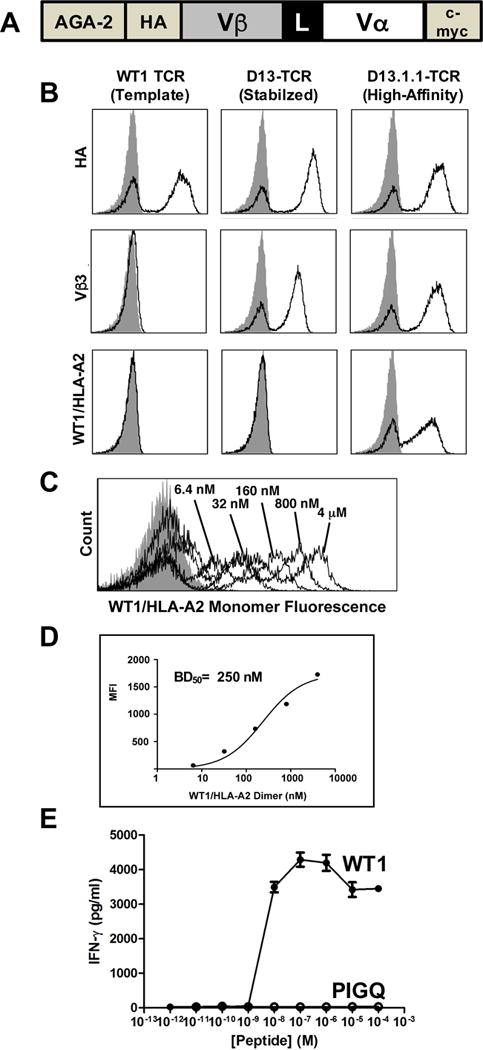
(A) Schematic of the single-chain TCR construct in the yeast display system. (B) The wild-type TCR (template) was engineered for improved stability and higher affinity on the surface of yeast as a single-chain TCR. Staining of the template (first column), a stabilized TCR called D13 (second column), and a high-affinity TCR called D13.1.1 (third column) is shown. The constructs are stained for expression with an antibody against the HA epitope (first row), anti-Vβ3 (second row), or WT1/HLA-A2-Ig dimer (third row). Staining of template (first column), a stabilized TCR called D13 (second column), and a high-affinity TCR called D13.1.1 (third column) is shown. Gray filled histogram represents secondary only controls. (C) The high-affinity D13.1.1-TCR displayed on yeast was stained with various concentrations of biotinylated WT1/HLA-A2 monomer, followed by streptavidin-PE secondary. (D) MFI values of histograms from (C) were plotted versus WT1/HLA-A2 monomer concentration. The calculated ED50 value is indicated. (E) CD8+ T cells from AAD mice were transduced with the D13.1.1 TCR, and cells were incubated with T2 cells (HLA-A2+) at a ratio of 1:1, in the presence of various concentrations of the WT1 peptide (RMFPNAPYL) or PIGQ peptide (RMFPGEVAL). Supernatants were assayed for IFN-γ by ELISA.
As expected, due to the well-known low affinity of TCRs for cancer pepMHC antigens (35), binding to WT1/HLA-A2 dimers by this TCR was not detected (Fig. 1B). The anti-Vβ3-stabilized TCR was subsequently engineered for enhanced affinity by generating a library in the CDR1α domain, which was sorted for binding to WT1/HLA-A2. A clone with weak but positive reactivity (D13.1) was subsequently used as a template for CDR3β libraries, followed by further rounds of FACS for binding to WT1/HLA-A2. TCR clone D13.1.1 showed a significant increase in binding to WT1/HLA-A2 dimers (Fig. 1B). Based on titrations with soluble WT1/HLA-A2 monomers, we estimated the D13.1.1 TCR exhibited a disassociation constant (KD) of approximately 250 nM (Fig. 1C,D).
Given that the antibody that binds to WT1/HLA-A2, called ESK1, also bound to peptides that shared the same N-terminal residues as the WT1 peptide (22), the PIGQ (RMFPGEVAL) peptide was tested for activity against the D13.1.1 TCR. Tetramers of the PIGQ peptide/HLA-A2 did not bind to the D13.1.1 TCR (data not shown), nor did the PIGQ peptide stimulate CD8 T cells that expressed the D13.1.1 TCR (Fig. 1E). Furthermore, the CD8+ T cells did not exhibit high basal levels of activity as would be observed with self-peptide reactivity observed with some higher affinity TCRs (36, 37).
Binding and activity of TCRs and CARs expressed in a T cell hybridoma
In addition to the single-chain TCR against WT1/HLA-A2, we recently described the engineering of an analogous TCR called T1 against MART1/HLA-A2 with a KD value of approximately 50 nM for the MART1 10-mer, ELAGIGILTV (30). These two TCR systems provided independent reagents to compare TCR and CAR formats. The Vα and Vβ domains were each formatted in two constructs, a TCR that contained the full-length human V regions linked to mouse C regions, and a CAR in which the Vα and Vβ variable domains were linked to a CD8 hinge, a CD28 transmembrane region, and the CD28 and CD3ζ intracellular signaling domains (Fig 2A).
Figure 2. Activity of D13.1.1 and T1 TCR and CAR constructs in 58−/− cells.
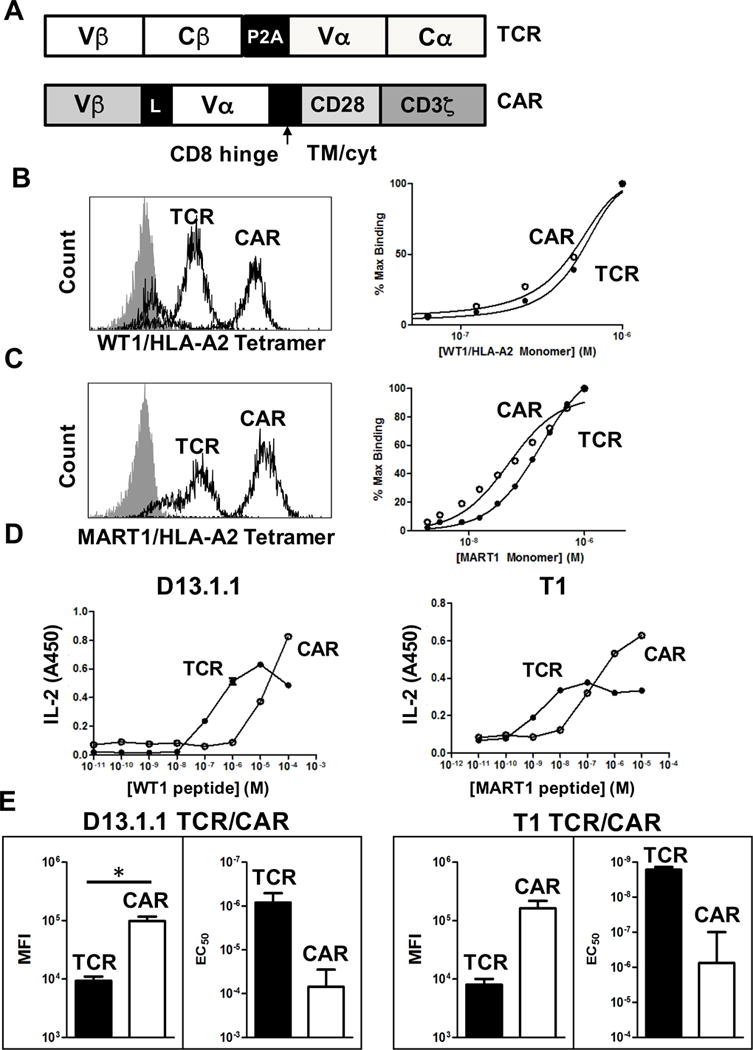
(A) Schematic of the TCR and CAR constructs used for the D13.1.1 and T1 TCRs. (B) 58−/− cells transduced with the D13.1.1 TCR or CAR were stained with 50 nM WT1/HLA-A2 tetramer. Cells were also titrated with different concentrations of WT1/HLA-A2 monomer and mean fluorescence intensity (MFI) values for each concentration were used to calculate percent bound, using the MFI from the highest concentration of monomer as 100%. (C) Same as in (B) except the T1 TCR against MART1/HLA-2 was used. (D) Transduced cells with the D13.1.1 or T1 TCRs were incubated with T2 cells (HLA-A2+) at a 1:1 ratio and various concentrations of WT1 or MART1 peptides, respectively. Supernatants were then assayed for IL-2 concentrations by ELISA (n=2). (E) The average log of mean fluorescence intensity (MFI) from two separate staining experiments is shown and the standard error of the average is represented with error bars (p = 0.04 for D13.1.1 TCR vs. CAR MFI values, p = 0.09 for T1 TCR vs. CAR MFI values). Additionally, the EC50 values from two separate IL-2 activation experiments was plotted and the standard error is shown with error bars (p = 0.09 for D13.1.1 TCR vs. CAR EC50 values, p = 0.1 for T1 TCR vs. CAR EC50 values). * Indicates statistical significance (p < 0.05) determined using student’s t test in Prism 6.
The TCR and CAR constructs were transduced into the murine 58−/− T cell hybridoma cell line (co-receptor and TCR αβ-negative) and positive populations of cells were selected by FACS for binding to their respective pep-HLA-A2 (Fig 2B,C). Transductions of the 58−/− cell line allowed us to compare receptor levels and pep-HLA-A2 sensitivity independent of the influence of co-receptor or endogenous α and β TCRs. Staining with a saturating concentration of pep-HLA-A2 tetramer showed that in both cases the CAR was expressed at approximately 10-fold higher surface levels than the conventional TCR (Fig 2B,C, left panels). These differences in the levels of TCRs versus CARs were also verified by staining with the anti-Vβ antibodies for each TCR (data not shown).
To determine if the TCR and CAR constructs bound with similar affinities, the T cells with transduced TCRs and CARs were titrated with their respective pep-HLA-A2 monomers (biotinylated), washed and stained with SA-PE (Fig. 2B,C, right panels). Because of the differences in total cell surface levels of TCRs and CARs, the binding was adjusted for maximum levels at the highest pep-HLA-A2 monomer concentration. The binding curves for the TCR and CAR in both systems were similar, with 50% maximal binding concentrations (estimated KD values) within two-fold.
To assess peptide-specific stimulatory capacity, T cell hybridoma lines expressing the TCR and CAR constructs were incubated with T2 cells (HLA-A2+) and exogenously added peptides, and secreted IL-2 was measured (Fig 2D). For both D13.1.1 and T1, the full-length TCR was approximately 10-fold more sensitive to pepMHC than their respective CAR constructs, despite the CAR expression at significantly higher surface levels. The reciprocal relationship between surface levels and sensitivity can be seen for both the WT1 and MART1 systems (Fig 2E).
Activity of CARs and TCRs in primary CD4 and CD8 T cells
To determine if the expression level and sensitivity differences between CARs and TCRs were observed in primary cells, CD8 and CD4 T cells from AAD mice (HLA-A2α1/α2 with Dbα3) were transduced with D13.1.1 TCR and CAR constructs. Transduced cells were stained with WT1/HLA-A2 tetramer and anti-Vβ3 antibody (Fig 3A). The CAR construct was expressed at similar surface levels in CD8 and CD4 T cells compared to the conventional TCR (Fig. 3B). The expression levels of the TCR consistently seemed more homogenous among the population, compared to CARs that exhibited a broader peak. The heterogeneity of surface levels of receptors expressed among individual T cells can be quantified by determining the coefficient of variation (CV) value, which is a measure of the broadness of stained population (i.e. peak). When stained with WT1/HLA-A2 tetramer, the D13.1.1 TCR peak had CV values of 65 and 76 in CD8 and CD4 T cell respectively, whereas the D13.1.1 CAR peak had CV values of 84 and 117 in CD8 and CD4 T cells, respectively (Fig. 3B). The higher CV value is indicative of greater variation between cells in their individual expression of the CAR receptor. Higher variation of CAR surface levels compared to full-length TCR levels was also observed using the T1 system in CD4 T cells (Supp. Fig. 1A,B)
Figure 3. Flow cytometry and binding analysis of D13.1.1 TCR and CAR constructs transduced in primary CD8 and CD4 T cells.
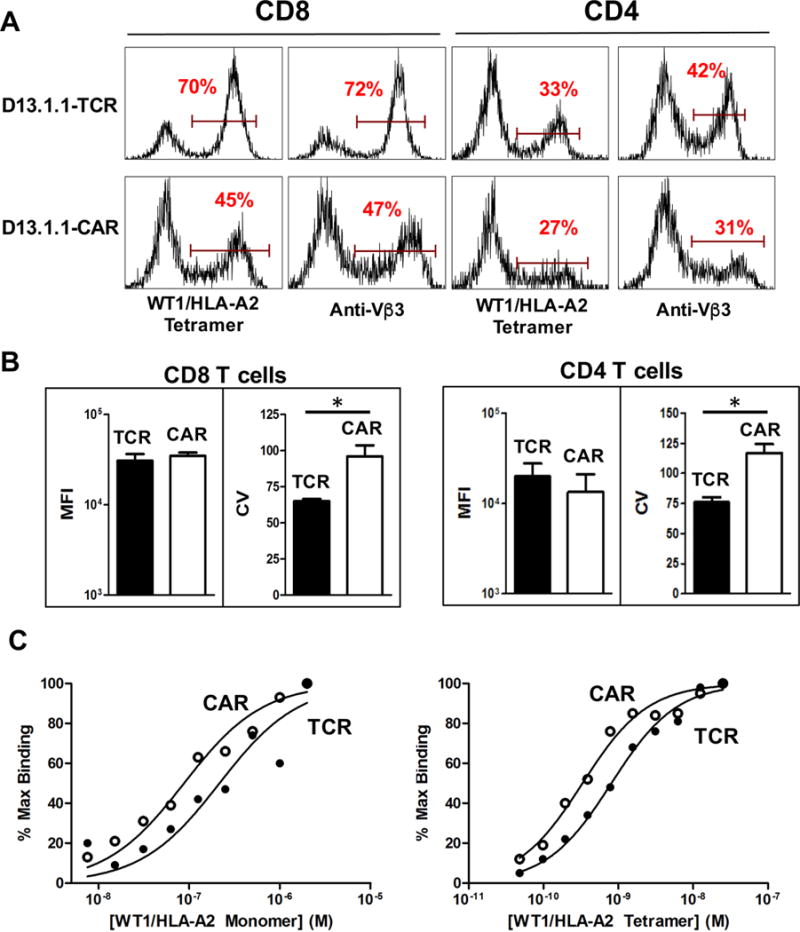
(A) CD8 and CD4 T cells were isolated from AAD mice, activated in vitro with anti-CD3/CD28 beads, and transduced with D13.1.1 TCR and CAR constructs. Transduced cells were stained with 50 nM WT1/HLA-A2 tetramer and anti-Vβ3 antibody. Viable cells were gated based on a FSC vs. SSC plot. (B) The median fluorescence intensity (MFI) and coefficient of variation (CV) values were calculated for the TCR and CAR constructs in CD8 and CD4 transduced cells (CD8 n=2, p=0.6 (MFI), 0.01 (CV), CD4 n=4, p= 0.2 (MFI), 0.003 (CV)). (C) Transduced CD4 cells were titrated with WT1/HLA-A2 monomer (left) and tetramer (right). Percent maximum binding (100% set at highest concentration stained) was plotted against concentration of monomer and tetramer respectively. * Indicates statistical significance (p < 0.05) determined using student’s t test in Prism 6.
To measure the binding of the TCR and CAR receptors, transduced CD4 and CD8 T cells were titrated with WT1/HLA-A2 monomer and tetramer (Fig. 3C). Binding curves were similar, but shifted approximately two-fold for the CAR (i.e. two-fold higher affinity or avidity for the CAR). Thus, if anything, the CAR had a slightly greater affinity for the WT1/HLA-A2 antigen.
The sensitivity of the CAR and TCR constructs was tested by incubating transduced CD4 and CD8 T cells with T2 cells and various concentrations of WT1 peptide. Supernatants were analyzed for IFN-γ by ELISA, and for a panel of cytokines using the Luminex Multiplex system (CD8 T cells, Fig. 4A; CD4 T cells, Fig. 4B). As with 58−/− cells, cells expressing the conventional TCR were nearly 100-fold more sensitive to WT1/HLA-A2 than cells expressing the CAR construct, for each of the cytokines examined (Fig. 4C,D). It was also notable that for those cytokines where sensitivity was sufficiently high to reveal full concentration curves, the highest concentrations of peptide antigen yielded reduced cytokine levels. Similar peptide-titration curves have been seen in many studies with TCR-mediated activities, and it has been predicted that high-antigen inhibition is due to a state of negative regulation by Src homology 2 domain phosphatase-1 (SHP-1) (38, 39). As such, our results suggest that both TCRs and CARs exhibit the potential for negative regulation at high antigen density.
Figure 4. Binding and activity of D13.1.1 TCR and CAR constructs in primary CD8 and CD4 T cells.
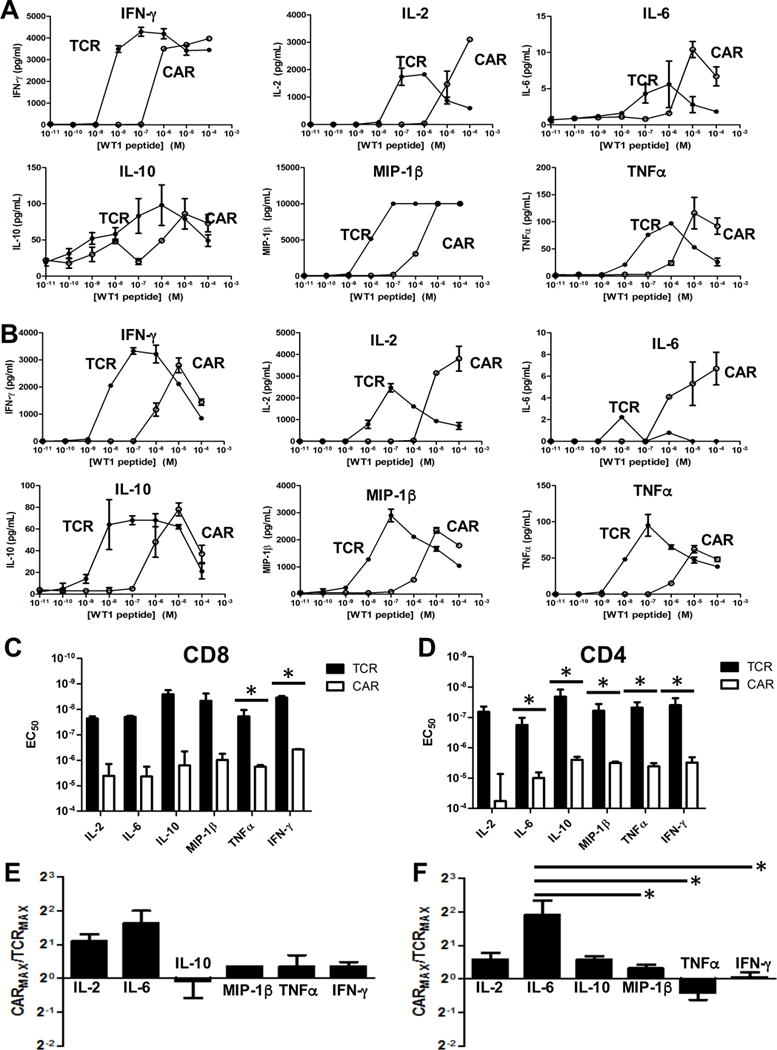
(A,B) Transduced AAD CD8 (A) and CD4 (B) T cells were incubated with T2 cells (HLA-A2+) at a 1:1 ratio and various concentrations of WT1 peptide. Supernatants were assayed for IFN-γ concentrations by ELISA. IL-2, IL-6, IL-10, MIP-1β and TNFα concentrations were calculated using the Luminex Multiplex system. (C,D) EC50 values from three separate experiments with CD8 (p = 0.2 (IL-2), p = 0.3 (IL-6), p = 0.2 (IL-10), p = 0.08 (MIP-1β), p = 0.002 (TNFα), p < 0.0001 (IFN-γ)) (C) and five separate experiments with CD4 (p = 0.3 (IL-2), p = 0.04 (IL-6), p = 0.001 (IL-10), p < 0.0001 (MIP-1β), p = 0.002 (TNFα), p = 0.02 (IFN-γ)) (D) T cells were calculated for each cytokine and plotted with the standard error represented with error bars. (E,F) The maximum concentration of each cytokine released for the CAR was calculated relative to the respective maximum concentration for the TCR. Values were adjusted to account for differences in transduction efficiency between TCR and CAR. The average ratios from three separate experiments with CD8 T cells (p = 0.5 for IL-2 vs. IL-6, p = 0.9 for IL-2 vs. IL-10, p = 0.9 for IL-2 vs. TNFα, p = 0.7 for IL-2 vs. IFN-γ, p = 0.05 for IL-6 vs. IL-10, p = 0.1 for IL-6 vs. TNFα, p = 0.1 for IL-6 vs. IFN-γ, p = 0.9 for IL-10 vs. TNFα, p = 0.9 for IL-10 vs. IFN-γ, p = 0.9 for TNFα vs. IFN-γ) For MIP-1β, n=1 due to saturation at high ligand concentrations. (E) and five separate experiments with CD4 T cells (p = 0.07 for IL-2 vs. IL-6, p = 0.9 for IL-2 vs. IL-10, p = 0.9 for IL-2 vs. MIP-1β, p = 0.9 for IL-2 vs. TNFα, p = 0.9 for IL-2 vs. IFN-γ, p = 0.07 for IL-6 vs. IL-10, p = 0.03 for IL-6 vs. MIP-1β, p = 0.007 for IL-6 vs. TNFα, p = 0.02 for IL-6 vs. IFN-γ,p = 0.9 for IL-10 vs. MIP-1β, p = 0.9 for IL-10 vs. TNFα, p = 0.9 for IL-10 vs. IFN-γ, p = 0.9 for MIP-1β vs. TNFα, p = 0.9 for MIP-1β vs. IFN-γ, p = 0.9 for TNFα vs. IFN-γ) (F) are plotted with error bars representing the standard error. * Indicates statistical significance (p < 0.05) determined using student’s t test (EC50) or one-way ANOVA followed by Tukey’s test (maximum cytokine ratios) in Prism 6. P values generated from Tukey’s test are adjusted for multiple comparisons.
To test whether CAR activation leads to the same cytokine milieu as T cell activation by a normal TCR, we compared not only the EC50 values, but the maximum amount of cytokine released by T cells expressing the CAR and TCR constructs (Fig. 4 E,F). In this approach, maximal cytokine values were adjusted to account for differences in transduction efficiency between the TCR and CAR, and the different cytokines serve as internal controls for differences in transduction efficiencies. The CAR secreted approximately 2-fold more IL-6 and 1.5-fold more IL-2 at higher ligand concentrations in both CD8 and CD4 T cells, than the TCR. Similar trends were observed in the T1 system in CD4 T cells, with higher concentrations of IL-2 and IL-6 secreted using the CAR compared to the TCR (Supp. Fig. 1E).
It is possible that the decreased sensitivity of the CAR relative to the TCR could be due in part to the distance of the CD3ζ domain from the transmembrane region, in the second generation CAR (CD28 followed by CD3ζ). To examine this, we generated a first generation CAR for D13.1.1, which lacks the intracellular CD28 domain and contains only a membrane-proximal CD3ζ domain (D13.1.1 CD3ζ CAR). We transduced CD4 cells with the D13.1.1 TCR, CAR (CD28/CD3ζ) and CD3ζ CAR. Transduced cells were stained with WT1/HLA-A2 tetramer (Fig. 5A) and stimulated with WT1 peptide in the presence of T2 cells, and supernatants were analyzed for a panel of cytokines using the Luminex multiplex system as described above. We compared the EC50 values (Fig. 5B) and maximum cytokine release values (Fig. 5C) between the D13.1.1 TCR, CAR and CD3ζ CAR (dose response curves for each cytokine are shown in Fig. S2B). The sensitivity of the two CARs was similar for each cytokine, indicating that the decreased sensitivity of the second-generation D13.1.1 CAR relative to the TCR is not due to the inclusion of the intracellular CD28 domain in the CAR construct. We compared the maximal cytokine secretion values between the D13.1.1 TCR and CAR and between the D13.1.1 TCR and CD3ζ CAR (Fig. 5C) and found no statistically significant differences between the two sets of ratios, although the increased IL-6 secretion stimulated by the D13.1.1 CAR relative to the TCR was not recapitulated by the CD3ζ CAR.
Mathematical modeling of CAR and TCR sensitivity
In order to understand these findings from a mechanistic perspective, we formulated a mathematical model based on previous approaches examining TCR-mediated signaling (40–43). The model (Fig. 6A) involves the receptor (R) in binding equilibrium with the ligand (L), with kinetic constants (kon and koff) that are presumed to be identical in the TCR and CAR systems here. The receptor-ligand complex (R:L) is denoted as C0 and C1 when unphosphorylated and phosphorylated, respectively. The rate of receptor phosphorylation is given by kp, which is also called the kinetic proofreading rate. The downstream activation rate (Kact) represents the ability of the activated receptors to activate downstream signaling by formation of the product, P (e.g. its ability to induce phosphorylation of LAT).
Figure 6. Model of ligand binding and signaling by TCR and CAR constructs.
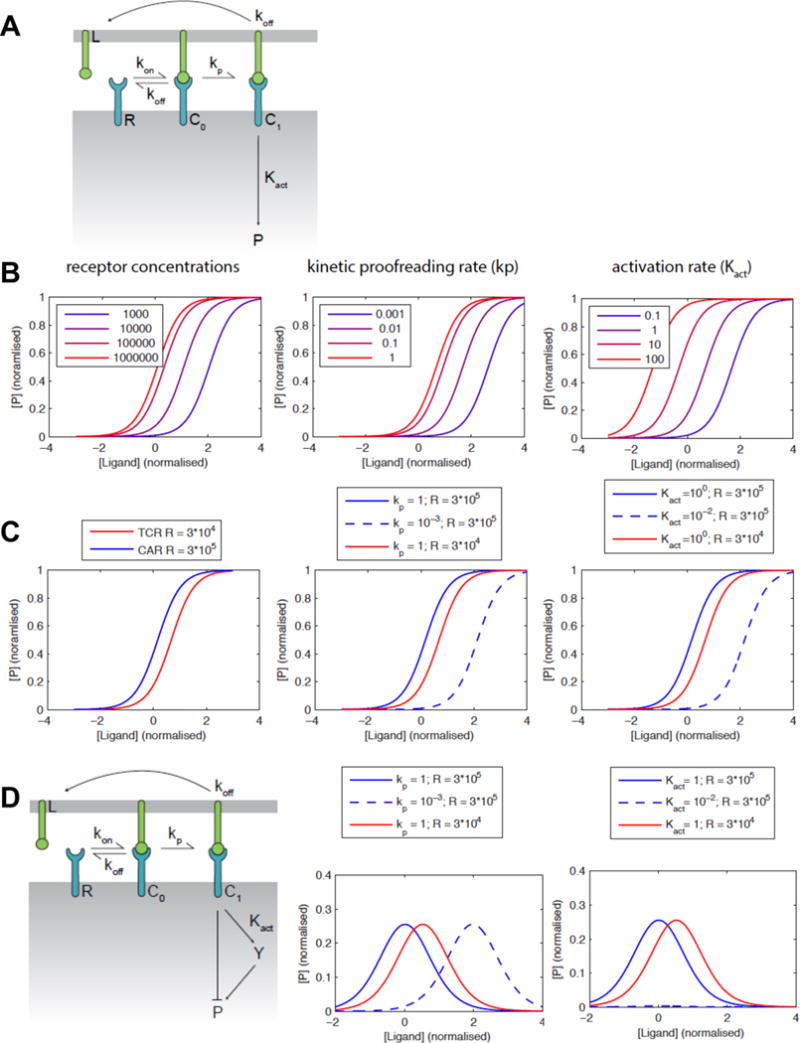
(A) Schematic of the mathematical model. The receptor (R) binds to its ligand (L) with the indicated rate constants to form a complex (C0) that can be phosphorylated with the kinetic proofreading rate (kp) to form a phosphorylated active receptor (C1). The downstream activation rate (Kact) represents the ability of the activated receptor to activate downstream signaling by formation of active product, P (e.g. its ability to induce phosphorylation of LAT). (B) Calculations showing the effect of variation of receptor expression level, kp and Kact on the sensitivity of the cells to antigen. (C) Calculated dose-response curves for a ten-fold higher CAR expression compared to TCR (left) showing that both lower kp (center) or Kact (right) can explain the lower sensitivity of the CAR. (D) An extended model that includes an incoherent feedforward loop can explain the observed bell-shaped dose-response curves. Calculations show that a lower values of kp (center) can explain the lower sensitivity of the CAR in this model, while the response is completely lost with a lower Kact (right).
It is possible to simulate the effect of differing receptor concentrations (all other parameters being equal) on the downstream signaling components (P). According to this analysis (Fig. 6B, left), in the 58−/− system where the CAR was expressed at about 10-fold higher surface levels, the CAR-expressing cells would be expected to have significantly greater sensitivity than the TCR-expressing cells if proximal and downstream phosphorylation events were similar. It follows that either the kinetic proofreading rate kp or the activation rate Kact of the CAR must be reduced in order to account for reduced sensitivity of the CAR (Fig. 6B center and right, respectively). If we fix the receptor concentrations at 30,000 molecules per cell for the TCR (44) and 300,000 for the CAR, kp or Kact needs to be reduced by 100-fold (Fig. 6C) in order to decrease CAR potency by 100-fold (as observed experimentally). In primary cells, where both receptors were expressed at similar levels, the values of kp and Kact would also need to be reduced but by a lower amount to account for the observed differences in sensitivity, since higher expression of the CAR does not need to be overcome.
We also noted that peptide titrations, representing increasing antigen densities, often yielded bell-shaped curves as observed in studies with TCRs (42) and CARs (45). The bell-shaped curves were in general seen with both TCRs and CARs, as long as the later were able to be titrated at sufficiently high peptide concentrations beyond the peak cytokine levels. We have recently developed a pathway model for cellular signaling that is able to explain this effect based on a large TCR dataset, which appears to be applicable to the CAR format. The model couples an incoherent feed forward loop to kinetic proofreading in order to explain bell-shaped dose-response curves (Fig 6D, left). In this model architecture, we find that reduced sensitivity by the CAR may involve a reduction in the kinetic proofreading rate (kp) rather than the activation rate (Kact) (Fig. 6D, center and right, respectively).
Discussion
To effectively compare TCR and CAR sensitivities, we used the yeast display platform to engineer a high-affinity TCR that bound to WT1/HLA-A2 with nanomolar affinity. Recent antibody engineering efforts isolated a TCR-like antibody specific for the WT1/HLA-A2 complex which bound with low nanomolar affinity (15–16). It was observed that in addition to binding to WT1/HLA-A2 this antibody also bound to a HLA-A2 complex containing the PIGQ peptide, which shared similar residues to the WT1 peptide in the N-terminus. The high-affinity D13.1.1 TCR did not show binding or activity against the PIGQ/HLA-A2 complex when transduced into CD8 T cells. Based on this result, and the lack of stimulation of CD8 T cells by self-peptide-HLA-A2 complexes, we believe that the high-affinity D13.1.1 TCR provides a more specific reagent than the ESK1 antibody. We have evidence that the greater specificity of the D13.1.1 TCR is likely due to the distributive interactions of its CDR loops with the WT1 peptide, as opposed to the ESK1 antibody that docks only over the N-terminus of the WT1 peptide.
To compare sensitivity of TCRs to CARs, two high-affinity TCRs, one for WT1/HLA-A2 and another MART1/HLA-A2, were formatted as full-length TCRs (variable α and β domains followed by constant domains) as well as CAR constructs (single-chain TCR variable domains tethered to intracellular CD28 and CD3ζ signaling domains). The TCR/CAR systems described here allow quantitative comparisons of signaling outcomes and sensitivities, because the recognition and binding properties of the receptors are identical. In the murine 58−/− T cell hybridoma cell line, the lower expression of the TCR, compared to the CAR, may be due to the stoichiometric levels of CD3 subunits which are limiting and thus control surface levels of the entire TCR/CD3 complex (46). CAR expression is not known to be dependent on co-expression of CD3 subunits and thus total cell surface levels may be controlled by transcriptional or other mechanisms.
In primary CD4 and CD8 T cells, the expression of conventional TCRs was more consistent between individual cells whereas CARs were expressed at a broader range of receptor levels. More homogenous expression for the TCR could be due to dependence on CD3 subunit expression levels and assembly. Since CARs do not require CD3 co-expression, their expression levels are likely more dependent on the site of vector integration. Methods to generate site-directed integrations of CAR constructs will likely lead to a more consistent surface level expression of CARs (14, 47). Techniques that are not dependent on genome integration, such as RNA electroporation, may also yield more consistent expression levels of CARs. It is not yet clear if T cells expressing higher or lower levels of CARs will be optimal for driving T cell activation, but the answer may depend on antigen levels on tumors.
The enhanced sensitivity for pep-HLA-A2 exhibited by the full-length TCR in both the T cell hybridoma cell line and primary CD4 T cells, is likely due to the robust CD3-based signaling machinery that assembles with a TCR as compared to a CAR construct. That is, a fully assembled TCR complex contains 10 immunoreceptor tyrosine activation motifs (ITAMs) with 20 tyrosine residues available for phosphorylation, compared to the typical CD28/CD3ζ-based CAR construct which has only 3 ITAMS and 6 tyrosine residues (10). As CARs can potentially form dimers, this would increase the number of ITAMs from 3 to 6 with a total of 12 tyrosine residues available for phosphorylation. Although still less than a single TCR/CD3 complex, this might suggest that other factors also play a role in the reduced sensitivity of CARs.
Studies have shown that some CARs have enhanced sensitivity when the extracellular spacer domain is optimized (48–50). How this spacer provides enhanced sensitivity has yet to be determined, however, it is possible that the spacer domain provides greater flexibility or size in order for the scFv to optimally engage its cell surface ligand. The distance between T cell and target cell membranes influences which co-stimulatory and inhibitory molecules are recruited to the immunological synapse. The size of the interacting receptor:ligand pairs could influence the ability to exclude, by a segregation mechanism, inhibitory signaling molecules such as CD45. Previous work studying the signaling mechanisms of TCRs and a typical scFv-CAR showed that signaling through both receptors involved efficient CD45 exclusion (51, 52). The dimensions of our TCR and CAR constructs are the same as used in their study, and it would seem likely that addition of larger extracellular domains to our CAR would if anything decrease sensitivity as the construct would have dimensions that were closer to CD45 and thus reduce the level of segregation. Nevertheless, the CAR constructs used here provide a simple approach to exploring how to optimize both extracellular and intracellular domains, in a comparative approach to the natural TCR/CD3 system.
Using a validated mathematical T cell signaling model, our primary hypothesis is that the CAR (CD28/CD3ζ form) takes longer than the TCR complex to achieve a fully activated phosphorylated state or is less effective at phosphorylating downstream proteins (or a combination of both). Both could be explained by having fewer phosphorylation sites, as is the case when comparing the natural CD3 complex with the signaling domains of the CAR. It is important to note that at the affinities studied, these outcomes are observed even in the absence of the CD4 or CD8 co-receptors that are well known to further enhance sensitivity of TCR-mediating signaling.
The enhanced sensitivity of the TCR/CD3 complex compared to the CAR constructs, suggest that targeting pep-HLA in adoptive T cell therapies with a CAR will require higher expression levels by the cancer cell. This may provide a useful safety margin when targeting pep-HLA complexes expressed at low levels in normal tissue and higher levels in malignant tissue. However, when targeting pep-HLA complexes that have limited expression by the cancer cells (e.g. less than 50 complexes per cell), a normal TCR will likely provide the requisite sensitivity.
The observation that at higher antigen densities the CAR mediated maximal release of cytokines differentially (e.g. higher levels of IL-6 but lower levels of IL-10) suggests a different balance of signaling pathway activation in CARs as compared to TCRs. IL-6 is an acute pro-inflammatory cytokine that utilizes JAK/STAT signaling (53) and it is now well known that CAR-mediated therapies against CD19 have shown cytokine release syndrome with high levels of IL-6 in some patients (e.g. (54–56). To further determine which components of the CAR construct conferred this pro-inflammatory phenotype, a first generation CAR containing only the CD3ζ domain was tested. While this first generation CAR shared a similar sensitivity as the CD28/CD3ζ CAR, it did not mediate the same enhanced level of IL-6 at high antigen density. Our results suggest that the signaling machinery used in the CD28-CD3ζ CAR construct may be biased toward a more inflammatory response under conditions of high antigen levels, compared to conventional TCRs. It may be important to consider the range of antigen levels observed among cancers and to engineer scFv and signaling domains that address these issues.
The exact mechanism of T cell signaling, either by a TCR or CAR, has yet to be fully elucidated. Two hypotheses regarding TCR signaling have involved either conformational changes propagated through the membrane (57) or kinetic proofreading (40). It has also been suggested that TCRs and other highly sensitive receptors discriminate ligands through the accumulation of catch bonds which deliver additional force to the interaction (58, 59). Given that our system utilizes the same antigen-binding domains, the differences in sensitivity observed between TCR and CAR is unlikely due to a difference in catch bond potential.
We also observed in titrations of the antigen peptide, with both TCR and CAR systems, a decrease in the level of cytokines released at high ligand concentrations. Previous models have shown that the behaviors associated with such curves, at high antigen density, is likely the result of a negative feedback mechanism involving SHP-1 (38, 39). The similar high-concentration response profiles for both TCRs and CARs used here support the idea that CARs, like TCRs, are subject to both positive signals through the MAPK pathways and negative signals through SHP-1 and other regulatory molecules. These observations can be more difficult to see in typical CAR systems, where antigen density above the optimal cytokine release values may not be achievable, or because full antigen titrations are not conducted.
In summary, the TCR/CAR system described here provides a rapid strategy to explore antigen densities by simply titrating the antigenic peptides into the target cells that express the appropriate MHC (HLA-A2 in our case). While it is unlikely that the two signaling domains within the CAR construct tested here can fully recapitulate a conventional TCR/CD3 induced T cell response, there are numerous efforts to examine alternative CAR constructs (1, 8, 9, 12). It is possible that including regulatory domains with or without additional stimulatory domains may be beneficial in balancing the CAR cytokine response. Regardless, CARs will likely also have to be optimized based on the receptor’s affinity and the intended target’s expression level on the cancer cell surface.
Supplementary Material
Acknowledgments
We thank Barbara Pilas for assistance with flow cytometry. We also thank Gregoire Altan-Bonnet for helpful discussions about negative feedback at high levels of antigen.
D.M. Kranz is supported by NIH grants 1R01 CA178844, CA187592, and CA037156. D.T. Harris is supported by NIH NRSA CA180723. S.N. Smith was supported by NIH Training Grant T32 GM070421. O. Dushek is funded by a Sir Henry Dale Fellowship jointly funded by the Wellcome Trust and the Royal Society (Grant Number: 098363).
References
- 1.June CH, Riddell SR, Schumacher TN. Adoptive cellular therapy: a race to the finish line. Sci Transl Med. 2015;7:280ps287. doi: 10.1126/scitranslmed.aaa3643. [DOI] [PubMed] [Google Scholar]
- 2.Rapoport AP, Stadtmauer EA, Binder-Scholl GK, Goloubeva O, Vogl DT, Lacey SF, Badros AZ, Garfall A, Weiss B, Finklestein J, Kulikovskaya I, Sinha SK, Kronsberg S, Gupta M, Bond S, Melchiori L, Brewer JE, Bennett AD, Gerry AB, Pumphrey NJ, Williams D, Tayton-Martin HK, Ribeiro L, Holdich T, Yanovich S, Hardy N, Yared J, Kerr N, Philip S, Westphal S, Siegel DL, Levine BL, Jakobsen BK, Kalos M, June CH. NY-ESO-1-specific TCR-engineered T cells mediate sustained antigen-specific antitumor effects in myeloma. Nat Med. 2015;21:914–921. doi: 10.1038/nm.3910. [DOI] [PMC free article] [PubMed] [Google Scholar]
- 3.Grupp SA, Kalos M, Barrett D, Aplenc R, Porter DL, Rheingold SR, Teachey DT, Chew A, Hauck B, Wright JF, Milone MC, Levine BL, June CH. Chimeric antigen receptor-modified T cells for acute lymphoid leukemia. The New England journal of medicine. 2013;368:1509–1518. doi: 10.1056/NEJMoa1215134. [DOI] [PMC free article] [PubMed] [Google Scholar]
- 4.Robbins PF, Kassim SH, Tran TL, Crystal JS, Morgan RA, Feldman SA, Yang JC, Dudley ME, Wunderlich JR, Sherry RM, Kammula US, Hughes MS, Restifo NP, Raffeld M, Lee CC, Li YF, El-Gamil M, Rosenberg SA. A pilot trial using lymphocytes genetically engineered with an NY-ESO-1-reactive T-cell receptor: long-term follow-up and correlates with response. Clin Cancer Res. 2015;21:1019–1027. doi: 10.1158/1078-0432.CCR-14-2708. [DOI] [PMC free article] [PubMed] [Google Scholar]
- 5.Brentjens RJ, Davila ML, Riviere I, Park J, Wang X, Cowell LG, Bartido S, Stefanski J, Taylor C, Olszewska M, Borquez-Ojeda O, Qu J, Wasielewska T, He Q, Bernal Y, Rijo IV, Hedvat C, Kobos R, Curran K, Steinherz P, Jurcic J, Rosenblat T, Maslak P, Frattini M, Sadelain M. CD19-targeted T cells rapidly induce molecular remissions in adults with chemotherapy-refractory acute lymphoblastic leukemia. Sci Transl Med. 2013;5:177ra138. doi: 10.1126/scitranslmed.3005930. [DOI] [PMC free article] [PubMed] [Google Scholar]
- 6.Ghosh A, Smith M, James SE, Davila ML, Velardi E, Argyropoulos KV, Gunset G, Perna F, Kreines FM, Levy ER, Lieberman S, Jay HV, Tuckett AZ, Zakrzewski JL, Tan L, Young LF, Takvorian K, Dudakov JA, Jenq RR, Hanash AM, Motta AC, Murphy GF, Liu C, Schietinger A, Sadelain M, van den Brink MR. Donor CD19 CAR T cells exert potent graft-versus-lymphoma activity with diminished graft-versus-host activity. Nat Med. 2017;23:242–249. doi: 10.1038/nm.4258. [DOI] [PMC free article] [PubMed] [Google Scholar]
- 7.Schmitt TM, Stromnes IM, Chapuis AG, Greenberg PD. New Strategies in Engineering T-cell Receptor Gene-Modified T cells to More Effectively Target Malignancies. Clin Cancer Res. 2015;21:5191–5197. doi: 10.1158/1078-0432.CCR-15-0860. [DOI] [PMC free article] [PubMed] [Google Scholar]
- 8.Sadelain M. Chimeric antigen receptors: driving immunology towards synthetic biology. Curr Opin Immunol. 2016;41:68–76. doi: 10.1016/j.coi.2016.06.004. [DOI] [PMC free article] [PubMed] [Google Scholar]
- 9.Srivastava S, Riddell SR. Engineering CAR-T cells: Design concepts. Trends in immunology. 2015;36:494–502. doi: 10.1016/j.it.2015.06.004. [DOI] [PMC free article] [PubMed] [Google Scholar]
- 10.Harris DT, Kranz DM. Adoptive T Cell Therapies: A Comparison of T Cell Receptors and Chimeric Antigen Receptors. Trends in pharmacological sciences. 2016;37:220–230. doi: 10.1016/j.tips.2015.11.004. [DOI] [PMC free article] [PubMed] [Google Scholar]
- 11.Birnbaum ME, Berry R, Hsiao YS, Chen Z, Shingu-Vazquez MA, Yu X, Waghray D, Fischer S, McCluskey J, Rossjohn J, Walz T, Garcia KC. Molecular architecture of the alphabeta T cell receptor-CD3 complex. Proc Natl Acad Sci U S A. 2014;111:17576–17581. doi: 10.1073/pnas.1420936111. [DOI] [PMC free article] [PubMed] [Google Scholar]
- 12.Jensen MC, Riddell SR. Designing chimeric antigen receptors to effectively and safely target tumors. Curr Opin Immunol. 2015;33:9–15. doi: 10.1016/j.coi.2015.01.002. [DOI] [PMC free article] [PubMed] [Google Scholar]
- 13.Till BG, Jensen MC, Wang J, Chen EY, Wood BL, Greisman HA, Qian X, James SE, Raubitschek A, Forman SJ, Gopal AK, Pagel JM, Lindgren CG, Greenberg PD, Riddell SR, Press OW. Adoptive immunotherapy for indolent non-Hodgkin lymphoma and mantle cell lymphoma using genetically modified autologous CD20-specific T cells. Blood. 2008;112:2261–2271. doi: 10.1182/blood-2007-12-128843. [DOI] [PMC free article] [PubMed] [Google Scholar]
- 14.Sadelain M, Brentjens R, Riviere I. The basic principles of chimeric antigen receptor design. Cancer discovery. 2013;3:388–398. doi: 10.1158/2159-8290.CD-12-0548. [DOI] [PMC free article] [PubMed] [Google Scholar]
- 15.Zhong XS, Matsushita M, Plotkin J, Riviere I, Sadelain M. Chimeric antigen receptors combining 4-1BB and CD28 signaling domains augment PI3kinase/AKT/Bcl-XL activation and CD8+ T cell-mediated tumor eradication. Mol Ther. 2010;18:413–420. doi: 10.1038/mt.2009.210. Epub 2009 Sep 2022. [DOI] [PMC free article] [PubMed] [Google Scholar]
- 16.Pluckthun A. Designed ankyrin repeat proteins (DARPins): binding proteins for research, diagnostics, and therapy. Annu Rev Pharmacol Toxicol. 2015;55:489–511. doi: 10.1146/annurev-pharmtox-010611-134654. [DOI] [PubMed] [Google Scholar]
- 17.Dubrovsky L, Dao T, Gejman RS, Brea EJ, Chang AY, Oh CY, Casey E, Pankov D, Scheinberg DA. T cell receptor mimic antibodies for cancer therapy. Oncoimmunology. 2016;5:e1049803. doi: 10.1080/2162402X.2015.1049803. [DOI] [PMC free article] [PubMed] [Google Scholar]
- 18.Dao T, Yan S, Veomett N, Pankov D, Zhou L, Korontsvit T, Scott A, Whitten J, Maslak P, Casey E, Tan T, Liu H, Zakhaleva V, Curcio M, Doubrovina E, O’Reilly RJ, Liu C, Scheinberg DA. Targeting the intracellular WT1 oncogene product with a therapeutic human antibody. Sci Transl Med. 2013;5:176ra133. doi: 10.1126/scitranslmed.3005661. [DOI] [PMC free article] [PubMed] [Google Scholar]
- 19.Veomett N, Dao T, Liu H, Xiang J, Pankov D, Dubrovsky L, Whitten JA, Park SM, Korontsvit T, Zakhaleva V, Casey E, Curcio M, Kharas MG, O’Reilly RJ, Liu C, Scheinberg DA. Therapeutic efficacy of an Fc-enhanced TCR-like antibody to the intracellular WT1 oncoprotein. Clin Cancer Res. 2014;20:4036–4046. doi: 10.1158/1078-0432.CCR-13-2756. [DOI] [PMC free article] [PubMed] [Google Scholar]
- 20.Dao T, Pankov D, Scott A, Korontsvit T, Zakhaleva V, Xu Y, Xiang J, Yan S, de Morais Guerreiro MD, Veomett N, Dubrovsky L, Curcio M, Doubrovina E, Ponomarev V, Liu C, O’Reilly RJ, Scheinberg DA. Therapeutic bispecific T-cell engager antibody targeting the intracellular oncoprotein WT1. Nature biotechnology. 2015;33:1079–1086. doi: 10.1038/nbt.3349. [DOI] [PMC free article] [PubMed] [Google Scholar]
- 21.Rafiq S, Purdon TJ, Daniyan AF, Koneru M, Dao T, Liu C, Scheinberg DA, Brentjens RJ. Optimized T-cell receptor-mimic chimeric antigen receptor T cells directed toward the intracellular Wilms Tumor 1 antigen. Leukemia. 2017 doi: 10.1038/leu.2016.373. [DOI] [PMC free article] [PubMed] [Google Scholar]
- 22.Ataie N, Xiang J, Cheng N, Brea EJ, Lu W, Scheinberg DA, Liu C, Ng HL. Structure of a TCR-Mimic Antibody with Target Predicts Pharmacogenetics. J Mol Biol. 2016;428:194–205. doi: 10.1016/j.jmb.2015.12.002. [DOI] [PMC free article] [PubMed] [Google Scholar]
- 23.Foote J, Eisen HN. Breaking the affinity ceiling for antibodies and T cell receptors. Proc Natl Acad Sci U S A. 2000;97:10679–10681. doi: 10.1073/pnas.97.20.10679. [DOI] [PMC free article] [PubMed] [Google Scholar]
- 24.Oren R, Hod-Marco M, Haus-Cohen M, Thomas S, Blat D, Duvshani N, Denkberg G, Elbaz Y, Benchetrit F, Eshhar Z, Stauss H, Reiter Y. Functional comparison of engineered T cells carrying a native TCR versus TCR-like antibody-based chimeric antigen receptors indicates affinity/avidity thresholds. J Immunol. 2014;193:5733–5743. doi: 10.4049/jimmunol.1301769. [DOI] [PubMed] [Google Scholar]
- 25.Stone JD, Harris DT, Soto CM, Chervin AS, Aggen DH, Roy EJ, Kranz DM. A novel T cell receptor single-chain signaling complex mediates antigen-specific T cell activity and tumor control. Cancer immunology, immunotherapy : CII. 2014;63:1163–1176. doi: 10.1007/s00262-014-1586-z. [DOI] [PMC free article] [PubMed] [Google Scholar]
- 26.Cheever MA, Allison JP, Ferris AS, Finn OJ, Hastings BM, Hecht TT, Mellman I, Prindiville SA, Viner JL, Weiner LM, Matrisian LM. The prioritization of cancer antigens: a national cancer institute pilot project for the acceleration of translational research. Clin Cancer Res. 2009;15:5323–5337. doi: 10.1158/1078-0432.CCR-09-0737. [DOI] [PMC free article] [PubMed] [Google Scholar]
- 27.Chapuis AG, Ragnarsson GB, Nguyen HN, Chaney CN, Pufnock JS, Schmitt TM, Duerkopp N, Roberts IM, Pogosov GL, Ho WY, Ochsenreither S, Wolfl M, Bar M, Radich JP, Yee C, Greenberg PD. Transferred WT1-reactive CD8+ T cells can mediate antileukemic activity and persist in post-transplant patients. Sci Transl Med. 2013;5:174ra127. doi: 10.1126/scitranslmed.3004916. [DOI] [PMC free article] [PubMed] [Google Scholar]
- 28.Morgan RA, Dudley ME, Wunderlich JR, Hughes MS, Yang JC, Sherry RM, Royal RE, Topalian SL, Kammula US, Restifo NP, Zheng Z, Nahvi A, de Vries CR, Rogers-Freezer LJ, Mavroukakis SA, Rosenberg SA. Cancer regression in patients after transfer of genetically engineered lymphocytes. Science. 2006;314:126–129. doi: 10.1126/science.1129003. [DOI] [PMC free article] [PubMed] [Google Scholar]
- 29.Johnson LA, Morgan RA, Dudley ME, Cassard L, Yang JC, Hughes MS, Kammula US, Royal RE, Sherry RM, Wunderlich JR, Lee CC, Restifo NP, Schwarz SL, Cogdill AP, Bishop RJ, Kim H, Brewer CC, Rudy SF, VanWaes C, Davis JL, Mathur A, Ripley RT, Nathan DA, Laurencot CM, Rosenberg SA. Gene therapy with human and mouse T-cell receptors mediates cancer regression and targets normal tissues expressing cognate antigen. Blood. 2009;114:535–546. doi: 10.1182/blood-2009-03-211714. [DOI] [PMC free article] [PubMed] [Google Scholar]
- 30.Smith SN, Sommermeyer D, Piepenbrink KH, Blevins SJ, Bernhard H, Uckert W, Baker BM, Kranz DM. Plasticity in the Contribution of T Cell Receptor Variable Region Residues to Binding of Peptide-HLA-A2 Complexes. J Mol Biol. 2013;425:4496–4507. doi: 10.1016/j.jmb.2013.08.007. [DOI] [PMC free article] [PubMed] [Google Scholar]
- 31.Kuball J, Dossett ML, Wolfl M, Ho WY, Voss RH, Fowler C, Greenberg PD. Facilitating matched pairing and expression of TCR chains introduced into human T cells. Blood. 2007;109:2331–2338. doi: 10.1182/blood-2006-05-023069. [DOI] [PMC free article] [PubMed] [Google Scholar]
- 32.Engels B, Uckert W. Redirecting T lymphocyte specificity by T cell receptor gene transfer - a new era for immunotherapy. Mol Aspects Med. 2007;28:115–142. doi: 10.1016/j.mam.2006.12.006. [DOI] [PubMed] [Google Scholar]
- 33.Kieke MC, Shusta EV, Boder ET, Teyton L, Wittrup KD, Kranz DM. Selection of functional T cell receptor mutants from a yeast surface- display library. Proc Natl Acad Sci U S A. 1999;96:5651–5656. doi: 10.1073/pnas.96.10.5651. [DOI] [PMC free article] [PubMed] [Google Scholar]
- 34.Richman SA, Aggen DH, Dossett ML, Donermeyer DL, Allen PM, Greenberg PD, Kranz DM. Structural features of T cell receptor variable regions that enhance domain stability and enable expression as single-chain ValphaVbeta fragments. Molecular immunology. 2009;46:902–916. doi: 10.1016/j.molimm.2008.09.021. [DOI] [PMC free article] [PubMed] [Google Scholar]
- 35.Aleksic M, Liddy N, Molloy PE, Pumphrey N, Vuidepot A, Chang KM, Jakobsen BK. Different affinity windows for virus and cancer-specific T-cell receptors: implications for therapeutic strategies. Eur J Immunol. 2012;42:3174–3179. doi: 10.1002/eji.201242606. [DOI] [PMC free article] [PubMed] [Google Scholar]
- 36.Holler PD, Chlewicki LK, Kranz DM. TCRs with high affinity for foreign pMHC show self-reactivity. Nature immunology. 2003;4:55–62. doi: 10.1038/ni863. [DOI] [PubMed] [Google Scholar]
- 37.Zhao Y, Bennett AD, Zheng Z, Wang QJ, Robbins PF, Yu LY, Li Y, Molloy PE, Dunn SM, Jakobsen BK, Rosenberg SA, Morgan RA. High-affinity TCRs generated by phage display provide CD4+ T cells with the ability to recognize and kill tumor cell lines. J Immunol. 2007;179:5845–5854. doi: 10.4049/jimmunol.179.9.5845. [DOI] [PMC free article] [PubMed] [Google Scholar]
- 38.Altan-Bonnet G, Germain RN. Modeling T cell antigen discrimination based on feedback control of digital ERK responses. PLoS biology. 2005;3:e356. doi: 10.1371/journal.pbio.0030356. [DOI] [PMC free article] [PubMed] [Google Scholar]
- 39.Francois P, Voisinne G, Siggia ED, Altan-Bonnet G, Vergassola M. Phenotypic model for early T-cell activation displaying sensitivity, specificity, and antagonism. Proc Natl Acad Sci U S A. 2013;110:E888–897. doi: 10.1073/pnas.1300752110. [DOI] [PMC free article] [PubMed] [Google Scholar]
- 40.Lever M, Maini PK, van der Merwe PA, Dushek O. Phenotypic models of T cell activation. Nature reviews Immunology. 2014;14:619–629. doi: 10.1038/nri3728. [DOI] [PubMed] [Google Scholar]
- 41.Dushek O, van der Merwe PA. An induced rebinding model of antigen discrimination. Trends in immunology. 2014;35:153–158. doi: 10.1016/j.it.2014.02.002. [DOI] [PMC free article] [PubMed] [Google Scholar]
- 42.Lever M, Lim HS, Kruger P, Nguyen J, Trendel N, Abu-Shah E, Maini PK, van der Merwe PA, Dushek O. Architecture of a minimal signaling pathway explains the T-cell response to a 1 million-fold variation in antigen affinity and dose. Proc Natl Acad Sci U S A. 2016;113:E6630–e6638. doi: 10.1073/pnas.1608820113. [DOI] [PMC free article] [PubMed] [Google Scholar]
- 43.Dushek O, Aleksic M, Wheeler RJ, Zhang H, Cordoba SP, Peng YC, Chen JL, Cerundolo V, Dong T, Coombs D, van der Merwe PA. Antigen potency and maximal efficacy reveal a mechanism of efficient T cell activation. Science signaling. 2011;4:ra39. doi: 10.1126/scisignal.2001430. [DOI] [PMC free article] [PubMed] [Google Scholar]
- 44.Stone JD, Artyomov MN, Chervin AS, Chakraborty AK, Eisen HN, Kranz DM. Interaction of streptavidin-based peptide-MHC oligomers (tetramers) with cell-surface TCRs. J Immunol. 2011;187:6281–6290. doi: 10.4049/jimmunol.1101734. [DOI] [PMC free article] [PubMed] [Google Scholar]
- 45.Chmielewski M, Hombach A, Heuser C, Adams GP, Abken H. T cell activation by antibody-like immunoreceptors: increase in affinity of the single-chain fragment domain above threshold does not increase T cell activation against antigen-positive target cells but decreases selectivity. J Immunol. 2004;173:7647–7653. doi: 10.4049/jimmunol.173.12.7647. [DOI] [PubMed] [Google Scholar]
- 46.Bonifacino JS, Chen C, Lippincott-Schwartz J, Ashwell JD, Klausner RD. Subunit interactions within the T-cell antigen receptor: clues from the study of partial complexes. Proc Natl Acad Sci U S A. 1988;85:6929–6933. doi: 10.1073/pnas.85.18.6929. [DOI] [PMC free article] [PubMed] [Google Scholar]
- 47.Sadelain M, Papapetrou EP, Bushman FD. Safe harbours for the integration of new DNA in the human genome. Nature reviews Cancer. 2012;12:51–58. doi: 10.1038/nrc3179. [DOI] [PubMed] [Google Scholar]
- 48.Guest RD, Hawkins RE, Kirillova N, Cheadle EJ, Arnold J, O’Neill A, Irlam J, Chester KA, Kemshead JT, Shaw DM, Embleton MJ, Stern PL, Gilham DE. The role of extracellular spacer regions in the optimal design of chimeric immune receptors: evaluation of four different scFvs and antigens. J Immunother. 2005;28:203–211. doi: 10.1097/01.cji.0000161397.96582.59. [DOI] [PubMed] [Google Scholar]
- 49.Hudecek M, Lupo-Stanghellini MT, Kosasih PL, Sommermeyer D, Jensen MC, Rader C, Riddell SR. Receptor affinity and extracellular domain modifications affect tumor recognition by ROR1-specific chimeric antigen receptor T cells. Clin Cancer Res. 2013;19:3153–3164. doi: 10.1158/1078-0432.CCR-13-0330. [DOI] [PMC free article] [PubMed] [Google Scholar]
- 50.Hudecek M, Sommermeyer D, Kosasih PL, Silva-Benedict A, Liu L, Rader C, Jensen MC, Riddell SR. The nonsignaling extracellular spacer domain of chimeric antigen receptors is decisive for in vivo antitumor activity. Cancer immunology research. 2015;3:125–135. doi: 10.1158/2326-6066.CIR-14-0127. [DOI] [PMC free article] [PubMed] [Google Scholar]
- 51.James JR, Vale RD. Biophysical mechanism of T-cell receptor triggering in a reconstituted system. Nature. 2012;487:64–69. doi: 10.1038/nature11220. [DOI] [PMC free article] [PubMed] [Google Scholar]
- 52.Carbone CB, Kern N, Fernandes RA, Hui E, Su X, Garcia KC, Vale RD. In vitro reconstitution of T cell receptor-mediated segregation of the CD45 phosphatase. Proc Natl Acad Sci U S A. 2017 doi: 10.1073/pnas.1710358114. [DOI] [PMC free article] [PubMed] [Google Scholar]
- 53.Mihara M, Hashizume M, Yoshida H, Suzuki M, Shiina M. IL-6/IL-6 receptor system and its role in physiological and pathological conditions. Clinical science (London, England: 1979) 2012;122:143–159. doi: 10.1042/CS20110340. [DOI] [PubMed] [Google Scholar]
- 54.Porter DL, Levine BL, Kalos M, Bagg A, June CH. Chimeric antigen receptor-modified T cells in chronic lymphoid leukemia. The New England journal of medicine. 2011;365:725–733. doi: 10.1056/NEJMoa1103849. [DOI] [PMC free article] [PubMed] [Google Scholar]
- 55.Fitzgerald JC, Weiss SL, Maude SL, Barrett DM, Lacey SF, Melenhorst JJ, Shaw P, Berg RA, June CH, Porter DL, Frey NV, Grupp SA, Teachey DT. Cytokine Release Syndrome After Chimeric Antigen Receptor T Cell Therapy for Acute Lymphoblastic Leukemia. Critical care medicine. 2017;45:e124–e131. doi: 10.1097/CCM.0000000000002053. [DOI] [PMC free article] [PubMed] [Google Scholar]
- 56.Turtle CJ, Hanafi LA, Berger C, Hudecek M, Pender B, Robinson E, Hawkins R, Chaney C, Cherian S, Chen X, Soma L, Wood B, Li D, Heimfeld S, Riddell SR, Maloney DG. Immunotherapy of non-Hodgkin’s lymphoma with a defined ratio of CD8+ and CD4+ CD19-specific chimeric antigen receptor-modified T cells. Sci Transl Med. 2016;8:355ra116. doi: 10.1126/scitranslmed.aaf8621. [DOI] [PMC free article] [PubMed] [Google Scholar]
- 57.Gil D, Schamel WW, Montoya M, Sanchez-Madrid F, Alarcon B. Recruitment of Nck by CD3 epsilon reveals a ligand-induced conformational change essential for T cell receptor signaling and synapse formation. Cell. 2002;109:901–912. doi: 10.1016/s0092-8674(02)00799-7. [DOI] [PubMed] [Google Scholar]
- 58.Liu B, Chen W, Evavold BD, Zhu C. Accumulation of dynamic catch bonds between TCR and agonist peptide-MHC triggers T cell signaling. Cell. 2014;157:357–368. doi: 10.1016/j.cell.2014.02.053. [DOI] [PMC free article] [PubMed] [Google Scholar]
- 59.Luca VC, Kim BC, Ge C, Kakuda S, Wu D, Roein-Peikar M, Haltiwanger RS, Zhu C, Ha T, Garcia KC. Notch-Jagged complex structure implicates a catch bond in tuning ligand sensitivity. Science. 2017;355:1320–1324. doi: 10.1126/science.aaf9739. [DOI] [PMC free article] [PubMed] [Google Scholar]
Associated Data
This section collects any data citations, data availability statements, or supplementary materials included in this article.