

Abstract
Introduction
Previously, a model to predict massive transfusion protocol (activation) was derived using a single-institution dataset. The PROMMTT database was used to externally validate this model’s ability to predict both massive transfusion protocol (MTP) activation and massive transfusion (MT) administration using multiple MT definitions.
Methods
The app model was used to calculate the predicted probability of massive transfusion protocol activation or massive transfusion delivery. The five definitions of MT used were: 1) 10 units packed red blood cells (PRBCs) in 24 hours; 2) Resuscitation Intensity score ≥ 4; 3) Critical Administration Threshold; 4) 4 units PRBCs in 4 hours; and 5) 6 units PRBCs in 6 hours. Receiver operating curves were plotted to compare the predicted probability of MT with observed outcomes.
Results
Of 1245 patients in the dataset, 297 (24%) met definition 1, 570 (47%) met definition 2, 364 (33%) met definition 3, 599 met definition 4 (49.1%), and 395 met definition 5 (32.4%). Regardless of the outcome (MTP activation or MT administration), the predictive ability of the app model was consistent: when predicting activation of the MTP, the area under the curve (AUC) for the model was 0.694 and when predicting MT administration the AUC ranged from 0.695 – 0.711.
Conclusion
Regardless of the definition of massive transfusion used, the app model demonstrates moderate ability to predict the need for massive transfusion in an external, homogenous population. Importantly, the app allows the model to be iteratively re-calibrated (“machine learning”) and thus could improve its predictive capability as additional data are accrued.
Level of Evidence
III
Study Type
Diagnostic test study
Keywords: Massive Transfusion, Trauma, Prediction Model, Smartphone Application
Introduction
For a critically injured patient, aggressive resuscitation through a massive transfusion protocol (MTP) can be a life-saving endeavor. However, unnecessary MTP activation can lead to wasted resources or, worse, over-transfusion of a non-critically injured patient. Many retrospective studies have attempted to develop a scoring system to predict the need for massive transfusion.(1) While most of these approaches use similar data, including vital signs, injury type and severity, and basic laboratory values to assess the likelihood of MTP activation, they vary in the way that they combine these values. Some models are designed for ease of bedside use and sacrifice accuracy in favor of quick, simple calculations.(2) Others such as the Trauma Associated Severe Hemorrhage (TASH) score prioritize accuracy, and the required calculations are too cumbersome for real-time bedside use.(3, 4)
In most hospitals, the decision to activate MTP is currently based on the surgeon’s gestalt of the patient – “does the patient look sick?” – which is necessarily subjective and has been demonstrated to be marginally accurate at best.(5) Therefore, many of the available scoring systems have been aimed at predicting which patients will receive massive transfusion (MT) rather than when a surgeon will actually activate the MTP.(3, 4, 6) Unfortunately, there is currently much debate about what actually constitutes a massive transfusion (MT). Traditionally MT has been somewhat arbitrarily defined as 10 units of packed red blood cells (pRBCs) in 24 hours.(7, 8) However, in the derivation of the TASH model, MT was defined as 10 units of PRBCs from time of presentation until intensive care unit admission without a defined time frame. More recently, several groups have attempted to develop a more data-driven definition of MT. (9, 10) Thus, even the clinical endpoint of MT delivery is subject to variability between studies, making external validation and replication of results difficult.
Because of the limitations of previous predictive models as described above, we chose to evaluate the model derived by Mina et al.(11) We chose to further investigate this model in particular for several reasons: 1) it does not transform continuous variables such as heart rate or systolic blood pressure into binary categorical variables; 2) it uses parameters that are available early in the course of the resuscitation of a critically ill patient; and 3) it has been developed into a smartphone application (app) to facilitate bedside use. Our aim was to validate the app model’s ability to predict MTP activation, as well as actual MT administration based on five common MT definitions using the high quality, multi-center dataset from the PRospective, Observational, Multicenter, Major Trauma Transfusion [PROMMTT] study.(12)
Methods
Approval for this study was obtained from the Institutional Review Board at our institution and the publication committee of the Prospective, Observational, Multicenter, Major Trauma Transfusion [PROMMTT] Study. The PROMMTT database contains prospectively collected data on transfused trauma patients from ten Level 1 Trauma Centers throughout the United States. Variables collected include patient demographics, admission vital signs (systolic blood pressure, heart rate), injury severity score (ISS), admission base deficit, mechanism of injury, transfusion details, and survival.
We chose to use MTP activation as our primary outcome because it is necessarily a resource intensive endeavor regardless of whether the patient ultimately receives a massive transfusion. Although it has been demonstrated to be relatively inaccurate, and despite the numerous MT prediction models in existence, most trauma centers continue use the “surgeon’s gestalt” as the trigger to activate the MTP. We therefore used an analogous datapoint in the PROMMTT dataset, which was collected upon the patient’s arrival to the resuscitation bay by asking the attending surgeon whether they felt that MTP would need to be activated. The secondary outcome was massive transfusion delivery, which was defined in the following five ways. The first four definitions consider only the amount of packed red blood cells (pRBCs) transfused: 10 units packed red blood cells (pRBCs) in 24 hours(7, 8); 3 units of pRBCs in 60 minutes (described as the Critical Administration Threshold [CAT] in a previous study(10)); and two cutoffs at midrange timepoints, namely 6 units of pRBCs in 6 hours and 4 units of pRBCs in 4 hours. We also evaluated the Resuscitation Intensity (RI) score, a definition that considers the volumes of both crystalloids and colloids infused, including synthetic starch solutions and non-pRBC blood products such as platelets and fresh frozen plasma (FFP); the RI score is calculated as the number of “units” of crystalloid, colloid, and blood products administered within the first 30 minutes of resuscitation. An RI score ≥ 4 was considered an MT.(9)
The app model as described in Mina et al was applied to the PROMMTT dataset; the variables, β-coefficients, and scaling and centering vectors (χ) are shown in Table 1.(11) As the model is based on a form of a logistic regression (least absolute shrinkage and selection operator [LASSO] logistic regression), and β*X represents the linear combination of these variables and scaled/centered coefficients, the probability resulting from the linear combination was calculated as follows:
This probability was termed the intermediate probability (IPr) which was then transformed into a clinically relevant probability of MTP based on the logarithmic function:
The calculated probability was then compared to the six observed outcomes, as described above. The groups identified as meeting the definition of massive transfusion using the five different definitions were compared using χ2, and the Kruskal-Wallis test as appropriate. The area under the receiver operating characteristic curve (AUC) was then used to evaluate the predictive ability of the model for each of these outcomes. To evaluate the effect of bias on the observed versus predicted probability of MTP activation, a bootstrapped calibration curve was plotted, Statistical analysis was completed using the “gmodels,” “rms” and “ROCR” packages in the R statistical and computing environment (R version 3.2.2, R Development Core Team, Vienna, Austria).
Table 1.
App Model Predictor Coefficient and Centering/Scaling Vectors
| Predictor | Coefficient (Vector β) |
Variable (Vector X) |
||
|---|---|---|---|---|
| β Value | SD | Center | Scale | |
| Intercept | −4.972 | 0.111 | 0 | 1 |
| BD | −1.551 | 0.101 | −4.702 | 3.280 |
| GSW | 0.142 | 0.224 | 0 | 1 |
| ln(HR/SBP) | 0.591 | 0.060 | −0.377 | 0.340 |
| ln(HR/SBP) X BD | 0.180 | 0.028 | 1.451 | 2.387 |
| BD X GSW | −0.074 | 0.0001 | −0.905 | 2.693 |
| BD X SW | 0.037 | 0.033 | −0.282 | 1.496 |
| ln(HR/SBP) × Blunt | 0.098 | 0.045 | −0.312 | 0.332 |
| BD2 | −0.367 | 0.058 | 32.843 | 62.176 |
GSW= Gunshot wound; SW = Stab wound; Blunt = blunt injury. GSW, SW, and Blunt are coded as 0 (negative) or 1 (positive).
Results
Dataset Characteristics
The PROMMTT dataset contains data on 1,245 unique patients who were transfused at least one unit of pRBCs upon arrival to the resuscitation bay. Selected demographics for these patients are presented in Table 2. Due to the inclusion criteria for enrollment, patients in the PROMMTT data set were, on average, more critically ill than those in the original model derivation sample. In the derivation population of the Mina study, the average ISS was only 10.9, versus an average ISS in the PROMMTT population of 25.0. In addition, only 3.6% of patients in the original Mina sample had MTP activated, while the attending surgeon reported that they would activate MTP for 33.3% of patients in the PROMMTT study.
Table 2.
Selected Demographics of the PROMMTT Study Population
| n | 1245 |
| Male (n, %) | 923 (74.1%) |
| Age (median, [IQR]) | 38.0 [24.0, 54.0] |
| Heart rate, (median, [IQR]) | 105.0 [86.0, 124.0] |
| SBP (median, [IQR]) | 106.0 [86.0, 128.0] |
| BD (median, [IQR]) | −6.15 [−10.3, −3.0] |
| ISS (median, [IQR]) | 25.0 [16.0, 34.0] |
| Units pRBCs given in 24 hours (median, [IQR]) | 5.0 [2.0, 9.0] |
| 30 Day Mortality (n, %) | 260 (20.9%) |
| Mechanism of Injury (n, %) | |
| Blunt | 800 (64.3%) |
| GSW | 287 (23.1%) |
| SW | 145 (11.6%) |
| Other/Unknown | 13 (1.0%) |
IQR = Interquartile Range
Attending Physician Prediction of Massive Transfusion Protocol Activation
Patients were then grouped based on whether the attending surgeon thought MTP activation would be necessary, as well as whether they met the various definitions of MT (Table 3). One hundred and forty-nine patients met criteria for all of the five different MT definitions; among these, attending physicians indicated that they would activate MTP for 90. Omnibus ANOVA testing identified significant differences in the mean systolic blood pressure and number of PRBCs transfused in the first 24 hours among the 6 groups who were ruled in by each definition (Table 3). Post-hoc analyses demonstrated significant differences between the mean SBP of patients ruled in by definition 2 and 5, and between groups 4 and 5. There were also significant differences in the number of units of PRBCs transfused in the first 24 hours among nearly all groups. No difference was observed in the proportions of patients with blunt injuries, gunshot wound, or stab wounds ruled in or out using any of the five MT definitions. Of all of the MT definitions tested here, the 10 units of pRBCs in 24 hours criteria demonstrated the greatest ability to discriminate between patients who died within 24 hours of admission, 72 hours of admission, and 30 days of admission.
Table 3.
Comparison of Groups “Ruled In” Using the Various Massive Transfusion Definitions
| Demographic | Mt1 | Mt2 | Mt3 | Mt4 | Mt5 | Mt6 | p |
|---|---|---|---|---|---|---|---|
| n | 297 | 599 | 395 | 570 | 264 | 415 | |
| Male (n, %) | 226 (76.1%) | 458 (76.5%) | 298 (75.4%) | 445 (78.1%) | 274 (75.3%) | 300 (72.3%) | 0.46 |
| Age (median, [IQR]) | 37.0 [24.0, 53.0] | 36.5 [23.3, 52.0] | 35.0 [23.0, 51.0] | 37.0 [24.0, 53.0] | 36.0 [24.0, 51.0] | 36.0 [23.25, 51.0] | 0.90 |
| Heart rate (median, [IQR]) | 112.0 [91.3, 132.0] | 111.0 [89.0, 130.0] | 112.0 [90.8, 133.3] | 111.0 [89.0, 130.8] | 110.0 [88.0, 132.0] | 111.0 [88.0, 130.2] | 0.76 |
| SBP (median, [IQR]) | 92.0 [74.5, 121.0] | 98.0 [89.0, 130.0] | 94.0 [77.5, 121.0] | 98.0 [80.0, 120.5] | 90.0 [71.0, 111.3] | 94.5 [80.0, 119.0] | 0.015 |
| BD (median, [IQR]) | −9.0 [−13.0, −5.9] | −8.0 [−12.0, −5.0] | −9.0 [−13.1, −5.9] | −8.5 [−12.3, −5.0] | −8.6 [−13.0, −5.9] | −8.7 [−12.0, −5.0] | 0.16 |
| ISS (median, [IQR]) | 29.0 [19.0, 41.0] | 27.0 [17.0, 38.0] | 29.0 [18.0, 41.0] | 27.0 [17.0, 38.0] | 27.0 [17.0, 38.0] | 26.0 [16.0, 38.0] | 0.05 |
| Units pRBCs given in 24 hours (median, [IQR]) | 16.0 [12.0, 27.0] | 8.0 [5.0, 16.0] | 12.0 [8.0, 22.0] | 9.0 [5.0, 16.0] | 8.0 [4.0, 17.0] | 7.0 [4.0, 13.0] | <0.0001 |
| 24 Hour Mortality (n, %) | 83 (27.9%) | 119 (19.9%) | 95 (24.1%) | 116 (20.4%) | 79 (21.7%) | 72 (17.3%) | 0.013 |
| 72 Hour Mortality (n, %) | 92 (31.0%) | 133 (22.2%) | 106 (26.8%) | 130 (22.8%) | 89 (24.5%) | 89 (21.4%) | 0.028 |
| 30 Day Mortality (n, %) | 118 (39.7%) | 179 (29.9%) | 135 (34.2%) | 176 (30.9%) | 112 (30.8%) | 115 (27.7%) | 0.014 |
| Mechanism of Injury (n, %) | |||||||
| Blunt | 190 (64.0%) | 370 (61.8%) | 240 (60.8%) | 354 (62.1%) | 225 (61.8%) | 250 (60.2%) | 0.94 |
| GSW | 83 (27.9%) | 156 (26.0%) | 111 (28.1%) | 148 (26.0%) | 96 (26.4%) | 125 (40.1) | 0.7 |
| SW | 21 (7.1%) | 66 (11.0%) | 39 (9.9%) | 61(10.7%) | 41 (11.3%) | 35 (8.4%) | 0.34 |
Mt1 = 10 units; PRBCs in 24 Hours; Mt2 = 4 units PRBCs in 4 Hours; Mt3 = 6 units PRBCs in 6 Hours; Mt4 = CAT +; Mt5 = RI ≥ 4; Mt6 = Attending Expects MTP Activation; IQR = Interquartile Range
Actual Massive Transfusion Administration
The model was applied to the dataset, yielding a calculated probability of MTP activation. We divided patients into risk quartiles based on the predicted probability (Table 4). As expected, there was a linear relationship between the calculated probability of MTP activation and worsening admission vital signs. There was also a linear relationship between the predicted probability of MTP activation and the rate of actual MT activation (Table 4). ROC curves were used to evaluate the discrimination performance of the app model. For the primary outcome, MTP activation based on attending physician’s gestalt (Mt1), the model’s predictive ability was fair to good, with an AUC of 0.694 (Figure 1). The models performance did not vary when used instead to predict one of the five definitions of MT (Mt2-Mt6): The AUC for Mt2 was 0.698 (95% CI 0.664–0.732), 0.711 for Mt3 (95% CI 0.675 – 0.748), 0.700 for Mr4 (95% CI 0.666 – 0.735), 0.696 for Mt5 (0.658 – 0.733), and 0.694 for Mt6 (95% CI 0.656 – 0.733) (Figure 1). A bootstrapped (n=1000) calibration curve was plotted to evaluate the app model’s ability to predict the attending surgeon’s expectation to activate the MTP (MT definition 6) since this was the outcome used during the derivation of the original model (Figure 2). The curve demonstrates underestimation of the probability of MT at the mid range, and overestimates risk at the extreme high and low values.
Table 4.
Clinical Characteristics by Predicted Probability of MTP Activation
| Demographic | 0–24.9% | 25 – 49.9% | 50 – 74.9% | 75–100% | p |
|---|---|---|---|---|---|
| n | 442 | 274 | 197 | 19 | – |
| Male (n, %) | 331 (74.9%) | 197 (71.9%) | 145 (73.6%) | 15 (78.9%) | 0.79 |
| Age (median, [IQR]) | 45.0 [27.0, 58.8] | 36.0 [23.0, 50.8] | 35.0 [24.0, 49.0] | 29.0 [21.0, 43.0] | <0.0001 |
| Heart rate (median, [IQR]) | 96.5 [81.0, 111.0] | 113.5 [94.0, 130.8] | 121.0 [108.0, 139.0] | 120.7 [93.0, 142.0] | <0.0001 |
| SBP (median, [IQR]) | 114.0 [91.3, 135.0] | 100.0 [85.3, 122.0] | 86.0 [71.0, 110.0] | 93.0 [77.0, 109.5] | <0.0001 |
| BD (median, [IQR]) | −3.0 [−4.7, −1.0] | −8.0 [−9.0, −7.0] | −13.0 [−15.0, −11.6] | −23.0 [−25.1, −21.0] | <0.0001 |
| ISS (median, [IQR]) | 22.0 [14.0, 33.8] | 27.0 [18.0, 41.0] | 27.0 [17.0, 38.0] | 25.0 [15.0, 34.0] | <0.0001 |
| Units pRBCs given in 24 hours (median, [IQR]) | 4.0 [2.0, 6.0] | 5.0 [3.0, 10.0] | 7.0 [4.0, 16.0] | 16.0 [8.0, 25.0] | <0.0001 |
| 24 Hour Mortality (n, %) | 26 (5.9%) | 31 (11.3%) | 31 (15.7%) | 8 (42.1%) | <0.0001 |
| 72 Hour Mortality (n, %) | 35 (7.9%) | 37 (13.5%) | 43 (21.8%) | 9 (47.4%) | <0.0001 |
| 30 Day Mortality (n, %) | 69 (15.6%) | 54 (19.7%) | 56 (28.4%) | 11 (57.9%) | <0.0001 |
| Mechanism of Injury (n, %) | |||||
| Blunt | 312 (70.6%) | 184 (67.2%) | 136 (69.0%) | 9 (47.4%) | 0.17 |
| GSW | 82 (18.6%) | 59 (21.5%) | 49 (24.9%) | 9 (47.4%) | 0.01 |
| SW | 45 (10.2%) | 28 (10.2%) | 11 (5.6%) | 1 (5.3%) | 0.23 |
Mt1 = 10 units; PRBCs in 24 Hours; Mt2 = 4 units PRBCs in 4 Hours; Mt3 = 6 units PRBCs in 6 Hours; Mt4 = CAT +; Mt5 = RI ≥ 4; Mt6 = Attending Expects MTP Activation, IQR = Interquartile Range
Figure 1.

Receiver Operating Characteristic Curves By Massive Transfusion Definition
Figure 2.
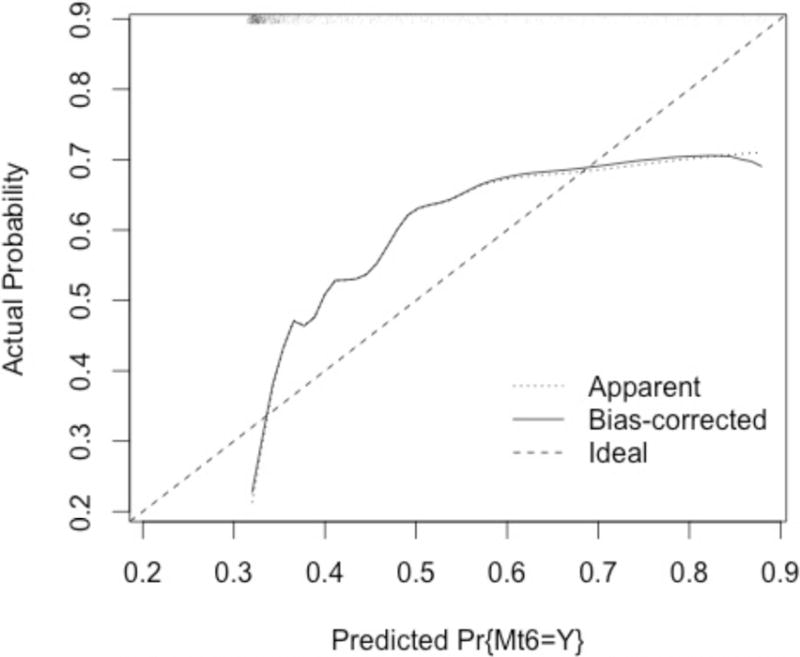
Bootstrapped Calibration Curve for the App Model Demonstrates Systematic Underprediction At the Extremes of Predicted Probability of MTP Activation
Lastly, in order to compare the app model to other commonly used MTP prediction models, we applied the ABC and TASH models to the PROMMTT dataset and tested their ability to predict whether a patient would receive 10 units of PRBCs in 24 hours (MT definition 1), and calculated the AUC for each.(3, 6) Thirty-one patients (2.5%) had met the TASH threshold of a score of 18 or greater, while 33.8% of patients had an ABC score of 2 or greater. Both demonstrated worse predictive ability than the app model: the ABC score had an AUC of 0.620 while the TASH score had an AUC of 0.527.
Discussion
While several groups have developed MT prediction scoring systems, few have been rigorously validated using an external dataset. In the original study, the authors reported an AUC of 0.96, which was superior to those reported for other commonly used models, such as the Assessment of Blood Consumption (ABC) or Trauma-Associated Severe Hemorrhage (TASH) scores.(3, 4, 11, 13) We observed a decline in the predictive ability of the app model, with a maximal AUC of 0.711, when applied to the PROMMTT dataset. However, this decline in performance is not unexpected during the external validation of any predictive model. There are many potential reasons for this result. First, the original app model was derived using single-institution data; presumably MTP activation patterns among the physicians within this group were more uniform than among the physician groups at each of the 10 PROMMTT study sites.(11) More significantly, the original dataset included all trauma activations, regardless of the level of activation or mechanism of injury. In contrast, the PROMMTT study had rigorous inclusion criteria, resulting in a dataset which represents a highly homogenous sample – all patients included in the study presented as the highest level of trauma activation and were transfused at least one unit of a blood product within 30 minutes of arrival. Therefore, discriminating between patients who will and will not require MT in this population is considerably more difficult than in the original derivation sample. This heterogeneity is likely the cause at least in part of the systematic underprediction of MTP activation at the lowest and highest calculated probabilities, and overestimation in the mid-range, as seen in the calibration plot. Notably, this miscategorization was also seen in the original model, suggesting that there may be no single patient population whose characteristics suggest a 100% probability of the need for MTP activation.(11) The model’s adequate to good performance in this setting suggests that the model is in fact generalizable to other patient populations.
As in other models, including the ABC, TASH, and Prince of Wales Hospital (PWH), Massive Transfusion Score (MTS) scoring systems, the app model was developed to predict MTP activation – we therefore expected that the model would perform better in this setting than in predicting actual MT delivery.(3, 4, 14, 15) Instead, the model’s performance remained consistent across all outcomes tested, including both MTP activation and the five different definitions of MT. Despite the fact that each MT definition “ruled in” a different group of patients, ranging from just under one-quarter to roughly one-third of the total sample, there were few differences in the presenting vital signs among each of the populations. This finding at least partially explains the lack of variation in performance by the model, and suggests that the app model works reasonably well to identify a population of critically ill patients who may benefit from a balanced resuscitation. Adoption of the app model could therefore help to obviate discussion about the optimal definition of MT.
Despite these encouraging findings, as in most population-based predictive models it nevertheless remains difficult at the individual patient level to accurately predict whether the MTP should be activated. According to Brohi, an ideal scoring system would operate at a better than 90% sensitivity; he cites the numerous models that have been developed as evidence that it is “impossible to produce a robust, reliable tool.”(16) However, while the sensitivity and specificity reported here do not achieve this goal either, we believe that this model has the potential improve its accuracy over time. One of the greatest advantages of the app model is that all of the clinical parameters are considered as continuous variables. All other previously described scoring systems dichotomize at least one continuous variable (e.g. heart rate above or below 120), resulting in a loss of granularity of the data and precluding subsequent revisions to the model.(4, 6, 17) Because the app model preserves the raw data for each patient, as additional patients are treated and data points are accrued, the model can be iteratively recalibrated. Over time, pooling of regional, national, or global data could, at one extreme, lead to the development of a universal model; alternatively this process of iterative predictive improvement could be used to tailor a model that is specific to the patient population of a single institution. Conceivably, a universal model could lead to a standardized definition of a “massive transfusion” patient. However, one potential downside of such an approach would be inability of the model to compensate for the variability among provider and institutional practice patterns. It seems likely that a universal model would be more useful for research purposes, while an institution-specific model would be more useful for clinical application.
This capability can also allow the model the ability to adapt to new treatment modalities or therapies that may develop, such as the use of novel hemostatic agents that might reduce the number of patients who receive massive transfusion. As the model improves, we hope that both inappropriate MTP activation and subsequent blood product wastage and inappropriate inactivation can be reduced.
One flaw of the app model is that the acute coagulopathy of trauma, which is a major driver of the ongoing need for resuscitation, is only indirectly accounted for by the inclusion of base deficit. Although an assessment of a patient’s ability to form a functional clot using the international normalized ratio (INR) or viscoelastic analysis may certainly improve the accuracy of any MTP prediction score, these values often take up to an hour to result and adoption of some of these technologies are not yet widespread.(18) There are, however, data that suggest that admission base deficit is a significant predictor of both mortality and need for MTP activation in several retrospective studies.(19–21) While the lack of availability of point of care base deficit measurement may currently limit the applicability of this model in some centers, we believe that the addition of a simple piece of point of care testing equipment, either in an emergency medical technician kit or in an emergency room setting, could allow for the rapid calculation of an injured patient’s probability of requiring MTP.
Scoring systems are useful not only in providing decision support for clinicians with varying experience in trauma resuscitation, but also in standardizing MTP administration to promote higher quality research. MTP trigger studies are necessarily labor intensive, requiring multicenter participation with dedicated research staff to ensure that high quality, uniform data are obtained. Therefore, the adoption of a standardized predictive mechanism, such as the app model, could help to answer a question that plagues traumatologists. While the app model’s performance did decline in this external validation, its ease of bedside or even pre-hospital use and potential for iterative recalculation and recalibration suggest that the app model warrants further refinement and prospective evaluation.
Acknowledgments
Funding/Support: This work was supported by subcontract W81XWH-08-C-0712 from the US Army Medical Research and Materiel Command. Infrastructure for the Data Coordinating Center was supported by Clinical and Translational Science Awards funds of grant UL1 RR024148 from the National Institutes of Health.
Footnotes
Role of the Sponsors: The sponsors had no role in the design and conduct of the study; collection, management, analysis, and interpretation of the data; or preparation, review, or approval of the manuscript.
Disclaimer: The views and opinions expressed in this article are those of the authors and do not reflect the official policy or position of the Army Medical Department, the Department of the Army, the Department of Defense, or the US government.
Author Contributions:
EI Hodgman participated in data analysis and interpretation, literature review, and preparation of the manuscript.
MW Cripps participated in data analysis and interpretation, literature review, and preparation of the manuscript
MJ Mina participated in data analysis and preparation of the manuscript
EM Bulger participated in the interpretation of the data and preparation and critical review of the manuscript
MA Schreiber participated in the interpretation of the data and preparation and critical review of the manuscript
KJ Brasel participated in the interpretation of the data and preparation and critical review of the manuscript
MJ Cohen participated in the interpretation of the data and preparation and critical review of the manuscript
PC Muskat participated in the interpretation of the data and preparation and critical review of the manuscript
JG Myers participated in the interpretation of the data and preparation and critical review of the manuscript
LH Alarcon participated in the interpretation of the data and preparation and critical review of the manuscript
MH Rahbar participated in the interpretation of the data and preparation and critical review of the manuscript
JB Holcomb participated in the interpretation of the data and preparation and critical review of the manuscript
BA Cotton participated in the interpretation of the data and preparation and critical review of the manuscript
EE Fox participated in the interpretation of the data and preparation and critical review of the manuscript
DJ del Junco participated in the interpretation of the data and preparation and critical review of the manuscript
CE Wade participated in the interpretation of the data and preparation and critical review of the manuscript
HA Phelan participated in the data analysis and interpretation, literature review, and preparation of the manuscript
References
- 1.Maegele M, Brockamp T, Nienaber U, Probst C, Schoechl H, Gorlinger K, Spinella P. Predictive Models and Algorithms for the Need of Transfusion Including Massive Transfusion in Severely Injured Patients. Transfus Med Hemother. 2012;39(2):85–97. doi: 10.1159/000337243. [DOI] [PMC free article] [PubMed] [Google Scholar]
- 2.Cotton BA, Dossett LA, Haut ER, Shafi S, Nunez TC, Au BK, Zaydfudim V, Johnston M, Arbogast P, Young PP. Multicenter validation of a simplified score to predict massive transfusion in trauma. J Trauma. 2010;69(Suppl 1):S33–9. doi: 10.1097/TA.0b013e3181e42411. [DOI] [PubMed] [Google Scholar]
- 3.Yucel N, Lefering R, Maegele M, Vorweg M, Tjardes T, Ruchholtz S, Neugebauer EA, Wappler F, Bouillon B, Rixen D. Trauma Associated Severe Hemorrhage (TASH)-Score: probability of mass transfusion as surrogate for life threatening hemorrhage after multiple trauma. J Trauma. 2006;60(6):1228–36. doi: 10.1097/01.ta.0000220386.84012.bf. discussion 36–7. [DOI] [PubMed] [Google Scholar]
- 4.Maegele M, Lefering R, Wafaisade A, Theodorou P, Wutzler S, Fischer P, Bouillon B, Paffrath T, Trauma Registry of Deutsche Gesellschaft fur U Revalidation and update of the TASH-Score: a scoring system to predict the probability for massive transfusion as a surrogate for life-threatening haemorrhage after severe injury. Vox Sang. 2011;100(2):231–8. doi: 10.1111/j.1423-0410.2010.01387.x. [DOI] [PubMed] [Google Scholar]
- 5.Pommerening MJ, Goodman MD, Holcomb JB, Wade CE, Fox EE, Del Junco DJ, Brasel KJ, Bulger EM, Cohen MJ, Alarcon LH, et al. Clinical gestalt and the prediction of massive transfusion after trauma. Injury. 2015;46(5):807–13. doi: 10.1016/j.injury.2014.12.026. [DOI] [PMC free article] [PubMed] [Google Scholar]
- 6.Nunez TC, Voskresensky IV, Dossett LA, Shinall R, Dutton WD, Cotton BA. Early prediction of massive transfusion in trauma: simple as ABC (assessment of blood consumption)? J Trauma. 2009;66(2):346–52. doi: 10.1097/TA.0b013e3181961c35. [DOI] [PubMed] [Google Scholar]
- 7.Collins JA. Problems associated with the massive transfusion of stored blood. Surgery. 1974;75(2):274–95. [PubMed] [Google Scholar]
- 8.Lim RC, Jr, Olcott Ct, Robinson AJ, Blaisdell FW. Platelet response and coagulation changes following massive blood replacement. J Trauma. 1973;13(7):577–82. doi: 10.1097/00005373-197307000-00001. [DOI] [PubMed] [Google Scholar]
- 9.Rahbar E, Fox EE, del Junco DJ, Harvin JA, Holcomb JB, Wade CE, Schreiber MA, Rahbar MH, Bulger EM, Phelan HA, et al. Early resuscitation intensity as a surrogate for bleeding severity and early mortality in the PROMMTT study. J Trauma Acute Care Surg. 2013;75(1 Suppl 1):S16–23. doi: 10.1097/TA.0b013e31828fa535. [DOI] [PMC free article] [PubMed] [Google Scholar]
- 10.Savage SA, Sumislawski JJ, Zarzaur BL, Dutton WP, Croce MA, Fabian TC. The new metric to define large-volume hemorrhage: results of a prospective study of the critical administration threshold. J Trauma Acute Care Surg. 2015;78(2):224–9. doi: 10.1097/TA.0000000000000502. discussion 9–30. [DOI] [PubMed] [Google Scholar]
- 11.Mina MJ, Winkler AM, Dente CJ. Let technology do the work: Improving prediction of massive transfusion with the aid of a smartphone application. J Trauma Acute Care Surg. 2013;75(4):669–75. doi: 10.1097/TA.0b013e3182a12ba6. [DOI] [PMC free article] [PubMed] [Google Scholar]
- 12.Holcomb JB, Fox EE, Wade CE, Group PS The PRospective Observational Multicenter Major Trauma Transfusion (PROMMTT) study. J Trauma Acute Care Surg. 2013;75(1 Suppl 1):S1–2. doi: 10.1097/TA.0b013e3182983876. [DOI] [PubMed] [Google Scholar]
- 13.Vandromme MJ, Griffin RL, McGwin G, Jr, Weinberg JA, Rue LW, Kerby JD. Prospective identification of patients at risk for massive transfusion: an imprecise endeavor. Am Surg. 2011;77 [PubMed] [Google Scholar]
- 14.Mitra B, Rainer TH, Cameron PA. Predicting massive blood transfusion using clinical scores post-trauma. Vox Sang. 2012;102(4):324–30. doi: 10.1111/j.1423-0410.2011.01564.x. [DOI] [PubMed] [Google Scholar]
- 15.Callcut RA, Cotton BA, Muskat P, Fox EE, Wade CE, Holcomb JB, Schreiber MA, Rahbar MH, Cohen MJ, Knudson MM, et al. Defining when to initiate massive transfusion: a validation study of individual massive transfusion triggers in PROMMTT patients. J Trauma Acute Care Surg. 2013;74(1):59–65. doi: 10.1097/TA.0b013e3182788b34. 7–8; discussion 6–7. [DOI] [PMC free article] [PubMed] [Google Scholar]
- 16.Brohi K. Prediction of acute traumatic coagulopathy and massive transfusion - Is this the best we can do? Resuscitation. 2011;82(9):1128–9. doi: 10.1016/j.resuscitation.2011.06.022. [DOI] [PubMed] [Google Scholar]
- 17.Callcut RA, Cripps MW, Nelson MF, Conroy AS, Robinson BB, Cohen MJ. The Massive Transfusion Score as a decision aid for resuscitation: Learning when to turn the massive transfusion protocol on and off. J Trauma Acute Care Surg. 2016;80(3):450–6. doi: 10.1097/TA.0000000000000914. [DOI] [PMC free article] [PubMed] [Google Scholar]
- 18.Leemann H, Lustenberger T, Talving P, Kobayashi L, Bukur M, Brenni M, Bruesch M, Spahn DR, Keel MJ. The role of rotation thromboelastometry in early prediction of massive transfusion. J Trauma. 2010;69(6):1403–8. doi: 10.1097/TA.0b013e3181faaa25. discussion 8–9. [DOI] [PubMed] [Google Scholar]
- 19.Hodgman EI, Morse BC, Dente CJ, Mina MJ, Shaz BH, Nicholas JM, Wyrzykowski AD, Salomone JP, Rozycki GS, Feliciano DV. Base deficit as a marker of survival after traumatic injury: consistent across changing patient populations and resuscitation paradigms. J Trauma Acute Care Surg. 2012;72(4):844–51. doi: 10.1097/TA.0b013e31824ef9d2. [DOI] [PMC free article] [PubMed] [Google Scholar]
- 20.Dente CJ, Shaz BH, Nicholas JM, Harris RS, Wyrzykowski AD, Ficke BW, Vercruysse GA, Feliciano DV, Rozycki GS, Salomone JP, et al. Early predictors of massive transfusion in patients sustaining torso gunshot wounds in a civilian level I trauma center. J Trauma. 2010;68(2):298–304. doi: 10.1097/TA.0b013e3181cf7f2a. [DOI] [PubMed] [Google Scholar]
- 21.Larson CR, White CE, Spinella PC, Jones JA, Holcomb JB, Blackbourne LH, Wade CE. Association of shock, coagulopathy, and initial vital signs with massive transfusion in combat casualties. J Trauma. 2010;69(Suppl 1):S26–32. doi: 10.1097/TA.0b013e3181e423f4. [DOI] [PubMed] [Google Scholar]