Abstract
In recent years, Surface Enhanced Raman Scattering (SERS) has been widely applied to many different areas, including chemical analysis, biomolecule detection, bioagent diagnostics, DNA sequence, and environmental monitor, due to its capabilities of unlabeled fingerprint identification, high sensitivity, and rapid detection. In biomicrofluidic systems, it is also very powerful to integrate SERS based devices with specified micro-fluid flow fields to further focusing/enhancing/multiplexing SERS signals through molecule registration, concentration/accumulation, and allocation. In this review, after a brief introduction of the mechanism of SERS detection on proteins, we will first focus on the effectiveness of different nanostructures for SERS enhancement and light-to-heat conversion in trace protein analysis. Various protein molecule accumulation schemes by either (bio-)chemical or physical ways, such as immuno, electrochemical, Tip-enhanced Raman spectroscopy, and magnetic, will then be reviewed for further SERS signal amplification. The analytical and repeatability/stability issues of SERS detection on proteins will also be brought up for possible solutions. Then, the comparison about various ways employing microfluidic systems to register, concentrate, and enhance the signals of SERS and reduce the background noise by active or passive means to manipulate SERS nanostructures and protein molecules will be elaborated. Finally, we will carry on the discussion on the challenges and opportunities by introducing SERS into biomicrofluidic systems and their potential solutions.
I. INTRODUCTION
Raman spectroscopy is a non-invasive and non-labeling vibrational spectroscopic technique that provides information regarding the chemical composition and interaction of sample molecules in the measurement volume. The principle underlying Raman scattering (RS) is that when incident light h interacts with molecules or atoms, there is a small chance that some energy is transferred to and from the molecule, which results in Stoke Raman scattering (h) and anti-Stoke Raman scattering (h), respectively [Fig. 1(a)]. Unlike fluorescence only can provide relatively broad band signals, in most cases, by analyzing the Raman scattering (RS) spectrum after the application of a notch filter (laser rejection filter) in the optical pathway, the characteristics which depend on the kinds of atoms and their bond strengths in specific analytes can be identified like fingerprint1 [Fig. 1(b)].
FIG. 1.
Principle of Raman Scattering, (a) Stoke and anti-Stoke modes, and (b) the comparison between fluorescence and Raman Scattering spectra (redrawn after Ref. 1).
For example, Kneipp et al.2 measured the Raman spectrum of two compounds with a similar composition, dopamine and norepinephrine, at a concentration of 5 × 10⁻⁹ M in colloidal silver solutions. In spite of only one atom deviation in their chemical composition, a clear difference between their surface-enhanced Raman scattering (SERS) spectra can be easily identified at Raman shift 1325 cm−1. However, the RS signal is typically very weak and generally equivalent to 10−6 times the intensity of Rayleigh scattering or 10−6–10−9 times the intensity of incident photons of excitation light.3 Although RS has been discovered since the 1930s, it was not widely applied until the breakthrough discovery of surface-enhanced Raman scattering (SERS) in the 1970s, which led to a significant improvement of the signals with an enhancement factor (EF) of up to 105–6 when studying pyridine on rough silver electrodes.4–6 The phenomenon of the SERS effect is now widely accepted by the contributions of both physical and chemical mechanisms which are electromagnetic field enhancement (EM) and chemical enhancement (CE), respectively.7–11 EM field enhancement is due to the formation of localized surface plasma resonance (LSPR) on the nanostructures of metals, such as gold or silver. These nanometer areas are called “hot spots” where can significantly enhance the Raman scattering signal of analytes.1,3 CE enhancement is attributed to the chemisorption interaction, a photon driven charge transfer between the adsorbate and the substrate, and the coupling effect between the electron–hole pair and adsorbed molecules.10 The SERS intensity can be approximately expressed as1,10
where GEM is the EM enhancement factor and and express the enhancement factors for the laser and for the Raman scattered field, respectively. While is the dielectric constant of the surrounding medium, ε() is the dielectric constant of the metallic nanostructure, and d is the distance between the analyte and the metallic nanostructure. The sum term of is the CE enhancement factor and describes the interaction between the molecules and the metal surface. Although the SERS phenomenon consists of two mechanisms, both of them are enabled by specific metals with nanostructures. Therefore, there have been numerous works on the design/arrangement of nanostructures on specific metals for SERS in the past decade. In the next session, we will introduce several possible nanostructures and their arrangements for SERS.
However, to employ SERS for trace protein detection, the signal variations based on the shift of RS spectra need to be correlated with the structures/compositions of various proteins. Most proteins consist of linear polymers built from a series of up to 20 different L-α-amino acids. All proteinogenic amino acids possess common structural features by including an α-carbon, to which an amino group, a carboxyl group, and a variable side chain are bonded.12 Due to a similar composition, RS spectra of proteins present similar characteristic peaks, as shown in Fig. 2.13–18 For example, phenylalanine shows two strong bands at 1600 and 1001 cm−1 attributed to a ring structure of in-plane ring stretching and symmetric ring stretching, respectively.16 Tryptophan, with a similar structure to phenylalanine, shows characteristic peaks not only very close to 1600 and 1001 cm−1 but also to 1354 cm−1 attributed to the separated nitro-group.14,15,17 Tyrosine, which has only one OH group different from phenylalanine at the ring structure, shows similar peak positions in part of the SERS spectrum with phenylalanine.18 Therefore, it is risky to identify a specific protein by only reading a single peak on the spectrum. It is better to simultaneously observing several strong peaks as the fingerprint peaks to recognize one target protein.1,18
FIG. 2.
The similar molecular structures on different proteins.
II. NANOSTRUCTURES FOR SERS
In this session, several nanostructures, starting from nanoparticle pairs, sharp nanostructures, nanoflowers, to nanomushrooms, will be introduced with low to high numbers of hot spot regions and compared with the SERS enhancement efficiencies.
A. Nanoparticle pairs
In a previous work, Jain et al.19 used E-beam lithography to fabricate gold (Au) nanodisc pairs to investigate the plasmon coupling effect at different gap distances. As the gap distance was reduced, the plasmon resonance induced strong red-shifts and plasmon coupling. This phenomenon can be qualitatively explained on the basis of a dipolar-coupling model. Etchegoin and Le Ru9 used electrostatic approximation and finite-element modeling to calculate the enhancement factor (EF) along the border nearing the gap (2 nm) between two gold colloids (radii = 30 nm). The enhancement was reduced by an order of magnitude over distances comparable to a few molecular dimensions (∼2–4 nm). In other words, reducing the gap distance provided hot spots with stronger EM field enhancement for higher SERS signals.
B. Sharp nanostructures
To improve the EM field effect, sharp nanostructures were also proposed to induce a locally strong electromagnetic field, such as nanorings,20 nanocups,21 and nanocrescent.22,23 Professor Luke P. Lee's group used sacrificial nanospheres and oblique electron-beam evaporation to form nanocrescent metal structures in a cross-sectional view, which induce the SERS effect at sharp tips, as shown in Fig. 3. In fabrication, nanocrescent structures were controlled by the size of sacrificial the nanosphere, the thickness of the deposited metal, and the inclination angle of metal deposition. After careful adjustment, nanocrescent can achieve sub-10 nm sharp edges, and the enhancement factor can be larger than 1010 in SERS tag Rhodamine 6G (R6G) detection.
FIG. 3.
Schematic of SERS enhancement by sharp nanostrutures.22 Adapted with permission from Liu et al., Nano Lett. 5, 119 (2005). Copyright 2005 American Chemical Society.
C. Nanoparticle arrays
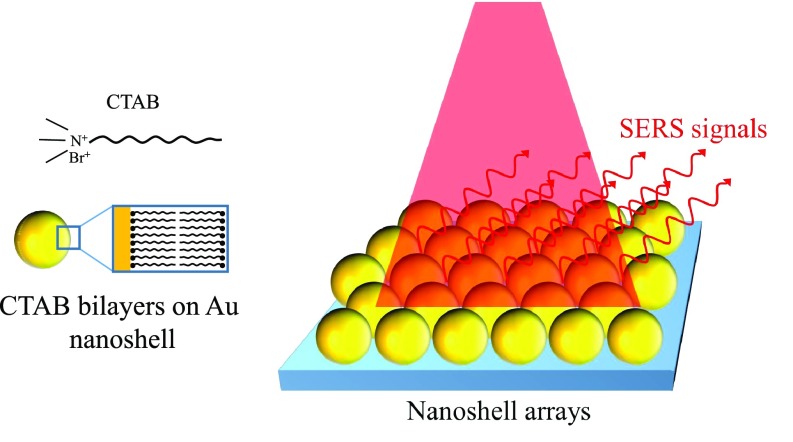
Even though precisely controlling the gap distance or sharp nanostructures can significantly enhance SERS for pairs of metal nanostructures, however, there is only a small area which could induce hot spot effects. For example, the area for contributing 108 enhancement occupied only 10−6 of the total surface area in a pair of 30-nm gold nanospheres; as a result, a final overall average EF is usually less than 100.9 In order to overcome this problem, numerous studies proposed the utilization of nanostructure arrays to further increase the hot spot areas on substrates.24–26 For example, nanoshells24 were fabricated by seed-mediated electroless plating with surface functionalization of cetyltrimethyl ammonium bromide (CTAB) and then suspended in solution. With a well-controlled particle concentration and ambient conditions to evaporate the solvent, hexagonally packed nanoshell arrays were formed with sub-10 nm gaps defined by CTAB bilayers on nanoshells, as shown in Fig. 4. The SERS signals of nanoshell arrays were tested by self-assembling para-mercaptoaniline (pMA) on Au nanoshell surfaces with a known packing density to replace CTAB. The EFs of pMA on the nanoshell arrays are on the order of 108–9, 10 to 20 times higher than what is achievable on isolated nanoshells.
FIG. 4.
Schematic of SERS enhancement by nanoparticle arrays.24 Adapted with permission from Wang et al., Angew. Chem., Int. Ed. 46, 9040 (2007). Copyright 2007 Wiley-VCH Verlag GmbH & Co. KGaA, Weinheim.
On the other hand, Masson et al.25 prepared nanospheres of different sizes in solutions and drop-coated them onto clean glass slides to form well-ordered monolayers. The nanosphere monolayers were etched in an oxygen plasma to reduce nanospheres into various diameters. Then, a metal thin film (Ag or Au) was deposited by sputter coating on the etched nanospheres. By controlling the nanosphere size and gap distance, this work discussed the relationship between the nanosphere gap (G) and diameter (D) ratio to SERS enhancement of the nanoparticle arrays. The strongest plasma coupling effect, about 4 folds, was obtained at a G/D ratio at about 0.218.
D. Nanoflowers, Nanostars, and Nanomushrooms
To further enhance the SERS effect other than the nanoparticle arrays with limited pairing regions, increasing hot spot regions on individual nanoparticles became a practical idea, for example, Au nanoflowers,27 Ag coated nest-like Zn networks,28 Ag nanoparticle decorated ZnO nanotapers,29 and Au coated nanomushrooms.30 These nanostructures not only generated plasma coupling on a plane as in an array but also induced more hot spot regions from the three-dimensional surfaces on individual nanoparticles. For nanoflowers, Xie et al. employed 4-(2-Hydroxyethyl) piperazine-1-ethanesulfonic acid (HEPES) as a weak capping agent to reduce Au ions (AuCl4−) into Au nanocrystals. Au nanoflowers were then synthesized by confining the crystal growth in the limited ligand protection regions. The narrow gaps among the fan-out nanoextrusions on each nanoflower induced a plasma coupling effect, and the SERS signal increased by about 7 folds, which is higher than that of 2D nanoparticle arrays.
The randomly distributed nanoextrusions on nanoflowers were further improved into more regular, directional, and longer finger type nanostructures on nanomushrooms by Hsieh et al.30 Nanomushrooms were fabricated by directional oxygen/argon plasma etching on top of noncarboxylated polystyrene beads, as shown in Fig. 5(a). It is suggested that carbonyl groups with high bond energy become nanomasks on polystyrene bead surfaces and provide high selectivity between carboxyl and polystyrene surfaces under a reactive ion etching process. Raman intensity enhancement on a 20-nm gold coated nanocorrugated polystyrene bead array is summarized by three factors: (1) the effect of plasmonic coupling among neighbouring particles, (2) the nanocorrugation-contributed roughness, and (3) the pitch size of nanocorrugations. Among these factors, the pitch size of nanocorrugations (ranging from ∼6 nm to ∼12 nm on the surface of polystyrene beads) dominates the SERS enhancement and the minimum pitch size of 6 nm provides the highest Raman intensity enhancement to more than 12 folds of the 2D nanoparticle arrays.30 This significant SERS signal amplification is attributed to the parallel finger-shape pitches, inducing “hot lines,” which provide more plasmonic coupling regions than that of nanoparticle pairs,19 nanoparticle arrays,25 and nanoflower particles27 with only “hot spots.” Attributed to the plasmonic coupling regions in the unit space of the different strategies of nanostructure arrangements, the SERS signal relation of nanoparticle pairs, nanoparticles arrays, nanoflower particles, and nanomushrooms are 1 fold, 4 folds, 7 folds, and 12 folds, respectively, as shown in Fig. 5(b).
FIG. 5.
Particles with 3D nanostructures for SERS enhancement: (a) mechanism and structures of nanomushrooms for SERS enhancement and (b) schematics of SERS enhancement by different strategies of nanostructure arrangements.19,25,27,30
E. light-to-heat conversion
Despite the increase, the hot spot area can obtain more signal intensity from the SERS spectrum. Considering that some biospecimen will denature when temperature is over 45 °C,31 there are still limitations in biodetection from light-to-heat conversion.32–35 This phenomenon is attributed to the oscillating electron transfer of their kinetic energy into the particle lattice through electron−phonon interactions. Richardson et al.33 set up an experiment by hanging up a droplet containing gold nanoparticles (7 × 10¹⁰ particles/cm3 solution of 20 nm colloidal gold nanoparticles) illuminated by different intensities of incident continuous wave laser light (532 nm) and then measured the temperature changes. After 60 s excitation, the intensities of the laser of 0.28, 0.23, and 0.14 W gave a saturation temperature at 25, 24, and 21 °C, respectively (from 18 °C). In addition, Mendes et al.35 used 14 nm gold nanoparticles to be co-incubated with MCF-7 cells to control the environment of photothermal therapy. In this work, they demonstrated that the temperature can be controlled by light-to-heat conversion with ΔT 12 °C under a laser potency of 3.44 W cm−2 for 60 s. Therefore, we need to consider the heating effect from incident laser light to avoid temperature increasing too high for biospecimen.
III. EC-SERS
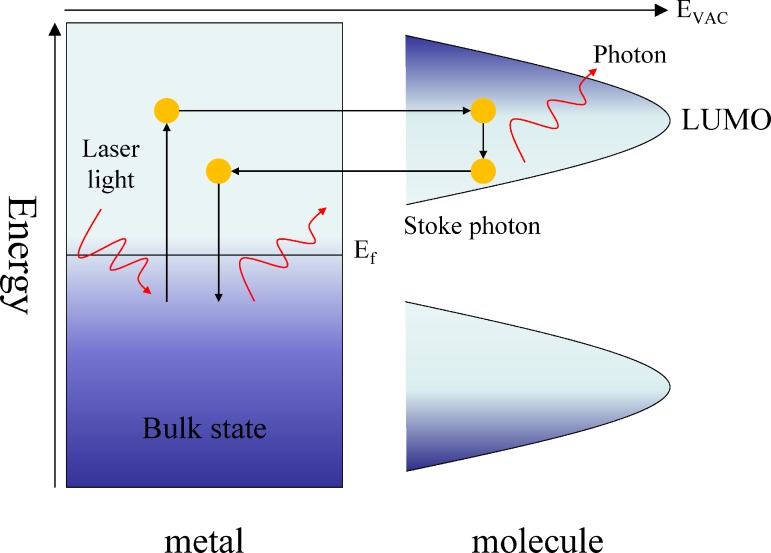
Electrochemical surface-enhanced Raman spectroscopy generally employed electrochemical current to enhance charge transfer between adsorbates and substrates.1,10,36,37 As shown in Fig. 6, when the incident photons are absorbed by the metal, the electrons are excited from the bulk-state to the hot electron state. These hot electrons transferred into the lowest unoccupied molecular orbital (LUMO) of the molecule. The Stokes photons are created during the period of hot electrons transferred from LUMO back to the metal and return to the bulk-state. For example, Karaballi et al.37 developed a EC-SERS deoxyribose nuclear acid (DNA)-aptasensor which was capable of direct detection of tuberculosis (TB) DNA. Screen printed electrodes (SPEs) modified with silver nanoparticles were used as the aptasensor platform. It is apparent that the adenine signal increased by 10 folds between open circuit potential (OCP) and −0.8 V.
FIG. 6.
Schematic of the photon-driven EC-SERS system.10 Adapted with permission from Wu et al., Chem. Soc. Rev. 37, 1025 (2008). Copyright 2008 Royal Society of Chemistry.
IV. MAXIMIZING SERS SIGNAL BY OPTIMIZING THE TARGET-SENSOR SPATIAL RELATIONSHIP
For protein detection, in addition to the SERS nanostructure arrangement, it is also of the same importance to bring protein molecules into the vicinity of the hot spot region for obtaining the highest possible signals since SERS is a distance-dependent phenomenon. Kumari et al.38 used silica coating on silver nanoparticles to vary the distances between R6G molecules and the silver nanoparticle surfaces for studying the optimized target-sensor distance for SERS. As in their results, the SERS phenomenon can still be induced when a distance of 1 nm was arranged for 20 nm silver nanoparticles, and the signal is compatible to a 5 nm distance in the case of 90 nm nanoparticles. In other words, larger nanoparticles allow a longer distance to induced decent SERS. Nevertheless, analytes would still need to be within less than 10 nm distance to nanostructures so that Raman scattering can be amplified.
On the other hand, incident laser spot size also affects SERS detection. In micro-Raman Microscopy systems, the typical diameter of laser spots is smaller than 5 μm. If we want to obtain a stronger SERS signal, the objective magnification needs to be further increased so that the spot size is decreased. However, this small irradiation area must include enough proteins falling into the “hot spot” regions to maximize the signal. Therefore, how to accumulate more analytes into the sensing regions and maintain close enough distance of the protein molecules to the hot spot regions become two important considerations for SERS detection. Following this, we will elaborate on several techniques which can meet the above two considerations for the molecule concentration in the detection area and entering the hot spot regions of SERS nanostructures.
A. Protein-SERS particle aggregation by immuno-methods
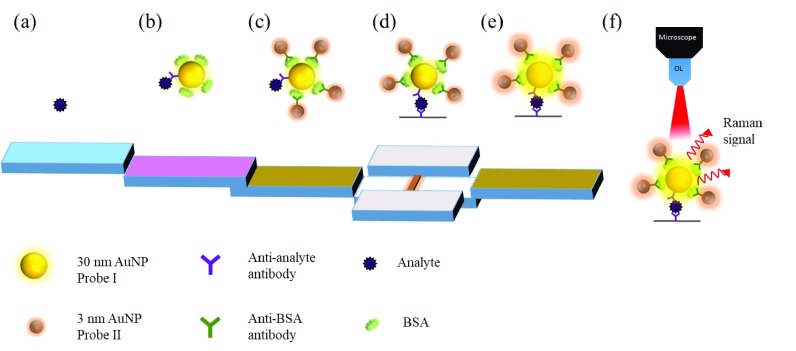
The immuno-way for protein-sensor conjugation is one of the most widely used approaches to enhance SERS detection for trace proteins. Due to the specificity and size of antibodies (∼5–10 nm), it helps proteins stay closer to the hot spot regions of nanostructures by immuno-conjugation to the antibody modified sensor surface39–41 For example, Il-Hoon et al. integrated a widely used lateral-flow immunochromatography (LF-ICA) system for trace analyte detection. This system employed the antigen and antibody immuno-recognition technique to form multi-gold nanoparticle (AuNP) aggregates for enhancing the SERS signal from traditional LF-ICA that employs only one gold nanoparticle (AuNP) as a tracer. As shown in Fig. 7, the analytes were first linked onto one 30-nm AuNP modified with bovine serum albumin (BSA) and anti-analyte antibodies, and then, anti-BSA antibody modified 3-nm AuNPs were aggregated onto the 30-nm AuNP, and thus, the SERS signal can be much enhanced by 3 order of magnitudes (detection limit improved from 8 μg/ml to 8.5 ng/ml) because more hot spots were generated from the multi-AuNP aggregation and analytes were brought closer to the hot spots by the immuno-conjugation. This AuNP aggregation process was performed very rapidly in 20–25 min by the immunoreaction process.
FIG. 7.
Schematic of the Lateral-Flow Immuno-Chromatography (LF-ICA) system for trace analyte detection.39 Adapted with permission from Cho et al., Sens. Actuators, B 213, 209 (2015). Copyright 2015 Elsevier B.V. All rights reserved.
Although immuno-aggregation by antibody/antigen pairs provided good performance in enhancing the SERS signal, however, the size of antibody/antigen pairs is about 10–15 nm and might exceed the preferred distance of less than 5 nm for SERS. On the other hand, the recognition efficiency of antibodies to the related antigens is usually less than 60%. As a result, aptamers with much smaller molecule size (2–5 nm) and somehow a relatively high antigen binding efficiency (∼80%–90%) were proposed to replace the antibody for immuno-aggregation.42–44
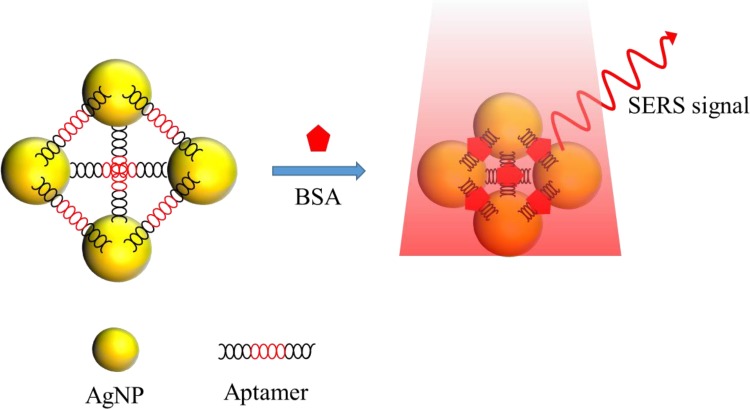
Aptamers are made of ribonucleic acids (RNAs) or deoxyribose nuclear acids (DNAs) consisting of oligonucleotides with a size usually smaller than 5 nm.45 The bonding with a target can result in high specificity and affinity according to the precise 3D conformation design.46 In addition, aptamers also consist of several superior properties compared to antibodies, such as high structure stability against the temperature variation47 and low antigenicity in human bodies.48 As a result, there have been extensive works employing aptamers to capture proteins for SERS detection.45,49–55 For example, Xu et al. used a specific aptamer to incorporate with AgNPs for self-assembling into nanopyramid structures with 8 nm gaps and the aggregates were detected by a modified Raman reporter for AgNPs, as shown in Fig. 8. When the prostate specific antigen (PSA), thrombin, and mucin-1 were captured by the aptamers, the gap among Ag NPs would decrease from 8 to 2 nm and the Raman signal was enhanced by 25 folds.50 The linear range and detection limit of the sensor were 0.08–10 aM and 0.039 aM, respectively. When all three aptamers were added together to form pyramids, the limits of detection (LODs) were 0.96 aM, 85 aM, and 9.2 aM with detection ranges of 1–500 aM, 0.1–50 fM, and 0.01–5 fM for PSA, thrombin, and mucin-1, respectively.
FIG. 8.
Schematic of the nanopyramid structure by the self-assembly of aptamers and AgNPs for trace protein detection.50 Adapted with permission from Xu et al., Adv. Mater. 27, 1706 (2015). Copyright 2015 Wiley-VCH Verlag GmbH & Co. KGaA, Weinheim.
B. Magnetism assisted SERS detection
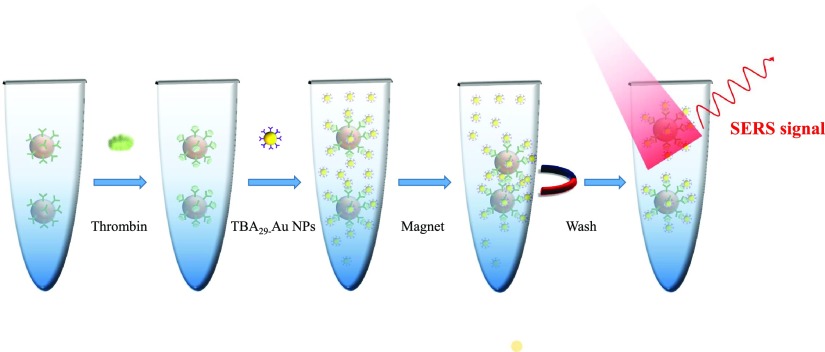
In addition to biochemical ways for target molecule aggregation, physical ways are also very useful to not only aggregate molecules but also help on positioning them into the detection region, such as magnetic manipulation. Most of the works linked proteins and SERS tags on magnetic nanoparticles by aptamers or antibodies and then captured the well hybridized nanoparticles with a magnet.56–62 Yoon et al. fabricated 1 μm magnetic beads functionalized with 15-merthrombin-binding aptamers (TBA15) to be a substrate and 40 nm gold nanoparticles (AuNPs) modified with the 29-mer thrombin-binding aptamer (TBA29) and Raman molecule X-rhodamine-5-(and-6)-isothiocyanate (XRITCs) to be a SERS probe. Mixing magnetic beads and AuNPs formed sandwiched aptamer complexes by thrombin. Figure 9 shows the sequential steps of this system. At first, thrombin antigen solution was added to TBA15-conjugated magnetic beads. After 30 min incubation, TBA29-conjugated AuNPs (labeled with XRITC) were added and reacted for 1 h to form sandwiched aptamer complexes. Finally, after applying a magnetic bar to the wall of the microtube and washing the magnetic beads twice with PBS, the LOD of thrombin, determined by a magnetic assisted aptasensor, was estimated to be 0.27 pM.
FIG. 9.
Schematic of magnetism assisted SERS detection for trace proteins.56 Adapted with permission from Yoon et al., Biosens. Bioelectron. 47, 62 (2013). Copyright 2013 Elsevier B.V. All rights reserved.
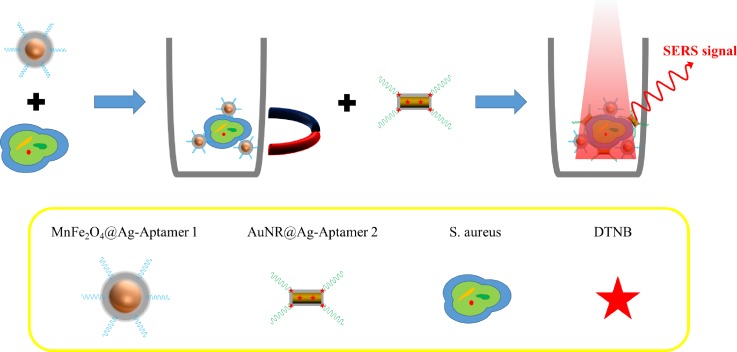
Magnetism assisted SERS detection was also applied to cell sensing. Wang et al. developed a biosensor consisting of two elements including Ag-coated magnetic nanoparticles (AgMNPs) to be a SERS substrate and AuNR–DTNB@Ag–DTNB core–shell plasmonic NPs (DTNB-labeled inside-and-outside plasmonic NPs, DioPNPs) to be a SERS tag, as shown in Fig. 10. This SERS biosensor was based on a sandwich structure formed by aptamer/target/aptamer interactions. First, modified aptamer-1 on AgMNPs was incubated with Staphylococcus aureus, and then, the bacteria–AgMNPs were washed under magnetic confinement to remove free bacteria. Second, modified aptamer-2 on DioPNPs was added to bind different sites on S. aureus. This operation sequence formed DioPNP/S. aureus/AgMNP sandwich structures. After washing with PBST (phosphate buffered saline with Tween 20) under magnetic confinement to remove the free DioPNPs and drying in air, the limit of detection (LOD) was obtained 10 cells/ml.
FIG. 10.
Schematic of magnetism assisted SERS detection for bacteria by AuNR–DTNB@Ag–DTNB core–shell plasmonic NPs.59 Adapted with permission from Wang et al., ACS Appl. Mater. Interfaces 7, 20919 (2015). Copyright 2015 American Chemical Society.
C. Single protein molecule detection by tip-enhanced Raman spectroscopy (TERS)
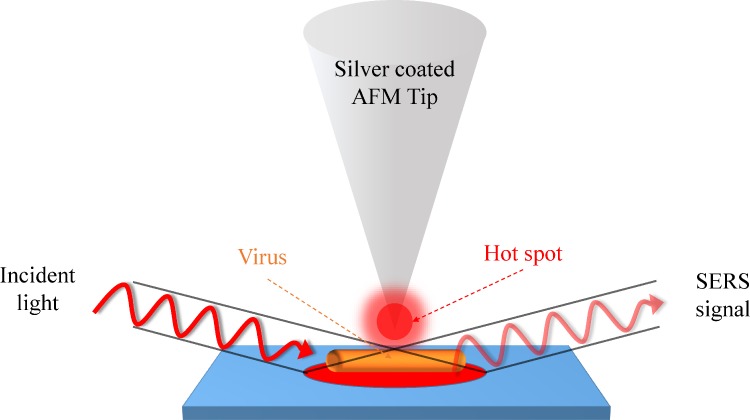
The RS detection limit for protein molecules can be lowered down to a single molecule level by Tip-enhanced Raman spectroscopy (TERS). TERS requires a pair of plasmonically active metal (usually be Au or Ag) electrodes with one located on a scanned probe microscope (SPM) tip and the other on a plan substrate, respectively. The movable scanning probe from either atomic force microscopy (AFM) or scanning tunneling microscopy (STM) can precisely locate a single molecule and perform TERS detection.63–65 For example, Cialla et al.65 used non-contact-mode silicon cantilever AFM tips (NSG10, resonant frequency: 190–325 Hz, NT-MDT) coated with 20-nm thick silver by thermal evaporation to form a SERS-active area, which provided a spatial resolution less than 50 nm, as shown in Fig. 11. In TERS detection, the silver-coated AFM tip directly contacts with a tobacco mosaic virus (TMV, 300 nm in length and 20 nm in diameter) at four different positions to recognize its coat protein or capsid. In this design, the TERS enhancement factor reached 106 and showed different intensities and band positions at different membrane positions.
FIG. 11.
Schematic of TERS detection on the coat proteins of a tobacco mosaic virus.65 Adapted with permission from Cialla et al., J. Raman Spectrosc. 40, 240 (2009). Copyright 2008 John Wiley & Sons, Ltd.
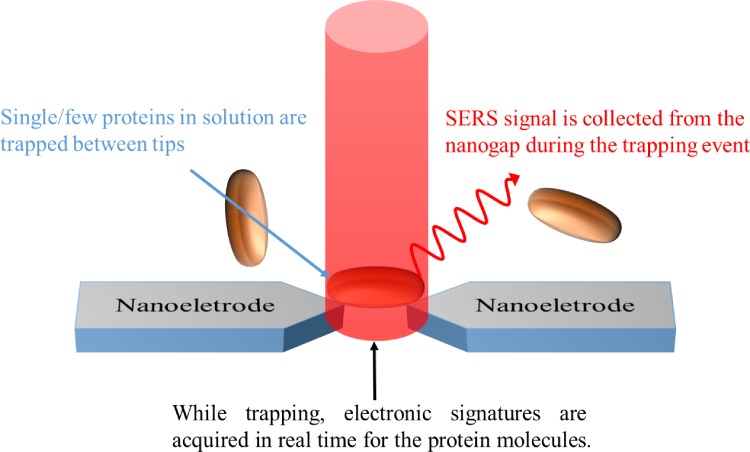
Although TERS provides a very high RS signal enhancement in detection, we still need to spend a lot of time on searching molecules by a probe. Therefore, Lesser-Rojas et al. fabricated arrays of titanium electrode pairs with sub-10 nm tip gap for alternating current dielectrophoresis (DEP)-based molecular trapping,66 as shown in Fig. 12. DEP is an electrokinetic effect that can be employed to attract and separate polarizable dielectric particles in aqueous media, depending on the dielectric response of the particle in the presence of a nonuniform electric field.67 During the system operation, sub-10 nm gap of the metal tips provided not only a nonuniform electric field to carry out DEP for protein trapping but also induced a SERS signal of proteins near the tips. R-phycoerythrin (RPE), a 240 kDa disk-shaped protein with a diameter of 11 nm and a thickness of 6 nm derived from red algae as the target protein, was detected in this system with a LOD of 0.12 nM.
FIG. 12.
Schematic of TERS detection of proteins based on pairs of nanoelectrodes.66 Adapted with permission from Lesser-Rojas et al., Nano Lett. 14, 2242 (2014). Copyright 2014 American Chemical Society.
V. INTEGRATION OF SERS SENSORS INTO BIOMICROFLUIDIC SYSTEMS
Typical research in SERS was focusing on fabricating structures, providing large Raman amplification or capturing the target to the hot spot region by physical and chemical methods. Many of these novel SERS sensors for trace protein detection still primarily rely on the immune-binding between the low-concentration target and the antibody. However, those processes were usually confronting the issues of diffusion limitations, low volume concentrations, and small dynamic ranges. Thus, for trace protein detection, SERS sensors usually required a long waiting time and sometimes obtained unpredictable detection results. All of these stem from the random distribution of protein molecules in a solution with low incident frequency to the detection area. On the other hand, to align the incident light beam (usually smaller than 5 μm in diameter) onto the micro/nano scale SERS sensor region is even more challenging. To overcome the aforementioned problems, SERS systems integrated into microfluidic systems are imperative for helping on SERS sensor registration, protein molecule concentration, and process multiplex in sample preparation and detection. Microfluidic devices have been widely and successfully applied in diagnostic systems for manipulating solutions, mixing/separating biological specimens or nanoparticles, and interfacing optical or electronic parts.68–78 Through this concept, SERS integrated biomicrofluidic systems can fully fulfill the needs of SERS sensor registration, molecule concentration, and process multiplex.
A. SERS sensor registration
The simplest way to overcome the nanostructure registration issue is to allow a large laser illumination area to cover most of the RS detection area.79,80 For example, Sivanesan et al. deposited gold nanostructures (AuNSs) on a gold nanosubstrate (pAu/AuNS). An aptamer possessing affinity to recombinant human EPO (rHuEPO) was modified on the nanostructures (pAu/AuNS/Apt) to form a large area aptasensor. SERS spectra of rHuEPO, which was originally spiked into neat horse plasma with a concentration ranging from 10 nM to 10 pM, were dropped on the pAu/AuNS/Apt/rHuEPO surfaces for label free detection in a region of 8 mm in diameter. In this large area of the aptasensor, for obtaining a SERS signal, a relative low standard deviation (RSD) of 4.92% was achieved. However, this method required a large amount of analytes on a more uniformly prepared detection surface for obtaining better statistic results.
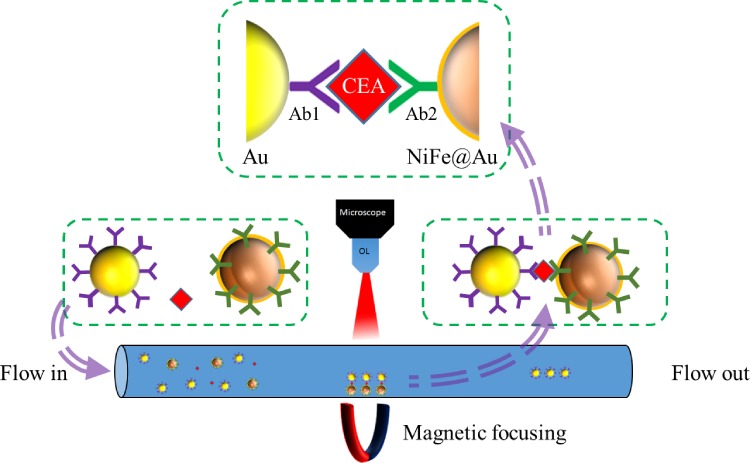
On the other hand, if the detection area is intrinsically small or array type detection is employed, enlargement of the sensing area may not be a suitable way for system implementation. As a result, it becomes important to confine or register target molecules into the pre-designed sensing region. In the past decade, various microfluidic schemes72,74 have been developed to confine the target molecules into a very accurate micro- or nanodomain, which will be highly beneficial for SERS detection in micro/nanoscale. Those micro/nanofluidic systems employed either nanotubes,81 nanocrowns,82,83 nanorods,84–86 nanoslits,87 or nanoparticles,88 inside a micro- or nano-confined chamber or a channel for molecule registration. After the registration process, SERS detection systems can perform the detection directly in the designated region to eliminate the time for searching molecules. For example, Li et al.89 fabricated a tunable magnetic nickel–iron core and gold shell (NiFe@Au) nanoparticle to be a SERS nanoprobe with a size ranging from 11 nm to 60 nm. The NiFe@Au NPs flew via a microfluidic channel and combined with 30 nm Au gold particles conjugated by a cancer biomarker, carcinoembryonic antigen (CEA). After that, the sandwiched structures (NiFe@Au/CEA/Au) were magnetically focused on a specific spot in a microfluidic channel to form the hot spot region for SERS detection, and the LOD of CEA detection approached 0.1 pM, as shown in Fig. 13.
FIG. 13.
Schematic of employment of the NiFe@Au nanoparticle to be focused by a magnetic field for CEA antigen detection by SERS.89 Adapted with permission from Li et al., Anal. Chem. 87, 10698 (2015). Copyright 2015 American Chemical Society.
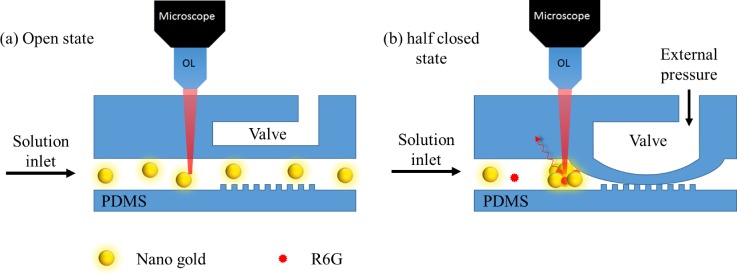
The addition of magnetic force is certainly an effective way in registration but cannot be generally applied to nonmagnetic particles. Therefore, the employment of a microvalve and pump was proposed to overcome this problem.90 Zhou et al.88 fabricated a polydimethylsiloxane (PDMS) microfluidic chip consisting of pneumatic valves and nanopost arrays to trap gold nanoparticles to form a SERS active area for BSA detection as shown in Fig. 14. The valve channels (∼40 μm high and ∼200 μm wide) allow gold nanoparticles (250 nm) to pass through at a valve open state. During pneumatic valve working at a half closed state (∼20 psi), the PDMS membrane contacted with nanopost (∼700 nm height and ∼5 μm diameter) and formed nanochannels. Since gold nanoparticles are larger than nanochannels, the nanoparticles were trapped at the entrance and formed a SERS active area, while the buffer was still passing through the microvalve. In this design, the detection limit of the BSA SERS signal can reach as low as the picomolar level.
FIG. 14.
Schematics of trapping and releasing of gold nanoparticles using a modified pneumatic microvalve for SERS detection.88 Adapted with permission from Zhou et al., Bioanal. Chem. 402, 1601 (2012). Copyright 2011 Springer Nature.
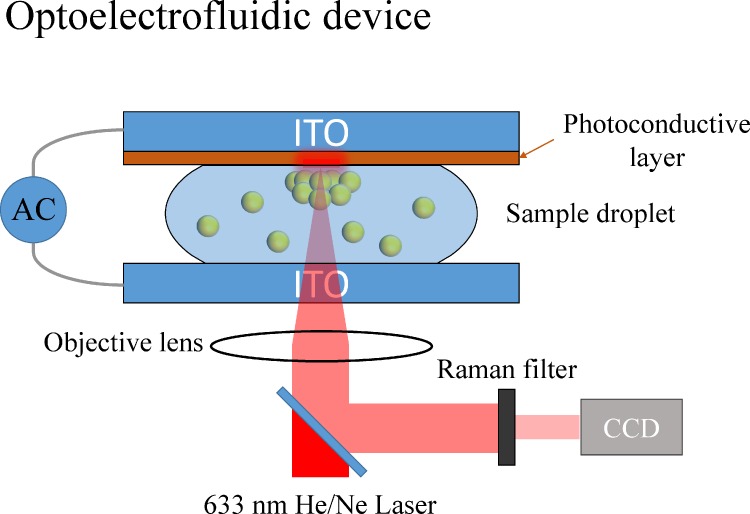
On the other hand, the control of the electric field can also be employed to confine the locations of particles for SERS detection. For example, optoelectrofluidics, based on electrokinetic motions of particles or fluids under an light induced unsymmetrical electric field,91 can be utilized to concentrate particles into defined reaction areas for SERS detection.92,93 Hwang et al. fabricated an optoelectrofluidic SERS platform consisting of two indium tin oxide (ITO) electrodes inside a 30-μm height liquid chamber with one electrode deposited by a photoconductive layer, as shown in Fig. 15. When an AC voltage and a laser were applied on the ITO electrodes and photoconductive layer, respectively, the nonuniform electric field generated in the liquid chamber induced an ac electroosmosis (ACEO)/electrothermal flows and dielectrophoresis force to simultaneously trap gold nanoparticles and R6G dyes into a SERS active area at the laser spot. In this design, the in-situ measurement of SERS was demonstrated with a significant increase with the SERS intensity of adenine from no signal in 10 mM to clearly observed in 250 μM.
FIG. 15.
Schematic diagram of an optoelectrofluidic device for SERS spectroscopy.92 Adapted with permission from Hwang et al., Lab Chip 11, 2518 (2011). Copyright 2011 Royal Society of Chemistry.
B. Molecule concentration/accumulation
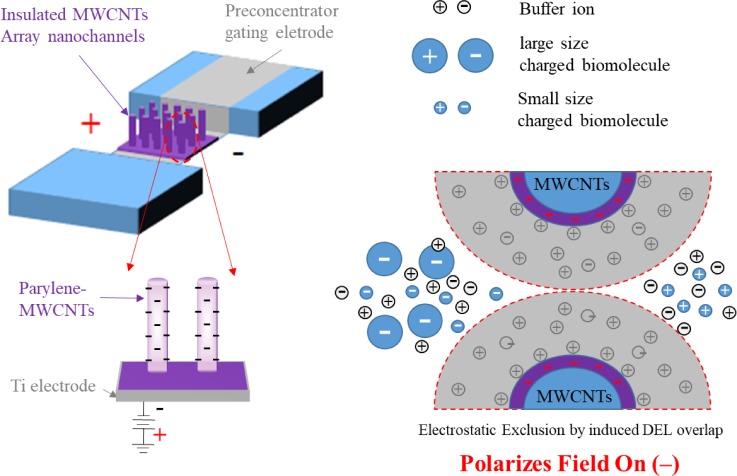
For trace protein detection, the low concentration is another important issue in SERS detection, and it poses a long detection time with unpredictable results. In the previous sessions, we have introduced the ways to locally improve the target molecule concentration by using the immuno-method. However, in a much larger volume, it is not easy to aggregate most of the molecules into a specific spot for SERS detection by immune reaction which is highly depending on diffusion. Yet, microfluidic systems can provide very efficient ways for molecule concentration/accumulation through hydrodynamic and electrodynamic manipulation of solution and molecules, such as dielectrophoresis, electro-osmosis, and AC electro-osmosis.66,68–70,94–102 In the work of Wu et al.,69 a charge-selective and pre-concentrating device (Fig. 16) was proposed to eliminate the requirement for special buffer conditions to obtain high-performance molecular concentrations by the nano-electrostatic sieving (NES) effect.69 The NES device consists of an insulating layer-coated multiwall carbon nanotube (MWCNT) array for not only the electrostatic gating of charged molecules but also the sieving of different-size molecules. In the NES device, the electrical double layers (EDLs) generated near the surfaces of the insulating layer-coated MWCNT array can overlap with one another to allow the electrokinetic exclusion of molecules with a specific polarity. The NES device exhibits polarity selectivity for the analytes and performs efficient collection and separation of biomolecules by probing the surface charge density dependency on the applied gate field. A tunable gate of parylene-MWCNT nanochannels that were used as size-sieving devices for nanoscale biomolecules achieved a remarkable concentration of 105-fold and 106-fold in only 15 and 45 min, respectively. This MWCNT-NES device is proposed for protein pre-concentration and separation, and it would be a useful component in a fully integrated microanalytical system for highly sensitive biosensing.
FIG. 16.
Protein concentration and selection by nanoelectrostatic sieving (NES) through insulating a layer-coated MWCNT array. Redrawn after Ref. 69. Adapted with permission from Wu et al., Biosens. Bioelectron. 43, 453 (2013). Copyright 2012 Elsevier B.V. All rights reserved.
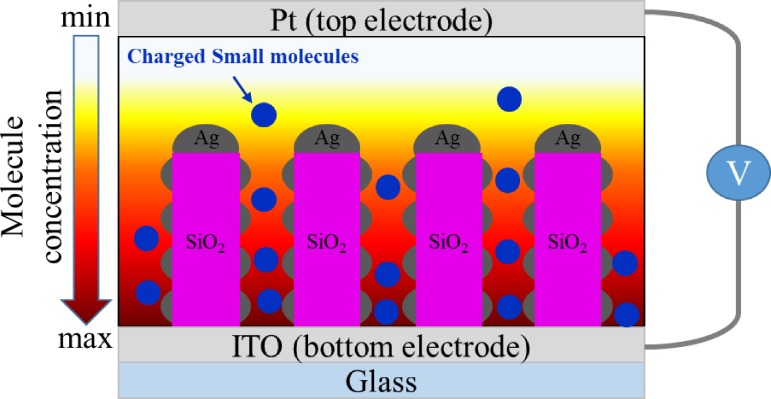
Park et al. designed an electrokinetic preconcentration SERS device which has two elements. They employed glass nanopillar arrays (GNAs) with silver nanoislands coated on an ITO substrate as one electrode to be the SERS enhancing area, and the density of the nanogaps among silver nanoislands was 2000 within 1 μm2, greatly enhancing the sensing hot spot areas, as shown in Fig. 17. The other electrode is a PDMS chamber with a platinum wire located on the top of the chamber. The electrokinetic preconcentration is under a constant direct current (DC) electric field of 200 mV mm−1 between two electrodes, and the molecule concentration increased with time. Experimental results demonstrated that the SERS enhancement effect was 5.3 × 10⁷ with a variation of 7.8% and saturation in 30 min for detecting R6G and Serotonin at 1 pM and 100 nM, respectively. This preconcentration enables the extraordinary enhancement of SERS signals to up to two orders of magnitude for label-free fingerprint detection of serotonin at the nanomolar level and the selective detection of charged small molecules. Cheng et al.101 proposed a 3D hybrid AC electrokinetic scheme consisting of AC dielectrophoresis (DEP) and biased AC electroosmosis (ACEO) which provided a long range ACEO to allow effective transport of a high number of targets into the centre of the detection zone. In this design, they can directly separate bacteria from diluted blood and increase the local purity at least 6 orders (from 0.05% to greater than 99.9%) of magnitude.
FIG. 17.
Schematic of the protein electrokinetic preconcentration on silver island coated nanopillar arrays (GNA) for SERS detection.70 Adapted with permission from Park et al., Small 11, 2487 (2015). Copyright 2015 Wiley-VCH Verlag GmbH & Co. KGaA, Weinheim.
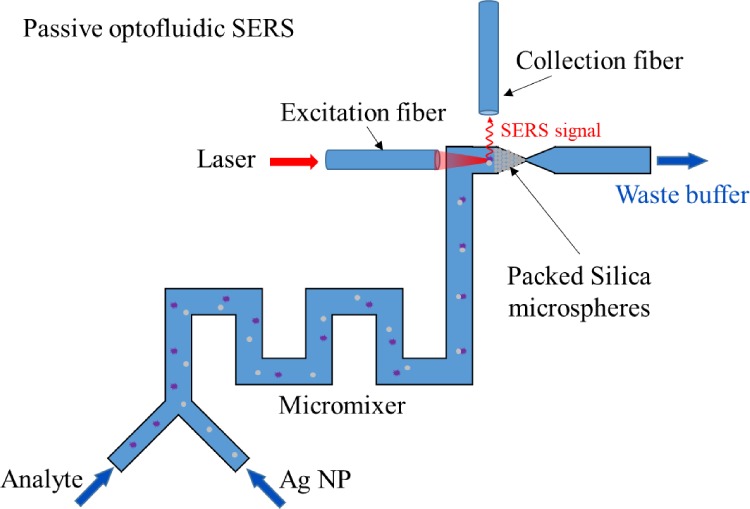
Not only the aforementioned active microfluidic systems can increase SERS detection efficiency but also passive microfluidics can help accumulate nanoparticles and analytes to increase the SERS signal intensity. For example, Yazdi et al.103,104 fabricated a passive optofluidic SERS microsystem consisting of a zigzag-shaped passive micromixer which mixed Ag nanoparticles with analytes and a detection area formed by packed silica microspheres at downstream which concentrated mixed nanoparticles and measured the SERS signal by two optical fibers, as shown in Fig. 18. In this design, the limits of detection of melamine and fungicide thiram are 63 ppb and 50 ppt, respectively.
FIG. 18.
Schematic of a passive optofluidic SERS microsystem.103 Adapted with permission from Yazdi and White, Anal. Chem. 84, 7992 (2012). Copyright 2012, American Chemical Society.
C. Process automation and multiplex
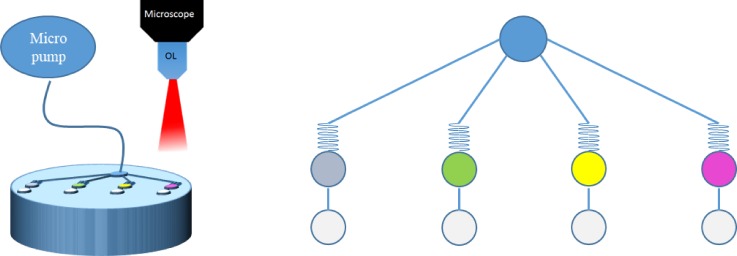
In addition to solving the major problems in SERS sensor registration and molecule concentration, process multiplex is an exciting new advantage/opportunity in SERS detection when integrated into biomicrofluidic systems. Before SERS detection, most of the time was consumed in sample preparation processes manually, such as mixing of the reagent and specimen or separating analytes into different solutions. On the other hand, multiplexing can significantly reduce the time consumption in parallel SERS detection systems.105,106 For example, Nguyen et al. proposed a sandwich SERS immunosensor integrated with microfluidic systems. In this work, IgG and Fab fragments conjugated onto a gold nanostar were used to prepare two different immunosensors for comparing SERS signals. Using antigens (CA125, HER2, HE4, and Eotaxin-1) and Rhodamine-6G(R6G)-conjugated immunogolds, a sandwich SERS immunosensor (gold nanostar/antigen/R6G-conjugated immunogolds) was self-assembled. Due to that the length of IgG is longer than that of Fab fragments, the SERS signal from the Fab immunosensor was 2.4 times higher than that of the IgG immunosensor. Furthermore, the immunosensor was prepared by silver deposition to fill in the cavities of nanostars to increase “hot spots” that IgG and Fab immunosensors would obtain 2.1 and 1.4 times signal enhancement, respectively. As Fig. 19 shows, the platform designed four different condition chambers for multiplex detection of four breast cancer biomarkers from patient-mimicked serum with CA125, HER2, HE4, and Eotaxin-1, and the LODs are 15 fM, 17 fM, 21 fM, and 6.5 fM, respectively.
FIG. 19.
Schematic of a microfluidic system for multiplexing and in-parallel SERS detection on cancer biomarkers. Redrawn after Ref. 105. Adapted with permission from Nguyen et al., Biosens. Bioelectron. 70, 358 (2015). Copyright 2015 Elsevier B.V. All rights reserved.
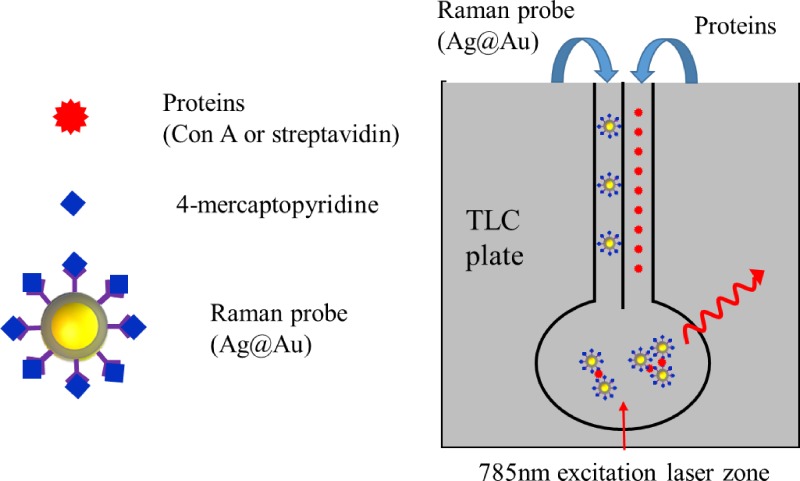
In order to simplify complex fabrication and fluidic manipulation processes, researchers also developed paper-based microfluidic systems for SERS detction.107–110 For example, Saha et al. proposed a microfluidic device using a silica gel-based thin layer chromatography (TLC) plate and functionalized silver coated gold nanoparticles (Ag@Au nanoparticle, ∼25–30 nm) as a plasmonic platform for protein analysis. As Fig. 20 shows, the TLC plate provides solid support for device fabrication and micrometer-sized pores or channels inside silica to provide a fluid pathway. Ag@Au nanoparticles were functionalized with 4-mercaptopyridine and glucose (or biotin) where 4-mercaptopyridine acted as a SERS tag and glucose (or biotin) interacted with Con A (or streptavidin). Protein solution and Ag@Au nanoparticles were separately introduced into different channels and aggregated inside the reaction area. Then, the SERS signal of 4-mercaptopyridine was used for protein detection by a benchtop Raman spectrometer, and the LOD of Con A and streptavidin reached 1 fM and 10 fM, respectively.
FIG. 20.
Schematic of a paper based SERS detection system for protein analysis. Redrawn after Ref. 107. Adapted with permission from Saha and Jana, ACS Appl. Mater. Interfaces 7, 996 (2015). Copyright 2015 American Chemical Society.
D. Stability and repeatability
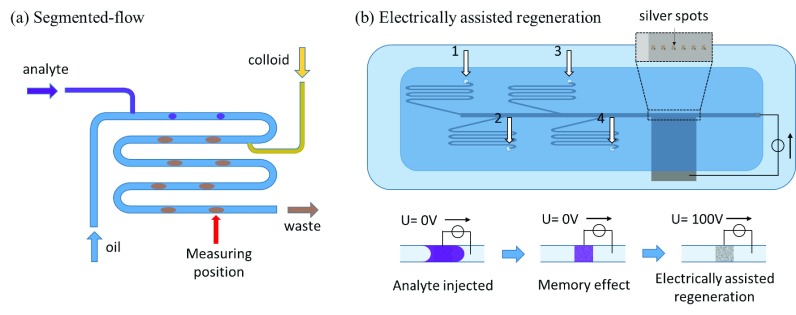
The stability and repeatability of SERS measurements in microfluidic systems may be much interfered by the materials or device surfaces which highly interact with the targeting molecules or SERS dyes.111 For example, the memory effect which is related to the adsorption of analytes on hot spot areas or microchannel walls interferes the measurement during the injection of analytes into biomicrofluidic systems.111,112 To reduce this phenomenon, oil based segmented-flow devices were proposed to be integrated in SERS detection systems.112,113 Strehle et al.112 fabricated an oil base segmented-flow system with three inlets which are lipophilic tetradecane (oil), crystal violet(aqueous), and 530 nm gold colloid (aqueous), respectively, as shown in Fig. 21(a). After the operation, crystal violet and gold colloid-containing segments are generated, and the SERS signal was measured in the downstream, interrupted by the tetradecane. In this design, the tetradecane avoid crystal violet adsorbed on the microchannel walls to reduce the memory effect, which led to a small fluctuation (∼4.9%) of the SERS signal in each droplet. However, oil based segmented-flow only rescued suspending nanocolloids in biomicrofluidic SERS systems. Those fabricated nanostructures in microchannels still encountered nonspecific adsorption of analytes. As shown in Fig. 21(b), Meier et al.111 proposed a fast electrically assisted regeneration SERS microfluidic chip which consisted of a bottom ITO glass electrode coated with silver nanospots at the SERS measurement area, a PDMS microchannel, and a covered ITO glass electrode. The microfluidic design consisted of four inlets, including phosphate buffer solution for flushing, crystal violet, brilliant green, and malachite green for modeling analyte solutions. While analyte solutions approached the detection area, the SERS signal was indeed strong but did not disappear after analyte solutions removed from the detection area. Even rinsing with buffer solution, the signal intensity was decreased for only −0.11%, −0.25%, and −0.16% per second, with brilliant green, malachite green, and crystal violet, respectively. If the applied electrical potential of 100 V to the SERS substrate to promote analyte desorption that the signal intensity half-life decreased to 23.2 s, 13.4 s, and 4.6 s, respectively. Both segmented-flow and electrically assist regeneration can avoid/decrease the memory effect in SERS detection to increase stability and repeatability.
FIG. 21.
Schematic of (a) the segmented-flow SERS system.112 Adapted with permission from Strehle et al., Anal. Chem. 79, 1542 (2007). Copyright 2007 American Chemical Society (b) electrically assisted regeneration.111 Adapted with permission from Meier et al., Lab Chip 15, 2923 (2015). Copyright 2015 The Royal Society of Chemistry (RSC).
VI. FUTURE TRENDS
In this paper, we have reviewed both physical and chemical methods to assist SERS detection when integrated into biomicrofluidic systems for trace protein analysis. Future trends will elaborate more on three aspects: exploring the possibility in self-registration and size reduction of the SERS sensor systems, obtaining higher detection sensitivity, and multiplexing a large array of detection regions (or image) instead of the current several detection points.
In self-registration and size reduction, one of the possible ways is employing optofluidic systems114–120 which can integrate microfluidic systems with micro-optic components to ensure more accurate laser light incident in the predetermined detection region, and the signals can be more completely accumulated for better detection. In optofluidic systems, optical fibers will replace the microscope to not only reduce system size but also bring the laser light closer to the detection region to enhance efficiency.121,122
On further increasing the SERS detection sensitivity, microfluidic systems will play a more important role not only in mixing and concentrating/accumulating protein molecules but also in purifying, sorting, and separating proteins before detection, which can further reduce the background for improving sensitivity. On the other hand, to enhance signals, further increasing the hot spot area by nanoengineering nanostructures into more regularly distributed hot regions is still on-going work in many different groups.123–125 Therefore, by the combination of signal enhancement and background reduction, the signal to noise (SN) ratio can be really improved to allow SERS sensors applied in a more complex environment.
In the multiplex of SERS detection, the current systems are still heavily relying on microscope based systems, which are not only cumbersome in size but also very difficult to be used in parallel detection for array format analytes. As a result, optical fiber arrays integrated with micro-optic component arrays in microfluidic systems may provide a more integrated solution115,119,120 for large array multiplexed SERS detection. Each of the detection regions would configure a pair of optical fibers and related micro-optics which include excitation and collection. In this design, the detectable analyte numbers per unit time will be significantly increased by adding optical fiber pairs. In addition, as the system improved further, the trace proteins on the cell membrane surface can also be “mapped” as an image, which can provide invaluable information to biological research, disease diagnosis, and human physiological condition monitoring. The integration of SERS detection with biomicrofluidic systems really can open up many new opportunities in future biomedical research and applications.
ACKNOWLEDGMENTS
We would like to thank the financial support from MOST, Taiwan, by the projects 105-2221-E-007-072-MY3 and 105-2321-B-007-003 and Excellent University Center for Biomedical Technology, NTHU, 2013–2016.
References
- 1. Kneipp K., Kneipp H., Itzkan I., Dasari R. R., and Feld M. S., J. Phys.: Condens. Matter 14, R597 (2002). 10.1088/0953-8984/14/18/202 [DOI] [Google Scholar]
- 2. Kneipp K., Wang Y., Dasari R. R., and Feld M. S., Spectrochim. Acta, Part A 51, 481 (1995). 10.1016/0584-8539(94)00235-4 [DOI] [Google Scholar]
- 3. McCreery R. L., Raman Spectroscopy for Chemical Analysis ( John Wiley & Sons, 2000). [Google Scholar]
- 4. Fleischmann M., Hendra P. J., and McQuillan A. J., Chem. Phys. Lett. 26, 163 (1974). 10.1016/0009-2614(74)85388-1 [DOI] [Google Scholar]
- 5. Dornhaus R., Benner R. E., Chang R. K., and Chabay I., Surf. Sci. 101, 367 (1980). 10.1016/0039-6028(80)90632-9 [DOI] [Google Scholar]
- 6. Jeanmaire D. L. and van Duyne R. P., J. Electroanal. Chem. 84, 1 (1977). 10.1016/S0022-0728(77)80224-6 [DOI] [Google Scholar]
- 7. LeRu E. C., Blackie E. J., Meyer M., and Etchegoin P. G., J. Phys. Chem. C 111, 13794 (2007). 10.1021/jp0687908 [DOI] [Google Scholar]
- 8. Sharma B., Frontiera R. R., Henry A.-I., Ringe E., and Van Duyne R. P., Mater. Today 15, 16 (2012). 10.1016/S1369-7021(12)70017-2 [DOI] [Google Scholar]
- 9. Etchegoin P. G. and Le Ru E. C., Phys. Chem. Chem. Phys. 10, 6079 (2008). 10.1039/b809196j [DOI] [PubMed] [Google Scholar]
- 10. Wu D.-Y., Li J.-F., Ren B., and Tian Z.-Q., Chem. Soc. Rev. 37, 1025 (2008). 10.1039/b707872m [DOI] [PubMed] [Google Scholar]
- 11. Stiles P. L., Dieringer J. A., Shah N. C., and Van Duyne R. P., Annu. Rev. Anal. Chem. 1, 601 (2008). 10.1146/annurev.anchem.1.031207.112814 [DOI] [PubMed] [Google Scholar]
- 12. Nelson M. and Cox D., Lehninger Principles of Biochemistry, 4th ed. ( W.H. Freeman and Company, 2005). [Google Scholar]
- 13. Podstawka E., Ozaki Y., and Proniewicz L. M., Appl. Spectrosc. 58, 570 (2004). 10.1366/000370204774103408 [DOI] [PubMed] [Google Scholar]
- 14. Kennedy D. C., Hoop K. A., Tay L.-L., and Pezacki J. P., Nanoscale 2, 1413 (2010). 10.1039/c0nr00122h [DOI] [PubMed] [Google Scholar]
- 15. Tu Q., J. Biomed. Opt. 15, 20512 (2010). 10.1117/1.3400660 [DOI] [PubMed] [Google Scholar]
- 16. Jeffers R. B. and Cooper J. B., Spectrosc. Lett. 43, 220 (2010). 10.1080/00387010903287102 [DOI] [Google Scholar]
- 17. Mahmoud M. A. and El-Sayed M. A., J. Phys. Chem. Lett. 4, 1541 (2013). 10.1021/jz4005015 [DOI] [PubMed] [Google Scholar]
- 18. Wang H., Fang J., Xu J., Wang F., Sun B., He S., Sun G., and Liu H., Analyst 140, 2973 (2015). 10.1039/C5AN00232J [DOI] [PubMed] [Google Scholar]
- 19. Jain P. K., Huang W., and El-Sayed M. A., Nano Lett. 7, 2080 (2007). 10.1021/nl071008a [DOI] [PubMed] [Google Scholar]
- 20. Aizpurua J., Hanarp P., Sutherland D. S., Kall M., Bryant G. W., and deAbajo F. J. G., Phys. Rev. Lett. 90, 057401 (2003). 10.1103/PhysRevLett.90.057401 [DOI] [PubMed] [Google Scholar]
- 21. Charnay C., Lee A., Man S.-Q., Moran C. E., Radloff C., Bradley R. K., and Halas N. J., J. Phys. Chem. B 107, 7327 (2003). 10.1021/jp034309r [DOI] [Google Scholar]
- 22. Yu L., Liu G. L., Kim J., Mejia Y. X., and Lee L. P., Nano Lett. 5, 119 (2005). 10.1021/nl048232+ [DOI] [PubMed] [Google Scholar]
- 23. Ross B. M. and Lee L. P., Nanotechnology 19, 275201 (2008). 10.1088/0957-4484/19/27/275201 [DOI] [PubMed] [Google Scholar]
- 24. Wang H., Kundu J., and Halas N. J., Angew. Chem., Int. Ed. 46, 9040 (2007). 10.1002/anie.200702072 [DOI] [PubMed] [Google Scholar]
- 25. Masson J.-F., Gibson K. F., and Provencher-Girard A., J. Phys. Chem. C 114, 22406 (2010). 10.1021/jp106450y [DOI] [Google Scholar]
- 26. Shanmukh S., Jones L., Driskell J., Zhao Y. P., Dluhy R., and Tripp R. A., Nano Lett. 6, 2630 (2006). 10.1021/nl061666f [DOI] [PubMed] [Google Scholar]
- 27. Xie J., Zhang Q., Lee J. Y., and Wang D. I. C., ACS Nano 2, 2473 (2008). 10.1021/nn800442q [DOI] [PubMed] [Google Scholar]
- 28. Wang G., Shi G., Wang H., Zhang Q., and Li Y., Adv. Funct. Mater. 24, 1017 (2014). 10.1002/adfm.201301936 [DOI] [Google Scholar]
- 29. Zhou Q., Meng G., Zheng P., Cushing S., Wu N., Huang Q., Zhu C., Zhang Z., and Wang Z., Sci. Rep. 5, 12865 (2015). 10.1038/srep12865 [DOI] [PMC free article] [PubMed] [Google Scholar]
- 30. Hsieh H.-Y., Xiao J.-L., Lee C., Huang T.-W., Yang C.-S., Wang P.-C., and Tseng F.-G., J. Phys. Chem. C 115, 16258 (2011). 10.1021/jp2012667 [DOI] [Google Scholar]
- 31. Bischof J. C. and He X., Ann. N. Y. Acad. Sci. 1066, 12 (2005). 10.1196/annals.1363.003 [DOI] [PubMed] [Google Scholar]
- 32. Roper D. K., Ahn W., and Hoepfner M., J. Phys. Chem. C 111, 3636 (2008). 10.1021/jp064341w [DOI] [PMC free article] [PubMed] [Google Scholar]
- 33. Richardson H. H., Carlson M. T., Tandler P. J., Hernandez P., and Govorov A. O., Nano Lett. 9, 1139 (2009). 10.1021/nl8036905 [DOI] [PMC free article] [PubMed] [Google Scholar]
- 34. Jiang K., Smith D. A., and Pinchuk A., J. Phys. Chem. C 117, 27073 (2013). 10.1021/jp409067h [DOI] [Google Scholar]
- 35. Mendes R., Pedrosa P., Lima J. C., Fernandes A. R., and Baptista P. V., Sci. Rep. 7, 10872 (2017). 10.1038/s41598-017-11491-8 [DOI] [PMC free article] [PubMed] [Google Scholar]
- 36. Vezvaie M., Brosseau C. L., and Lipkowski J., Electrochim. Acta 110, 120 (2013). 10.1016/j.electacta.2013.03.139 [DOI] [Google Scholar]
- 37. Karaballi R. A., Nel A., Krishnan S., Blackburn J., and Brosseau C. L., Phys. Chem. Chem. Phys. 17, 21356 (2015). 10.1039/C4CP05077K [DOI] [PubMed] [Google Scholar]
- 38. Kumari G., Kandula J., and Narayana C., J. Phys. Chem. C 119, 20057 (2015). 10.1021/acs.jpcc.5b07556 [DOI] [Google Scholar]
- 39. Cho I.-H., Das M., Bhandari P., and Irudayaraj J., Sens. Actuators, B 213, 209 (2015). 10.1016/j.snb.2015.02.091 [DOI] [Google Scholar]
- 40. Chen Y., Zheng X., Chen G., He C., Zhu W., Feng S., Xi G., Chen R., Lan F., and Zeng H., Int. J. Nanomed. 7, 73 (2012). 10.2147/IJN.S26854 [DOI] [PMC free article] [PubMed] [Google Scholar]
- 41. Freitag I., Beleites C., Dochow S., Clement J. H., Krafft C., and Popp J., Analyst 141, 5986 (2016). 10.1039/C6AN01739H [DOI] [PubMed] [Google Scholar]
- 42. Xu Y., Cheng G., He P., and Fang Y., Electroanalysis 21, 1251 (2009). 10.1002/elan.200804561 [DOI] [Google Scholar]
- 43. Lin L., Wang H., Liu Y., Yan H., and Lindsay S., Biophys. J. 90, 4236 (2006). 10.1529/biophysj.105.079111 [DOI] [PMC free article] [PubMed] [Google Scholar]
- 44. Carter P. J., Nat. Rev. Immunol. 6, 343 (2006). 10.1038/nri1837 [DOI] [PubMed] [Google Scholar]
- 45. Cottat M., D'Andrea C., Yasukuni R., Malashikhina N., Grinyte R., Lidgi-Guigui N., Fazio B., Sutton A., Oudar O., Charnaux N., Pavlov V., Toma A., DiFabrizio E., Gucciardi P. G., and Lamy de la Chapelle M., J. Phys. Chem. C 119, 15532 (2015). 10.1021/acs.jpcc.5b03681 [DOI] [Google Scholar]
- 46. Sun H. and Zu Y., Molecules 20, 11959 (2015). 10.3390/molecules200711959 [DOI] [PMC free article] [PubMed] [Google Scholar]
- 47. Lee J. O., So H. M., Jeon E. K., Chang H., Won K., and Kim Y. H., Anal. Bioanal. Chem. 390, 1023 (2008). 10.1007/s00216-007-1643-y [DOI] [PMC free article] [PubMed] [Google Scholar]
- 48. Pastor F., Soldevilla M. M., Villanueva H., Kolonias D., Inoges S., deCerio A. L., Kandzia R., Klimyuk V., Gleba Y., Gilboa E., and Bendandi M., Mol. Ther.-Nucleic Acids 2, e98 (2013). 10.1038/mtna.2013.26 [DOI] [PMC free article] [PubMed] [Google Scholar]
- 49. Chung E., Jeon J., Yu J., Lee C., and Choo J., Biosens. Bioelectron. 64, 560 (2015). 10.1016/j.bios.2014.09.087 [DOI] [PubMed] [Google Scholar]
- 50. Xu L., Yan W., Ma W., Kuang H., Wu X., Liu L., Zhao Y., Wang L., and Xu C., Adv. Mater. 27, 1706 (2015). 10.1002/adma.201402244 [DOI] [PubMed] [Google Scholar]
- 51. Hu P. P., Liu H., Zhan L., Zheng L. L., and Huang C. Z., Talanta 139, 35 (2015). 10.1016/j.talanta.2014.12.050 [DOI] [PubMed] [Google Scholar]
- 52. Zhao S., Ma W., Xu L., Wu X., Kuang H., Wang L., and Xu C., Biosens. Bioelectron. 68, 593 (2015). 10.1016/j.bios.2015.01.056 [DOI] [PubMed] [Google Scholar]
- 53. Kim S., Jeong S.-N., Bae S., Chung H., and Yoo S. Y., Anal. Chem. 88, 11288 (2016). 10.1021/acs.analchem.6b03320 [DOI] [PubMed] [Google Scholar]
- 54. Campos A. R., Gao Z., Blaber M. G., Huang R., Schatz G. C., VanDuyne R. P., and Haynes C. L., J. Phys. Chem. C 120, 20961 (2016). 10.1021/acs.jpcc.6b03027 [DOI] [Google Scholar]
- 55. Zhao J., Zhang K., Li Y., Ji J., and Liu B., ACS Appl. Mater. Interfaces 8, 14389 (2016). 10.1021/acsami.6b03352 [DOI] [PubMed] [Google Scholar]
- 56. Yoon J., Choi N., Ko J., Kim K., Lee S., and Choo J., Biosens. Bioelectron. 47, 62 (2013). 10.1016/j.bios.2013.03.003 [DOI] [PubMed] [Google Scholar]
- 57. Yang T., Guo X., Wu Y., Wang H., Fu S., Wen Y., and Yang H., ACS Appl. Mater. Interfaces 6, 20985 (2014). 10.1021/am5057536 [DOI] [PubMed] [Google Scholar]
- 58. Qiu Y., Deng D., Deng Q., Wu P., Zhang H., and Cai C., J. Mater. Chem. B 3, 4487 (2015). 10.1039/C5TB00638D [DOI] [PubMed] [Google Scholar]
- 59. Wang J., Wu X., Wang C., Shao N., Dong P., Xiao R., and Wang S., ACS Appl. Mater. Interfaces 7, 20919 (2015). 10.1021/acsami.5b06446 [DOI] [PubMed] [Google Scholar]
- 60. Zhang H., Ma X., Liu Y., Duan N., Wu S., Wang Z., and Xu B., Biosens. Bioelectron. 74, 872 (2015). 10.1016/j.bios.2015.07.033 [DOI] [PubMed] [Google Scholar]
- 61. Ngo H. T., Gandra N., Fales A. M., Taylor S. M., and Vo-Dinh T., Biosens. Bioelectron. 81, 8 (2016). 10.1016/j.bios.2016.01.073 [DOI] [PMC free article] [PubMed] [Google Scholar]
- 62. Wang J., Wu X., Wang C., Rong Z., Ding H., Li H., Li S., Shao N., Dong P., Xiao R., and Wang S., ACS Appl. Mater. Interfaces 8, 19958 (2016). 10.1021/acsami.6b07528 [DOI] [PubMed] [Google Scholar]
- 63. Jiang N., Foley E. T., Klingsporn J. M., Sonntag M. D., Valley N. A., Dieringer J. A., Seideman T., Schatz G. C., Hersam M. C., and VanDuyne R. P., Nano Lett. 12, 5061 (2012). 10.1021/nl2039925 [DOI] [PubMed] [Google Scholar]
- 64. Liu Z., Ding S.-Y., Chen Z.-B., Wang X., Tian J.-H., Anema J. R., Zhou X.-S., Wu D.-Y., Mao B.-W., Xu X., Ren B., and Tian Z.-Q., Nat. Commun. 2, 305 (2011). 10.1038/ncomms1310 [DOI] [PMC free article] [PubMed] [Google Scholar]
- 65. Cialla D., Deckert-Gaudig T., Budich C., Laue M., Möller R., Naumann D., Deckert V., and Popp J., J. Raman Spectrosc. 40, 240 (2009). 10.1002/jrs.2123 [DOI] [Google Scholar]
- 66. Lesser-Rojas L., Ebbinghaus P., Vasan G., Chu M. L., Erbe A., and Chou C. F., Nano Lett. 14, 2242 (2014). 10.1021/nl4046685 [DOI] [PubMed] [Google Scholar]
- 67. Pethig R., Biomicrofluidics 4, 1 (2010). [DOI] [PMC free article] [PubMed] [Google Scholar]
- 68. Bown M. R. and Meinhart C. D., Microfluid. Nanofluid. 2, 513 (2006). 10.1007/s10404-006-0097-4 [DOI] [Google Scholar]
- 69. Wu J. K., Wu Y. S., Yang C. S., and Tseng F. G., Biosens. Bioelectron. 43, 453 (2013). 10.1016/j.bios.2012.12.013 [DOI] [PubMed] [Google Scholar]
- 70. Park M., Oh Y. J., Park S. G., Yang S. B., and Jeong K. H., Small 11, 2487 (2015). 10.1002/smll.201402942 [DOI] [PubMed] [Google Scholar]
- 71. Duffy D. C., McDonald J. C., Schueller O. J., and Whitesides G. M., Anal. Chem. 70, 4974 (1998). 10.1021/ac980656z [DOI] [PubMed] [Google Scholar]
- 72. Squires T. M. and Quake S. R., Rev. Mod. Phys. 77, 977 (2005). 10.1103/RevModPhys.77.977 [DOI] [Google Scholar]
- 73. Wang Y., Stevens A. L., and Han J., Anal. Chem. 77, 4293 (2005). 10.1021/ac050321z [DOI] [PubMed] [Google Scholar]
- 74. DeMello A. J., Nature 442, 394 (2006). 10.1038/nature05062 [DOI] [PubMed] [Google Scholar]
- 75. Plecis A., Nanteuil C., Haghiri-Gosnet A. M., and Chen Y., Anal. Chem. 80, 9542 (2008). 10.1021/ac8017907 [DOI] [PubMed] [Google Scholar]
- 76. Kim D. J., Jeon T. Y., Baek Y. K., Park S. G., Kim D. H., and Kim S. H., Chem. Mater. 28, 1559 (2016). 10.1021/acs.chemmater.6b00115 [DOI] [Google Scholar]
- 77. Liu H., Qian X., Wu Z., Yang R., Sun S., and Ma H., J. Mater. Chem. B 4, 482 (2016). 10.1039/C5TB02209F [DOI] [PubMed] [Google Scholar]
- 78. Fazio B., D'Andrea C., Foti A., Messina E., Irrera A., Donato M. G., Villari V., Micali N., Maragò O. M., and Gucciardi P. G., Sci. Rep. 6, 26952 (2016). 10.1038/srep26952 [DOI] [PMC free article] [PubMed] [Google Scholar]
- 79. Aybeke E. N., Lacroute Y., Elie-Caille C., Bouhelier A., Bourillot E., and Lesniewska E., Nanotechnology 26, 245302 (2015). 10.1088/0957-4484/26/24/245302 [DOI] [PubMed] [Google Scholar]
- 80. Sivanesan A., Izake E. L., Agoston R., Ayoko G., and Sillence M., J. Nanobiotechnol. 13, 43 (2015). 10.1186/s12951-015-0102-8 [DOI] [PMC free article] [PubMed] [Google Scholar]
- 81. Huh Y. S. and Erickson D., Biosens. Bioelectron. 25, 1240 (2010). 10.1016/j.bios.2009.09.040 [DOI] [PMC free article] [PubMed] [Google Scholar]
- 82. Galarreta B. C., Tabatabaei M., Guieu V., Peyrin E., and Lagugné-Labarthet F., Anal. Bioanal. Chem. 405, 1613 (2013). 10.1007/s00216-012-6557-7 [DOI] [PubMed] [Google Scholar]
- 83. Fu C., Wang Y., Chen G., Yang L., Xu S., and Xu W., Anal. Chem. 87, 9555 (2015). 10.1021/acs.analchem.5b02508 [DOI] [PubMed] [Google Scholar]
- 84. Yang H., Deng M., Ga S., Chen S., Kang L., Wang J., Xin W., Zhang T., You Z., An Y., Wang J., and Cui D., Nanoscale Res. Lett. 9, 138 (2014). 10.1186/1556-276X-9-138 [DOI] [PMC free article] [PubMed] [Google Scholar]
- 85. Li M., Zhao F., Zeng J., Qi J., Lu J., and Shih W.-C., J. Biomed. Opt. 19, 111611 (2014). 10.1117/1.JBO.19.11.111611 [DOI] [PubMed] [Google Scholar]
- 86. Oh Y.-J. and Jeong K.-H., Lab Chip 14, 865 (2014). 10.1039/c3lc51257f [DOI] [PubMed] [Google Scholar]
- 87. Xu B.-B., Ma Z.-C., Wang H., Liu X.-Q., Zhang Y.-L., Zhang X.-L., Zhang R., Jiang H.-B., and Sun H.-B., Electrophoresis 32, 3378 (2011). 10.1002/elps.201100309 [DOI] [PubMed] [Google Scholar]
- 88. Zhou J., Ren K., Zhao Y., Dai W., and Wu H., Anal. Bioanal. Chem. 402, 1601 (2012). 10.1007/s00216-011-5585-z [DOI] [PubMed] [Google Scholar]
- 89. Li J., Skeete Z., Shan S., Yan S., Kurzatkowska K., Zhao W., Ngo Q. M., Holubovska P., Luo J., Hepel M., and Zhong C. J., Anal. Chem. 87, 10698 (2015). 10.1021/acs.analchem.5b03456 [DOI] [PubMed] [Google Scholar]
- 90. Unger M. A., Science 288, 113 (2000). 10.1126/science.288.5463.113 [DOI] [PubMed] [Google Scholar]
- 91. Hwang H. and Park J.-K., Lab Chip 11, 33 (2011). 10.1039/C0LC00117A [DOI] [PubMed] [Google Scholar]
- 92. Hwang H., Han D., Oh Y.-J., Cho Y.-K., Jeong K.-H., and Park J.-K., Lab Chip 11, 2518 (2011). 10.1039/c1lc20277d [DOI] [PubMed] [Google Scholar]
- 93. Hwang H., Chon H., Choo J., and Park J.-K., Anal. Chem. 82, 7603 (2010). 10.1021/ac101325t [DOI] [PubMed] [Google Scholar]
- 94. Ji J., Li P., Sang S., Zhang W., Zhou Z., Yang X., Dong H., Li G., and Hu J., AIP Adv. 4, 31329 (2014). 10.1063/1.4868518 [DOI] [Google Scholar]
- 95. Fan M., Cheng F., Wang C., Gong Z., Tang C., Man C., and Brolo A. G., Chem. Commun. 51, 1965 (2015). 10.1039/C4CC07928K [DOI] [PubMed] [Google Scholar]
- 96. Qian C., Guo Q., Xu M., Yuan Y., and Yao J., RSC Adv. 5, 53306 (2015). 10.1039/C5RA07324C [DOI] [Google Scholar]
- 97. Hou D., Maheshwari S., and Chang H. C., Biomicrofluidics 1, 014106 (2007). 10.1063/1.2710191 [DOI] [PMC free article] [PubMed] [Google Scholar]
- 98. Cheng I. F., Lin C. C., Lin D. Y., and Chang H. C., Biomicrofluidics 4, 034104 (2010). 10.1063/1.3474638 [DOI] [PMC free article] [PubMed] [Google Scholar]
- 99. Liu S., Yan Y., Wang Y., Senapati S., and Chang H. C., Biomicrofluidics 7, 061102 (2013). 10.1063/1.4832095 [DOI] [PMC free article] [PubMed] [Google Scholar]
- 100. Tomkins M., Liao D., and Docoslis A., Sensors 15, 1047 (2015). 10.3390/s150101047 [DOI] [PMC free article] [PubMed] [Google Scholar]
- 101. Cheng I., Chen T., Chao W., Cheng I., Chen T., and Chao W., Biomicrofluidics 10, 34116 (2016). 10.1063/1.4953447 [DOI] [PMC free article] [PubMed] [Google Scholar]
- 102. Sun G., Pan Z., Senapati S., and Chang H. C., Phys. Rev. Appl. 7, 064024 (2017). 10.1103/PhysRevApplied.7.064024 [DOI] [PMC free article] [PubMed] [Google Scholar]
- 103. Yazdi S. H. and White I. M., Anal. Chem. 84, 7992 (2012). 10.1021/ac301747b [DOI] [PubMed] [Google Scholar]
- 104. Yazdi S. H. and White I. M., Analyst 138, 100 (2013). 10.1039/C2AN36232E [DOI] [PubMed] [Google Scholar]
- 105. Nguyen A. H., Lee J., IlChoi H., Kwak H. S., and Sim S. J., Biosens. Bioelectron. 70, 358 (2015). 10.1016/j.bios.2015.03.064 [DOI] [PubMed] [Google Scholar]
- 106. Novara C., Lamberti A., Chiadò A., Virga A., Rivolo P., Geobaldo F., and Giorgis F., RSC Adv. 6, 21865 (2016). 10.1039/C5RA26746C [DOI] [PubMed] [Google Scholar]
- 107. Saha A. and Jana N. R., ACS Appl. Mater. Interfaces 7, 996 (2015). 10.1021/am508123x [DOI] [PubMed] [Google Scholar]
- 108. Zhang K., Zhao J., Xu H., Li Y., Ji J., and Liu B., ACS Appl. Mater. Interfaces 7, 16767 (2015). 10.1021/acsami.5b04534 [DOI] [PubMed] [Google Scholar]
- 109. Restaino S. M. and White I. M., Proc. SPIE 2015, 93140R. [Google Scholar]
- 110. Torul H., Çiftçi H., Çetin D., Suludere Z., Boyacı I. H., and Tamer U., Anal. Bioanal. Chem. 407, 8243 (2015). 10.1007/s00216-015-8966-x [DOI] [PubMed] [Google Scholar]
- 111. Meier T.-A., Poehler E., Kemper F., Pabst O., Jahnke H.-G., Beckert E., Robitzki A., and Belder D., Lab Chip 15, 2923 (2015). 10.1039/C5LC00397K [DOI] [PubMed] [Google Scholar]
- 112. Strehle K. R., Cialla D., Rösch P., Henkel T., Köhler M., and Popp J., Anal. Chem. 79, 1542 (2007). 10.1021/ac0615246 [DOI] [PubMed] [Google Scholar]
- 113. Gao R., Cheng Z., deMello A. J., and Choo J., Lab Chip 16, 1022 (2016). 10.1039/C5LC01249J [DOI] [PubMed] [Google Scholar]
- 114. Psaltis D., Quake S. R., and Yang C., Nature 442, 381 (2006). 10.1038/nature05060 [DOI] [PubMed] [Google Scholar]
- 115. Fan X. and White I. M., Nat. Photonics 5, 591 (2011). 10.1038/nphoton.2011.206 [DOI] [PMC free article] [PubMed] [Google Scholar]
- 116. Guo Y., Khaing Oo M. K., Reddy K., and Fan X., ACS Nano 6, 381 (2012). 10.1021/nn203733t [DOI] [PubMed] [Google Scholar]
- 117. Lei T. and Poon A. W., Opt. Express 21, 1520 (2013). 10.1364/OE.21.001520 [DOI] [PubMed] [Google Scholar]
- 118. Barik A., Otto L. M., Yoo D., Jose J., Johnson T. W., and Oh S. H., Nano Lett. 14, 2006 (2014). 10.1021/nl500149h [DOI] [PMC free article] [PubMed] [Google Scholar]
- 119. Soltani M., Lin J., Forties R., Inman J. T., Saraf S. N., Fulbright R. M., Lipson M., and Wang M. D., Nat. Nanotechnol. 9, 448 (2014). 10.1038/nnano.2014.79 [DOI] [PMC free article] [PubMed] [Google Scholar]
- 120. Kim J. and Shin J. H., Sci. Rep. 6, 33842 (2016). 10.1038/srep33842 [DOI] [PMC free article] [PubMed] [Google Scholar]
- 121. Liu H., Liu J., Li S., Chen L., Zhou H., Zhu J., and Zheng Z., Opt. Commun. 352, 148 (2015). 10.1016/j.optcom.2015.04.084 [DOI] [Google Scholar]
- 122. Huh Y. S., Chung A. J., and Erickson D., Microfluid. Nanofluid. 6, 285 (2009). 10.1007/s10404-008-0392-3 [DOI] [Google Scholar]
- 123. Zhao Q., Liu G., Zhang H., Zhou F., Li Y., and Cai W., J. Hazard. Mater. 324, 194 (2017). 10.1016/j.jhazmat.2016.10.049 [DOI] [PubMed] [Google Scholar]
- 124. Song C., Yang B., Zhu Y., Yang Y., and Wang L., Biosens. Bioelectron. 87, 59 (2017). 10.1016/j.bios.2016.07.097 [DOI] [PubMed] [Google Scholar]
- 125. Si S., Liang W., Sun Y., Huang J., Ma W., Liang Z., Bao Q., and Jiang L., Adv. Funct. Mater. 26, 8137 (2016). 10.1002/adfm.201602337 [DOI] [Google Scholar]


