

Abstract
Quantification of proteins by LC-MS/MS-MRM has become a standard method with broad projected clinical applicability. MRM quantification of protein modifications is, however, far less utilized, especially in the case of glycoproteins. This review summarizes current methods for quantitative analysis of protein glycosylation with a focus on MRM methods. We describe advantages of this quantitative approach, analytical parameters that need to be optimized to achieve reliable measurements, and point out the limitations. Differences between major classes of N- and O-glycopeptides are described and class-specific glycopeptide assays are demonstrated.
Keywords: Glycosylation, MS, MRM, Quantification, Site-specific glycoforms
1 Introduction
Quantification of drugs and metabolites by SRM or MRM is a standard analytical approach with well documented applicability to quantification of proteins [1–3]. Chosen analytes are typically separated by LC and detected, at high sensitivity, by selected ion monitoring mode on triple quadrupole mass analyzers. Selected ion monitoring of a precursor ion in the first quadrupole and its fragments in the second quadrupole reduces background noise and allows reliable quantification with linear response across a broad dynamic range [4, 5]. Current MRM methods achieve specific multiplex detection of proteins with sensitivity comparable to ELISA, even in serum [6–8]. This is important because large-scale LC-MS/MS workflows are optimized for proteome coverage but limited in quantitative accuracy. Adoption of LC-MS/MS-MRM was made feasible by large repositories of peptide fragmentation spectra obtained during a long phase of proteomic discovery studies [3, 9, 10]. Exploration of protein modifications is now a dynamic field of research in a productive discovery phase but quantification of the modified peptides by MRM or SRM methods, especially in the case of glycoproteins, has not reached broad acceptance. We discuss differences in the quantification of proteins and their glycoforms, review advantages, and limitations of the approach, and point out pre-requisites for reliable quantification of glycopeptides.
2 Biology and impact of glycosylation
Glycosylation is an integral part of life whose impact increases with the complexity of the organism [11]. Glycans mediate interactions of all cells, including reproductive cells, and regulate fundamental biological, chemical, and physical processes including evolution [12, 13]. Specific types of glycosylation carry out distinct functions but, to focus the review, we discuss two clinically relevant types of glycosylation associated with human proteins: N-GlcNAc (or N-glycosylation of asparagines) and O-GalNAc (or mucin-type O-glycosylation of serines or threonines). These two types of glycosylation, observed on secretory and membrane proteins, are constructed from similar monosaccharides and exhibit similar degree of complexity but they differ in their biosynthetic origin and site of protein attachment [14, 15]. The similarities and differences between these two glycosylation types provide a useful framework for discussion of their quantification.
In case of N-glycosylation, a common glycan building block conjugated to a lipid is synthesized prior to its attachment to asparagine (N), typically in the NXS/T sequon (X≠P) [16]. The N-glycosylation process is initiated by the oligosaccharyl transferase (OST) complex localized in the endoplasmic reticulum [17]. N-glycans assist with protein folding, are trimmed during the protein maturation process, and further assist with protein sorting [16]. Following transfer of the properly folded glycoprotein to the Golgi apparatus, the intermediate glycan structures are further modified by glycosyl transferases that synthesize the mature N-glycans associated with secreted/membrane proteins. These mature N-glycans have a different function than the N-glycans involved in protein folding and export from the ER and are typically microheterogeneous (several different structures observed at each attachment site). It is essential to consider the microheterogeneity of protein glycosylation in the quantitative analysis of glycopeptides.
Of 15 946 human proteins with NXS/T sequons, 4383 are annotated as documented or predicted N-glycoproteins in the UniProtKB (release 2014_01). The difference is in part due to the fact that only some sequons are occupied and in part due to the as yet incomplete experimental knowledge of the N-glycoproteome [18]. Prediction algorithms are not reliable enough to assign occupancy [19] but LC-MS workflows continue to expand our knowledge of N-glycosylation [20,21]. Two recent LC-MS/MS studies of N-glycosylated peptides in multiple mouse tissues following de-glycosylation of lectin-captured peptides with peptide: N-glycosidase F (PNG-aseF) explore the extent of N-glycosylation. Zielinska et al., reported identification of 6367 N-glycosylation sites on 2352 proteins [22] and Kaji et al., reported 5060 N-glycosylation sites on 2556 proteins [23]. The majority of sequons of secreted and membrane proteins identified in these studies were glycosylated in contrast to the sequons of cytoplasmic and nuclear proteins that were unoccupied [22]. Comparison of the datasets showed an overlap of only 2195 sites on 1811 proteins from 1281 genes. This suggests that the total number of experimentally verified N-glycosylated proteins and peptides will grow as methods further improve and studies continue to explore tissues under more diverse physiological conditions. These studies provide excellent overview of macroheterogeneity (utilization of N-glycosylation sequons) enabling subsequent glycoproteomic studies of microheterogeneity.
Mucin-type O-glycans, on the other hand, are attached to serine/threonine, in loose sequence context, by a process initiated in the Golgi compartment by about 20 different GalNAc transferases in humans [24]. Mature O-glycans are built sequentially one monosaccharide at a time and tend to be smaller, generally 1–6 monosaccharides, compared to N-glycans that are generally 7–15 monosaccharides in size [25]. Despite this, O-glycoforms are just as diverse and as frequently observed as N-glycans. O-glycosylation, similar to N-glycosylation, exhibits site-specific microheterogeneity with a wide range of structures for some O-glycoproteins, such as mucins [26]. Expression of truncated O-glycosylated proteins in genetically modified cells suggests that nearly all proteins targeted to the secretory pathway are O-glycosylated [27]. Proteins can be O-glycosylated on multiple serines/threonines and both N- and O-modifications of the same protein have been observed [24]. Even a single isolated protein can therefore represent very complex mixture of glycosylated species [28]. It is expected that characterization of site-specific glycoforms will continue to elucidate structure–function relationships and site-specific quantification of glycan changes will provide insights into glycobiology and pathophysiology [15,27].
3 Expanding repertoire of N- and O-glycan structures
The diversity of glycans experimentally observed on proteins continues to increase, in addition to the number of verified glycosylation sites. Analytical glycoscience faces the challenge of defining and quantifying this common and structurally diverse group of biopolymers [29]. Naturally occurring glycoproteins [30–32], recombinant glycosylated therapeutics [33,34], or even synthetic glycans incorporated into glycoproteins [35,36] represent analytical targets of growing biomedical relevance.
Characterization of glycoproteins is typically carried out by separate analysis of detached glycans (glycomics) and peptides following enzymatic or chemical deglycosylation [31, 37]. Methods of structural analysis of detached glycans were recently reviewed and will not be discussed in detail here [38–41]. Suffice to say that site-specific quantification of glycopeptides would not be possible without the structural glycomic foundation. The in vivo biosynthetic processes somewhat limit the space of potential glycan structures but the variety is enormous [14]. With the complex connectivity of the glycan building blocks and their nonsaccharide modifications, mass spectrometric analysis of glycans is more analogous to de novo sequencing of modified peptides than to bottom-up proteomics. Methods for complete characterization of glycan structures are therefore varied and challenging but improving analytical know-how continues to expand the experimentally verified N- and O-glycan repertoire.
N-glycans with mass up to 13 kDa (permethylated) were recently detected in extracts of mouse lung tissue by MALDI MS using methods of analysis optimized for this large mass range [42]. Canis et al., identified more than 300 N-glycan structures on commercial preparations of von Willebrand factor (Haemate P, ZLB, Behring) isolated from human plasma [43]. Even though full linkage detail was not assigned for all structures, the authors were able to propose a vWF structure/function model taking into account the diverse glycoforms. Modified glycans, especially sulfated glycoforms, continue to expand the N- and O-glycan repertoire [44]. Cheng et al., point out that negative ion-mode MALDI MS/MS is reported [44] to be sufficient to assign some structures but previously unreported 6-O-sulfated GlcNAc of disulfated O-glycans or structural isomers of the Lewis Y epitope require LC-MSn analysis of permethylated glycans. Ashline et al., used a set of synthetic glycan standards to further expand structural assignments, based on MSn analysis of permethylated glycans, by spectral matching of fragment ion intensities [45]. Reinhold et al., now propose a consolidated pipeline for analysis of detached glycans, which is projected to allow determination of sites of attachment, quantification, and detailed structural analysis [40].
As structural information accumulates, a unified representation of the growing family of glycans in well-designed databases is essential for further advances of glycoscience [46]. Glycan databases are relevant to our discussion because glycoproteomic studies typically identify glycopeptide masses and their fragments based on libraries of known glycans that are expected to further mature and grow [47,48].
4 Analysis of quantitative differences in the context of disease
The glycan repertoire is not uniform between species or even within cells and organs of the same organism; the same protein isolated from different cells or tissues may carry different glycoforms [15,33,49]. Activities of various components of the glycosylation apparatus, their competition for substrates, the structure of protein substrates, and the dynamics of local glycoprotein distribution define which N- and O-glycoforms are observed [25]. The assembly of glycans in a given physiological context is relatively constant but varies considerably at successive stages of an organism’s development or in disease [11, 28, 50]. In many diseases, changes in protein glycosylation are detectable and glycoproteins are well represented among serological markers approved by regulatory agencies [30,51]. Quantification of glycoforms is therefore of considerable interest. Many studies assess changes in glycosylation by quantitative comparison of detached glycans [52,53]. We will briefly introduce recent findings that highlight importance of targeted quantification of glycopeptides.
A series of large population studies quantified fluorescently labeled glycans detached from serum proteins in search of associations with genetic and environmental factors [54, 55]. This methodology is based on well-established techniques combining serial enzymatic digests of glycans with hydrophilic interaction chromatography (HILIC) retention times, normalized to a dextran ladder [49, 56]. Glycosidases are used to remove glycan building blocks, often in linkage-dependent manner, which provides information for structure determination [57] (Fig. 1).
Figure 1.
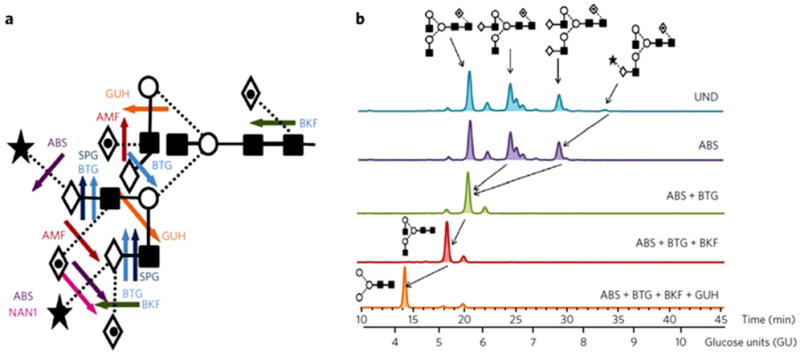
(A) Cleavage sites of commonly used exoglycosidases for glycan fingerprinting. (B) Representative HILIC profiles of 2-AB–labeled N-glycans from human IgG before (UND, undigested) and after exoglycosidase digestion. Reprinted with permission from [57]. Copyright 2010 Nature Publishing Group, Macmillan Publishers Limited.
Lauc et al., quantified 16 peaks in HILIC chromatograms plus 13 peaks in chromatograms recorded after treatment of the detached glycans with nonspecific sialidase, in a study of 2700 people [55]. The analysis correlates glycan intensities with the presence or absence of 300 000 single nucleotide polymorphisms in a genome-wide association study (GWAS). In this study, glycans were detached from the entire serum proteome and fluorescent labeling of the reducing-end allowed their relative quantification, following normalization by the sum of all fluorescent peaks. The results show that the FUT8 gene, responsible for core fucosylation, accounts for 5% of the variability in the intensity of the biantennary agalactosylated glycan (A2 in Oxford nomenclature). This conclusion was obtained even though many of the peaks of the HILIC chromatograms represent mixtures of glycan structures.
Resolution of glycan structures by HILIC chromatography was further improved in a study that examined N-glycans detached from IgG isolated from the plasma of 4000 people [55]. The narrower range of N-glycan structures associated with IgG and separation on 1.7 μm amide HILIC particles [56] allowed for the resolution of glycans into 24 peaks that contained, in most cases, just one dominant glycan. LC-MS in combination with serial exoglycosidase digests was used for structure assignments of the isolated peaks [55]. An expanded GWAS study found new associations between peaks and glycosyltransferases as well as genes previously not known to regulate glycosylation [58]. The authors conclude that the new discoveries are possible, at least in part, thanks to reduced variability of glycans detached from isolated IgG. The isolation of IgG eliminates interferences from other serum proteins on the relative intensities of glycans. The limited variation in the serum proteome among healthy individuals limits impact of contaminating proteins but proteome remodeling in context of disease is expected to impact quantitative glycan comparisons. For example, studies of liver disease show that increased immunoglobulin titers are the major reason for the observed changes in profiles of glycans detached from unfractionated serum proteome [59–61]. One way to account for differences in protein concentrations is quantification of glycopeptides.
In an interesting development of the GWAS study [58], measurements of glycopeptides of IgG1 and IgG2 were carried out, in parallel to HILIC-fluorescence, by negative ionization MALDI-TOF with 4-chloro-α-cyanocinnaminic acid matrix [62]. The MALDI-TOF analysis carried out relative quantification of glycopeptides without the introduction of quantitative standards. The quantitative results were comparable to UPLC-fluorescence for all except sialylated structures that are of lower intensity in the MALDI-TOF assay. The MALDI-TOF glycopeptide quantification is site-specific and resolves IgG1 and IgG2 isoforms based on the glycopeptide sequence. In addition, site-specific quantification of Fc glycopeptides avoided interference from the glycosylation of the Fab portion of IgG. However, the authors quantified only six glycoforms of each IgG (five ratios normalized to the intensity of mono-galactosylated core-fucosylated biantennary glycan) as opposed to 23 peaks in the HILIC-fluorescence workflow. The GWAS MALDI-TOF analysis confirmed the association of MGAT3 with two bisected core fucosylated glycans and the association of B4GALT1 with A2G2F (galactosylated core-fucosylated biantennary glycan). The consistency of the findings, even though partial, is encouraging and the scale of the studies is impressive.
Quantification of glycans by UPLC-fluorescence and MALDI-TOF MS was subsequently compared to two additional methods [63]. The first method is based on separation of glycopeptides by reversed phase capillary LC interfaced with a quadrupole TOF (QTOF) using sheath-flow ESI ionization [64] while the second method is based on capillary gel electrophoresis of detached fluorescently labeled glycans, similar to previously described workflows [59]. The study did not use standard analytical measures but compared feasibility and practicality of high-throughput analyses on thousands of samples. The main evaluation criterion was the observed strength of association in the GWAS study and weaknesses of each approach were summarized. The authors conclude that methods using chromatographic separation of either glycans (UPLC-fluorescence) or glycopeptides (RP-LC ESI QTOF) lead to stronger associations but have lower throughput. Since each method measures somewhat different analytes, this conclusion may not be justified. Nonetheless, the study shows that all four methods are feasible and provide comparable outcomes. The RP-LC ESI QTOF method [64] resolves 20 glycoforms of IgG1, 20 glycoforms of IgG2/3, and 10 glycoforms of IgG4 in a single analysis; in an analysis of detached glycans, the IgG source of the glycans would not be apparent. Quantification is based on relative intensity of each precursor, measured as sum of three isotopic peaks in +2 and +3 charge states, to the sum of peaks considered for each IgG subclass. This method achieved reliable multiplex quantification of site-specific glycoforms in this relatively simple protein mixture. This is important because growing evidence supports functional impact of glycosylation at specific sites of attachment to proteins. As an example, a recent study of IgE shows that of its seven N-glycosylation sequons, one is not glycosylated, five carry various complex glycans, and N275 is associated exclusively with oligomannose structures [65]. The N275 site is homologous to the N297 site of IgG whose glycosylation regulates receptor mediated responses. Mutation of N275 resulted in the loss of receptor binding [66] that suggests that glycoforms of this particular differentially glycosylated sequon of IgE regulate functional responses. Such insights into the structure function of glycoproteins [67] make exploration of site-specific glycoforms interesting and desirable.
5 Glycopeptide analysis
A number of creative solutions that facilitate glycoproteomic research were recently covered in comprehensive summaries [25, 30, 31, 37, 68] but, in spite of these advances, the properties of glycopeptides make their detection and quantification challenging [25, 69]. As we have already discussed, the total extent of N- and O-glycosylation of proteins is unknown; and while the NXS/T sequon narrows down the search space for N-glycopeptides, the attachment sites for O-glycosylation are less predictable. It is important to note that comprehensive enzymatic deglycosylation of O-glycans is not feasible even though various chemical methods have been introduced and β elimination/Michael addition can be used to label sites of O-glycan attachment [31,37]. Knowledge of glycan structures is incomplete and their variety overwhelming. Recent studies suggest, however, that the N- and mucin type O-glycans contain common structural cores [47]. This simplifies the search for glycopeptides and facilitates detection of the less common glycoforms. Detailed structural analysis of detached glycans often involves permethylation that stabilizes glycans, prevents gas phase rearrangements, and allows informative fragmentation [37, 70]. In addition, derivatization of the reducing end or terminal sialic acid provides a useful strategy for structural analysis or the quantification of glycans [39,71]. Options for derivatization of glycopeptides are more limited but provide significant inroads to desired fragmentation and structure identification.
Peptides can be viewed as a useful tag and further modification of the peptide attached to a glycan may prove helpful. Improved detection of glycopeptides derivatized with 1-pyrenyldiazomethane in the presence of peptides was documented [72]. 1-pyrenyldiazomethane reacts selectively with carboxyl groups of sialic acid, the peptide C-terminus and side chains which can be used to distinguish α2,3 and α2,6 linked sialylated glycopeptides in negative-ion MALDI-MS using 3AQ-CHCA ionic liquid matrix [73]. Liu et al., introduced methylamidation of sialic acids in the presence of (7-azabenzotriazol-1-yloxy) trispyrrolidinophosphonium hexafluorophosphate (PyAOP) [74]. This strategy was adopted by Nishikaze et al., for complete derivatization of carboxy groups of glycopeptides (Asp, Glu, C-terminus, and sialic acids). CID of the methylamine-labeled glycopeptides in negativeion MALDI MS/MS provides informative glycan fragment ions, while positive-ion CID provides information on peptide sequence and glycan composition. Kurogochi et al., selectively oxidized sialic acids of glycopeptides with NaIO4, conjugated to hydrazide beads, removed unbound peptides, and reductively amidated with 2-aminopyridine (PA) under acidic release conditions [75]. This improved the CID fragmentation of the PA-labeled glycopeptides resulting in specific oxonium ion series and relatively intense Y1 (peptide-GlcNAc) fragments in the ESI-MS/MS spectra. Quantification of the Y1 fragment ion by LC-MS/MS-MRM identified sialylated glycopeptides increased in serum of diabetic animals. Enhanced formation of the Y1 fragment in combination with MRM quantification is suggestive of targeted glycoproteomics but the emerging derivatization methods require further validation to become practically useful quantification strategies.
N-glycosylation is relatively sparse but inhibition of proteolysis by N-glycosylation can still occur [76]. This can be a serious problem in the analysis of O-glycosylated proteins as the O-glycoforms tend to cluster; mucins are notoriously resistant to proteolysis which is part of their biological function [77]. The effect of proteolysis on quantitative studies of proteins should not be underestimated [3]. It is a major factor in the variability of targeted proteomic studies and is expected to have an even larger impact on glycoproteomics. Proteolysis has been improved and accelerated by introduction of immobilized enzyme reactors and denaturation under pressure cycling to 25 kpsi [78]. Such developments will be critical for standardization of proteolysis for quantitative glycoproteomics.
Glycopeptides ionize less well than peptides [79] and carry multiple glycoforms per peptide that means that they are substoichiometric in protein digests. In a stimulating development, Stavenhagen et al., introduced synthetic glycopeptide standards to show that ionization of N-glycopeptides decreases to 10–50% ionization of the corresponding peptide [79]. The extent of reduction of ionization depends on LC-MS conditions but after trimming the glycopeptide to the Y1 structure, ionization efficiency was observed to be similar to that of the peptide. We do not know of a formal study confirming lower ionization efficiency for O-glycopeptides but they likely ionize less efficiently as well and we know that they are microheterogeneous [31]. These are the major drivers of the need to enrich glycopeptides for analysis and many successful strategies for glycopeptide enrichment were developed [25,30].
Lectins have been used for many years for enrichment of the glycoproteins and glycopeptides [22, 23, 80]. Lectins have been also used for the selective capture of specific glycan structures. Kaji et al., enriched glycopeptides on aleuria aurantia (fucosylated glycans) or datura stramonium (branched glycans) lectins for LC-MS/MS identification of peptides deglycosylated by PNGaseF under H218O [81]. Besides lectins, efficient capture of glycoproteins on hydrazide solid support was introduced by Zhang et al., [20]. Cis configured vicinal diols of glycans were oxidized to aldehydes with NaIO4 and bound covalently to the hydrazide beads. Capture was followed by tryptic digestion and washes of the immobilized glycopeptides with subsequent PNGaseF catalyzed release of deglycosylated peptides. This method has been used by many groups to capture N-glycoproteins or N-glycopeptides but O-glycopeptides are typically not analyzed by this approach due to the lack of a universal release method. An exception to this rule is the study of Nilsson et al., that used mild NaIO4 oxidation and acid release of glycopeptides leading to desialylation instead of deglycosylation [82]. This allowed analysis of both N- and O-glycopeptides by Fourier transform ion cyclotron resonance-MS with assignment of 80 glycosites, including 44 O-glycosites on glycoproteins from human cerebrospinal fluid. Parker et al., compared glycopeptide enrichment from heart tissue using titanium dioxide (sialylated glycoforms) [83], hydrazide capture [20], and HILIC chromatography [84]. HILIC enrichment was most efficient at capturing glycopeptides but hydrazide was more selective [85]. The sets of captured peptides were complementary with 1556 total N-glycosylation sites identified on 972 glycoproteins. Identifications were again achieved after deglycosylation of the peptides while differences in quantities of the peptides were determined by iTRAQ labeling. At the same time, detached glycans were analyzed by porous graphitized carbon (PGC) chromatography with LC-ESI-MS/MS detection. The authors conclude that quantitative changes were not due to glycosylation but rather due to changes in protein quantity. Only 3% of peptides identified as originally N-glycosylated were estimated to be false-positive deamidations; more than 50% of those occurred in the NS and NG sequence context.
We conclude this section with a brief discussion of discovery glycoproteomics. CID and higher-energy C-trap dissociation (HCD) of glycopeptides in positive ion mode generate dominant B- and Y-ions (glycosidic bond fragments) with limited fragmentation of the peptide backbone [86–88]. This provides information on glycan composition but unequivocal assignment of the peptide sequence typically needs additional methods of analysis or detachment of the glycans. Fragmentation of the peptide backbone of glycopeptides was much improved by introduction of electron-assisted methods (electron transfer dissociation (ETD) or electron capture dissociation (ECD)) [89,90] that leave the glycan largely intact [91,92]. These complementary methods are now combined in efficient workflows alternating collision- and electron-assisted fragmentation with high resolution analysis on various combinations of mass analyzers [25, 88]. Parker et al., analyzed glycopeptides enriched on zwitter-ionic HILIC cartridges by HCD/ETD on LTQ-Orbitrap Velos (Thermo Fisher); at the same time, detached glycans were analyzed by PGC LC-ESI-MS/MS [93]. The combined analyses led to the assignment of 863 N-glycopeptides corresponding to 276 glycosites on 161 glycoproteins starting with 5 mg of membrane glycoproteins extracted from rat brain tissue. In the same study, the authors identified 1989 formerly N-glycosylated peptides (glycosites) de-glycosylated with PNGaseF. This demonstrates the complexity of site-specific glycoform analysis that has lower coverage of glycosites than the analysis of deglycosylated peptides but adds another dimension of information content. We refer readers to recent reviews covering additional advances like stable isotope labeling, ion mobility, or informatic solutions [31,32,37].
Combination of efficient sample processing, glycopeptide enrichment, streamlined analysis of detached glycans and glycosylated peptides, efficient management of glycopeptide ions in mass analyzers, as well as improved informatic solutions allow meaningful glycoproteomic discovery studies in spite of all the limitations discussed above. Discovery glycoproteomic studies are now capable of identifying thousands of site-specific glycoforms [47] and discovery workflows of deglycosylated peptides identify thousands of glycosites [22, 27]. The discovery workflows identify differences in abundance that are, in the proteomic studies, followed by targeted verification workflows [3]. Proteomic verification studies reached a mature state where multiplex LC-MS/MS-MRM workflows reliably quantify hundreds of peptides and the libraries of peptide data are comprehensive enough to allow data independent quantification (SWATH MS) of even larger numbers of peptides at somewhat lower sensitivity [94] (Fig. 2).
Figure 2.
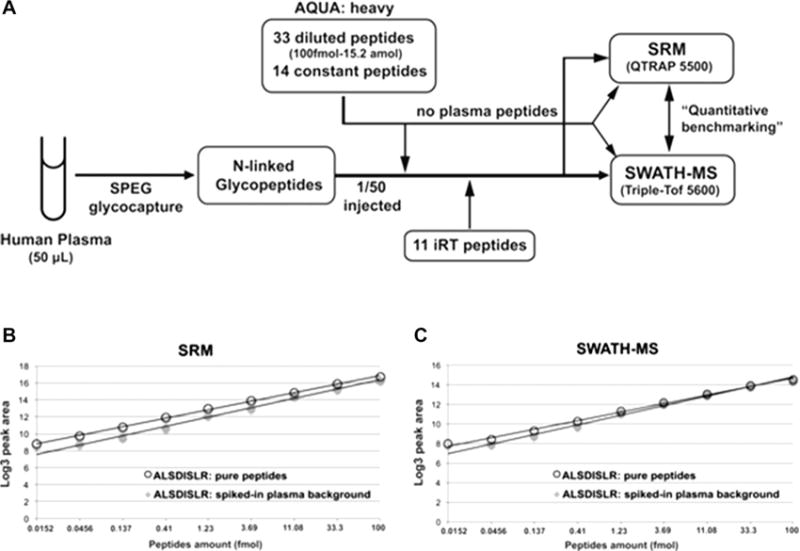
Quantitative measurements of N-linked glycoproteins by SRM or SWATH-MS. Reprinted with permission from [92]. Copyright 2013 WILEY-VCH Verlag GmbH & Co. KGaA.
LC-MS/MS-MRM verification studies of formerly N-glycosylated peptides are documented as well [95, 96]. We review these developments in the next section and then discuss the current state of verification studies of site-specific protein glycoforms.
6 SRM and MRM Quantification
Decades of method optimization established stable isotope dilution as the gold standard for quantitative mass spectrometry [97]. Measurement of the ratio of an analyte to its stable isotope standard (SIS) accounts for fluctuations of analysis and matrix effects [5]. SRM or MRM workflows maximize sensitivity because they select a narrow mass window (about 1 Da) for detection of precursor and product ions; this eliminates much of the noise associated with scanning methods [98]. Domon and Aebersold compared benefits of shotgun proteomics with directed (precursor ion list) or targeted (product ion list with assumed precursors) methods based on selected lists of analytes [99] (Fig. 3). Targeted methods sacrifice novelty (discovery of new targets) but work reliably at lower LOD and LOQ. Such methods are by definition hypothesis driven (we select up-front what will be measured) and databases of observable peptide spectra or in house generated spectral libraries provide necessary information to design assays for the selected targets [10].
Figure 3.
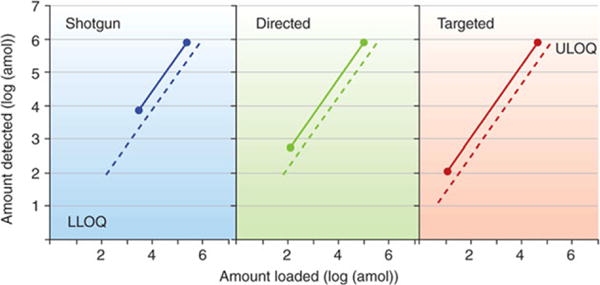
Effect on biochemical background on quantification by the shotgun (discovery), directed, and targeted proteomics strategies. Whereas dotted lines indicate a low-complexity background, full lines represent a complex background, such as a full-cell lysate. LLOQ, lower limit of quantification; ULOQ, upper limit of quantification. Reprinted with permission from [97]. Copyright 2010 Nature America, Inc.
Outstanding performance of LC-MS/MS-SRM in quantification of small molecules derives from the fact that polymers in biological matrices like serum are efficiently separated from the target analytes during sample preparation. Proteins, to the contrary, compete for detection with all the other proteins in biological matrices. In addition, proteins are quantified by LC-MS/MS-MRM indirectly; each protein is represented by a unique (proteotypic) peptide. Introduction of SIS peptides allowed the thorough evaluation of the analytical performance of assays, identification of the sources of variability, and the evaluation of limitations. A systemic study of 45 proteins in unfractionated serum, ranging in concentration from albumin to moderately abundant l-selectin (28 pmol/mL), showed specific detection (same ratios of endogenous/SIS peptides for all transitions with/out plasma matrix) with 2–4 logs of linearity [4]. Retention time constraints were used for two peptides with coeluting impurities. Measurements of reproducibility showed that CV decreased from >20% to <5% for most peptides when the SIS peptides were introduced at concentration-balanced amounts, corresponding to the mean analyte concentration in plasma. The assays proved reproducible for proteins in plasma at microgram/mL concentration across multiple laboratories, although the SIS peptides were added after proteolytic digest to avoid a substantial increase in variability [100]. Comparison with interlaboratory glycomic [101] and glycoproteomic [102] studies shows the value of the SIS in development of reliable workflows. Such standards and improved MRM methods described below will be of great benefit to glycoprotein analyses as glycosylation creates a quantification task of substantially higher complexity.
Further improvements in sensitivity [6–8] and throughput [95,103] brought LC-MS/MS-MRM of peptides closer to practical clinical use even though a number of the analytical steps, including the proteolytic digest, need further validation [3]. Immunoaffinity enrichment, using stable isotope standards captured by anti-peptide antibodies (SISCAPA), was automated for capture in a 9-plex format with quantification by nanoLC-MS/MS-MRM [104]. The assay achieves ng/mL detection limits with median CV 12.6%. Validation of the results in an interlaboratory study of the 8-plex immuno-MRM assay confirmed limits of detection below 1 ng/mL with 12–14% CV in 30 μL of plasma [6]. The reported variability includes the entire assay process, including enzymatic digest of plasma; with the tryptic digest contributing the largest portion of variability. Introduction of a stable isotope-labeled protein as an internal standard instead of SIS peptides nearly doubled assay accuracy and improved assay precision to 5%.
Shi et al., achieved 100 pg/mL sensitivity by introducing PRISM-SRM workflow [7]. Peptide mixtures spiked with SIS standards were separated by high-resolution high pH RP chromatography [105] at 3 μL/min flow rates. Split effluent was used for on-line monitoring of the SIS peptides and simultaneous fraction collection. Fractions containing peptides of interest were pooled and further separated by low pH nanoLC-MS with SRM quantification. This workflow achieved reliable quantification of prostate-specific antigen in serum. To avoid 2D fractionation, Burgess et al., optimized RP chromatography on 30 cm long 75 μm id columns packed with 1.9 μm/120 Å beads and operated at 50°C to reduce back pressure [8]. This setup achieved median LOQ of 4.2 ng/mL (0.9–60 ng/mL range) of 41 spiked SIS peptides and allowed multiplex quantification of 800 peptides (2400 transitions, including SIS standards) in one 3-h scheduled MRM run (average 20 points per peak, 1 min typical width, dwell times from 8 to 107 ms). Scheduled MRM allowed efficient handling of the large number of transitions by monitoring transitions corresponding to the known LC elution time of specific peptides [95].
Segmenting acquisition into about 5 min windows increases the number of peptides monitored and maintains sampling rate (cycle time) with the same degree of sensitivity by limiting sacrifice in dwell time [5]. Introduction of peptides as chromatographic landmarks allows for the transfer of methods between analytical platforms and permits selection of narrower time-windows for the scheduled MRM experiments, and further improves throughput [106]. Kiyonami et al., introduced intelligent SRM (iSRM) to further improve the number of peptides analyzed and the specificity of detection [103]. In this workflow, two primary transitions are used to trigger acquisition of additional transitions that target less intense fragment ions. The additional transitions increase the specificity of detection without the time-expense of extra scans [107]. iSRM allowed detection of tryptic peptides in the digest of yeast proteome with sensitivity in the tens of attomole range on column and throughput of 6000 transitions in one 60-min run [103].
LC-MS/MS-MRM quantification has been reported frequently in case of deglycosylated N-glycopeptides but in only a few cases for glycopeptides [95, 96]. Quantification of the formerly N-glycosylated peptides does not differ in principle from peptide MRM but needs to consider glycopeptide enrichment and restrictions due to the glycopeptide target. MRM assays of peptides usually select the most reliable observed peptide(s) for protein quantification, not necessarily the glycopeptide of interest. Consequently, some studies quantify captured glycoproteins by targeting other non-glycosylated peptides [108, 109]. Ahn et al., reported detection of attomolar amounts of TIMP-1 protein, captured with a lectin, using SISCAPA MRM assays that achieved protein quantification at 0.8 ng/mL in serum. While the assay performance is excellent the glycoprotein quantification is indirect [109]. MRM assays quantifying de-N-glycosylated peptides captured on hydrazide solid support have also been used extensively [30, 95, 96, 110]. For example, a study of a mouse model of prostate cancer, based on the knockout of PTEN tumor-suppressor gene, identified 775 N-linked glycoproteins from sera and prostate tissues of wild-type and PTEN-null mice [110]. Label-free quantitative proteomics was used to select 57 candidate proteins for a verification study of human orthologs in 209 men with prostate cancer or enlarged prostate controls. Targeted LC-MS/MS-MRM assays using stable isotope labeled standards were able to consistently quantify 36 of the peptides in human serum at median serum concentrations ranging from 320 to 5.5 ng/mL. Such informative assays achieve excellent performance in relevant biomedical contexts but, admittedly, cannot distinguish in their current format between changes in the quantity of protein and changes in occupancy [96]. We conclude this section with a brief discussion of MRM assays of detached glycans. Targeted assays of site-specific protein glycoforms will be discussed in the following section.
Zhang et al., introduced LC-MS/MS-SRM quantification of detached glycans based on PNGaseF-catalyzed release of N-glycans, reductive amination of the reducing end with aniline, PGC separation of labeled glycans, and quantification of common glycan fragments (Y2, Y1, and the oxonium ion at m/z 366) [71]. Introduction of anilin-d5 by reductive amination created a set of isotopically labeled standards for improved quantification. A library of SRM assays was developed based on prior knowledge and Zhang et al., discuss that their approach is analogous to targeted protein quantification. This MRM workflow achieved resolution of isomers by capillary flow PGC chromatography and attomole sensitivity. The authors were able to quantify 98 different glycan compositions and resolve 162 isomers in a study of pancreatic cancer, detecting glycans in as few as 100 cells. PGC-based isomer separation with MS detection has been used by others for profiling of detached glycans [111]. Since the MRM methods use same set of fragments for all analytes, it is not clear whether this detection mode offers much benefit compared to the previously reported MS1 assays besides, perhaps, an increase in sensitivity. Quantification of ions in MS1 is typically preferred because fragmentation is structure dependent and introduces bias into relative quantification of glycans (profiles). Fragment-based methods, however, have the advantage that they may be able to provide structural resolution in positive or negative ionization mode. Negative ionization is rarely explored in quantitative analysis of glycans [112] but informative fragmentation in negative ion MS is well documented [113–115]. Accurate quantification of specific glycans between samples (e.g. disease groups) has its own benefits and the merits of profiling or targeted MRM assays must be considered with respect to the specific research context. Jensen et al., describe use of exoglycosidases in structural resolution of glycans, a strategy that may be useful for MRM assays, too [116]. Additional separation could be achieved by introduction of ion mobility selection into the quantitative workflows [117,118]. And last but not least, chemists get progressively closer to producing synthetic standards that are expected to facilitate development of targeted assays [119, 120]. If we replace the aniline label with a peptide, we can immediately draw parallels with the quantification of site-specific protein glycoforms discussed in the next section.
7 MRM quantification of glycopeptides
Quantification of site-specific glycoforms of proteins provides a more specific measurement than is possible for detached glycans or deglycosylated peptides. For analysis by MRM, glycopeptides must be ionized and produce specific, quantifiable fragments. Efficiency of ionization depends primarily on the peptide but is also significantly affected by the attached glycan [79]. Enrichment of microheterogeneous glycopeptides improves detectability against a complex peptide background. It is important to note that the proteolytic digest of any glycoprotein is a relatively complex mixture [64,65] and quantification of minor glycoforms can be a challenge even in digests of purified proteins [121].
PGC [34, 37] and HILIC [25, 85, 122] offer efficient-mixed mode chromatographic enrichment, in addition to lectins and hydrazide capture discussed above. PGC separates glycoconjugates based on size, polarity, and structure (glycan linkage) [123]. PGC has been used by many groups to separate carbohydrates and their isomers [116,124] but the sorbent is versatile enough to separate glycopeptides, especially short glycopeptides generated by nonspecific proteases [34]. HILIC is a family of resins (mostly silica and its derivatives) that primarily exploit hydrophilic interactions [37]. HILIC (chromatography or SPE) separates O- from N-glycopeptides more efficiently than PGC, is less affected by the peptide, and minimizes the N-glycopeptide loss observed with PGC [25, 122, 125]. HILIC has been used primarily as the first dimension of glycopeptide enrichment for RP nano-LC-MS; nanoflow HILIC columns are less efficient and are not commercially available [93,126]. Nonetheless, 2D-LC-MRM of prostate specific antigen in human plasma with a HILIC-MS interface achieved 1 ng/mL sensitivity. The advantage of glycopeptide separation by RP is the peptide-driven retention-time that leads to coelution of a peptide and its glycoforms in a narrow chromatographic window [93,126] (Fig. 4).
Figure 4.
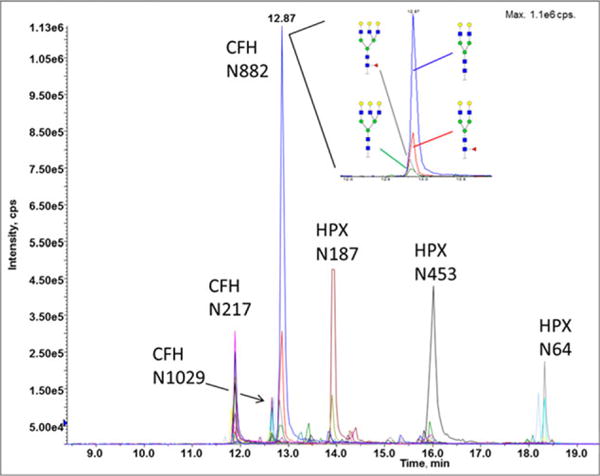
Site-specific glycoforms of sialidase treated hemopexin (HPX) and complement factor H (CFH) separated by RP chromatography and detected by MRM-MS. Inset: composition of four coeluting glycoforms quantified at glycosite N882 of CFH. Structural schemes: blue square (N-acetylglucosamine), red triangle (fucose), green circle (mannose), yellow circle (galactose), and purple diamond (N-acetylneuraminic acid).
Retention time can be used as an efficient identification constraint and the concepts of iRT/scheduled MRM adopted from peptide workflows.
Fragmentation of glycopeptides is a critical element of glycopeptide MRM design. We focus on current MRM workflows that rely almost exclusively on CID fragmentation in positive ion mode. Glycosidic bonds are more susceptible to CID fragmentation than peptides [88,127] and typical MS/MS spectra of complex N-glycopeptides are dominated by intense glycan fragments (B-type oxonium ions) with some contribution of the glycosylated peptide (Y-ions) and minor peptide b-and y-ions (Fig. 5).
Figure 5.
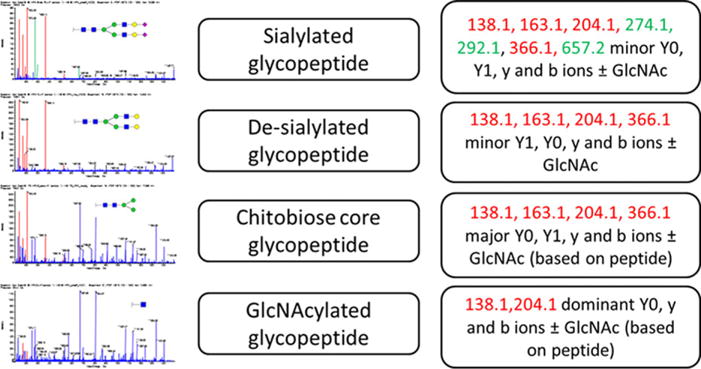
Typical B-oxonium ions, peptide (Y0), and peptide GlcNAc (Y1) ions, and y/b ± GlcNAc peptide backbone fragments observed in CID spectra of N-glycopeptides. Color of letters corresponds to color of ions in the figure. Structural schemes: blue square (N-acetylglucosamine), red triangle (fucose), green circle (mannose), yellow circle (galactose), and purple diamond (N-acetylneuraminic acid).
The extent of b- and y-ion fragmentation observed depends on the peptide sequence but the size and structure of the attached glycan is another major factor. With successive trimming of the glycopeptide by exoglycosidases, the spectra of the same glycopeptide can change from being dominated by B-oxonium ions to being dominated by Y-ions (Y1, peptide-GlcNAc or Y0, peptide +) and y- and b-ions (peptide fragments). The outer arm GlcNAc contributes most to the intense oxonium ions; when the glycan is trimmed to the chitobiose core, the Y1 ion becomes most intense. Y0 is a major fragment of peptide-GlcNAc precursors. O-glycopeptides are typically smaller and less branched; a major fragment of the less stable O-glycosidic bond is typically the Y0 fragment (Fig. 6) [31, 128]. Distribution of these CID fragments also depends on the instrument and acquisition parameters, especially collision energy, a major part of assay optimization [88,121,128].
Figure 6.
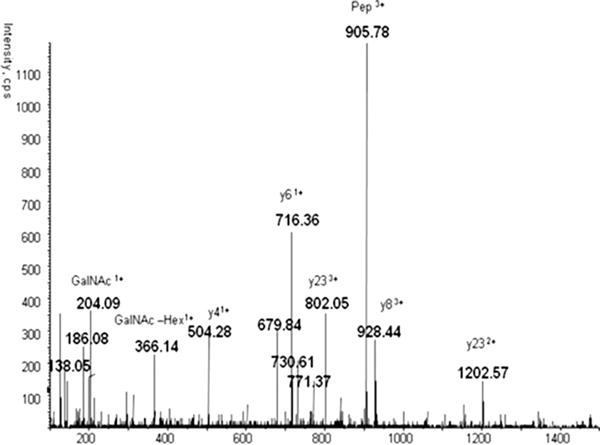
MS2 CID spectrum of an O-glycopeptide of hemopexin. Reprinted with permission from [127]. Copyright 2013 WILEY-VCH Verlag GmbH & Co. KGaA.
With this in mind, we discuss recent papers on MRM of glycopeptides [75, 121, 128–131]. Kurogochi et al., used reverse glycobloting to enrich sialylated glycopeptides from mouse serum [75]. Sixty-seven glycopeptides derived from 26 glycoproteins were identified by MS/MS and by comparison to chromatographic retention-time of deglycosylated peptides; however, the retention-time shown for PA-labeled and deglycosylated peptide pair differ by 4 min. Y1 fragments were selected for monitoring and collision energy (CE) optimized to maximize sensitivity; a series of ions typical for PA-labeled sialylated glycopeptides was observed as well. Yolk egg glycopeptide standard labeled with PA was used for method validation and showed linearity in the range of 1–6 pmol while 25 glycopeptides derived from abundant serum proteins were quantified with CV<20%. Complexity of the background likely limited accuracy of quantification even with the elegant enrichment; however, disease-related quantitative differences in sialylated transferrin were observed.
Song et al., showed that glycopeptides can be quantified by monitoring of B-oxonium ions and suggested that additional specific transitions for each precursor are not needed [129]. Optimization of CE was carried out on 17 glycopeptides of fetuin carrying 1–4 sialic acids by monitoring 1–3 transitions (138, 274, and 657 Da). It is not clear why two ions specific to sialylated structures were chosen in combination with the 138 fragment of HexNAc for general monitoring of glycoforms. The authors conclude that relative intensities (profiles) are reliably quantified by comparing measured values with literature reports of others; however, glycan fragmentation is known to be structure-dependent and relative intensities not typically quantified by MRM-MS [131]. The authors further suggest that uniform CE (normalized CE of 40%) is optimal for any glycopeptide that has yet to be corroborated by others. While a proof of principle measurement in serum is shown, we believe that the general applicability of a workflow using only the 138, 274, and 657 Da ions will not be adequate.
Toyama et al. thoroughly evaluated the oxonium ion yield with increasing CE using glycopeptides isolated by 2D HPLC from a tryptic digest of monoclonal antibodies and quantified by UV absorbance [132]. Oxonium ions were measured at CE 25–125 eV and the 138 Da HexNAc fragment found to have similar yield curve for all glycan structures, regardless of the number of GlcNAc monosaccharides in the glycan. Differences in the yield of the m/z 366 ion distinguished α1,3 and 1,6 galactose linkage to GlcNAc. The m/z 138 provided a common monitoring ion for IgG quantification, with LOD of 30 attomole injected, linearity over four orders of magnitude, and tenfold higher intensity than the corresponding optimal transition of the peptide EEQYNSTYR. The optimal CEs were, however, much higher than is commonly used. It is interesting to note that such high CEs were also used by Lee et al., to observe otherwise undetectable reporter ions of tandem mass tags labeled glycopeptides [133].
Targeted quantification of core fucosylated glycopeptides was examined by Zhao et al., using glycans trimmed with endoglycosidase F3 (Endo F3) [130]. This is an interesting development showing that specific structural motifs (core fucosylation in this case) can be quantified by a combination of glycosidase digests of glycopeptides in combination with MRM. At CE <30, dominant fragment was the Y0 peptide ion; at CE <30, 40>, peptide b, y, bg, and yg ions were observed; and at CE >50, fragments of the glycans, including m/z 138, were observed. Y0 and peptide fragments could be monitored efficiently with a linear response over three orders of magnitude. Presence of the GlcNAc-fucose on these peptides did not affect peptide fragmentation. The authors suggest that labeling with 18O during tryptic digestion can be used to generate labeled quantification standards and present a proof of principle quantification of Endo F3 treated glycopeptides in serum.
Hong et al., took advantage of high intensity oxonium ions to quantify IgG glycopeptides directly in digests of serum [131]. Ions m/z 204 and 366 were used for quantification and CE was optimized based on precursor mass (range 13–25 eV). A detection limit of 60 amol and linear response over three orders of magnitude were demonstrated, with intraday CVs <6%. Higher interday CVs for some glycoforms were attributed to the tryptic digest. Proteotypic peptides of IgG subclasses 1–4 were monitored simultaneously and glycoforms were normalized to the quantity of protein. The authors point out that MRM-MS is less appropriate for comparison of relative glycoform amounts and use MS scans for this purpose [62,64].
We have analyzed site-specific glycoforms of haptoglobin [128]. We were interested in quantification of low abundance (<1% total) fucosylated glycoforms observed in connection with liver disease [126]. To minimize interference and ionization suppression, haptoglobin was isolated from serum. Structure-specific optimization of CE was used to maximize sensitivity of quantification by B-oxonium ions while ensuring specificity by peptide-specific ions and retention times (Fig. 7). The suitability of transition ions depends on glycan structure, peptide sequence, and structure-specific optimization of CE for each glycopeptide. In the absence of labeled glycopeptide standards, intensities are normalized to a haptoglobin peptide known to be stable across comparison groups. To resolve the glycoform structure, structure-specific ions (e.g. m/z 512 of fucosylated structures) and exoglycosidase digests of the glycopeptides were used. Application of exoglycosidases to the resolution of glycopeptide structures, especially isobaric linkage isoforms, is an important technique with broad applicability, as for the well-developed analyses of detached glycans [134]. We specifically quantified Le-Y type glycoforms, in trace amounts, in clinical samples with the help of appropriate glycosidases [121].
Figure 7.
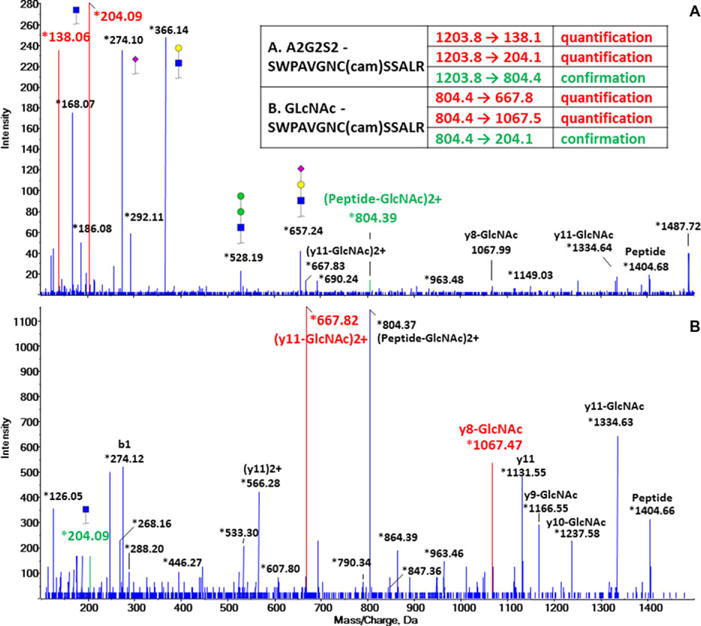
Selection of transitions for quantification and confirmation based on CID spectrum of (A) biantennary sialylated glycopeptide (A2G2S2); (B) GlcNAc-glycopeptide generated by Endo F3. Inset: Sequence of the peptide and selected transitions for each glycopeptide are tabulated.
These studies collectively show that quantification of glycoforms by LC-MS/MS-MRM is feasible. The ability to quantify minor glycoforms in simple protein mixtures with linkage resolved by glycosidases and fragmentation is an important development. Monitoring of intense oxonium ions allows detection of abundant protein-glycoforms in matrices as complex as serum, though specificity may be difficult to maintain under such conditions for less abundant analytes. Lack of appropriate standards limits options for optimization of assay conditions but new developments in the synthesis of glycans and glycopeptides are expected to accelerate progress in this area [79,120].
Additional increases in sensitivity and specificity can be achieved for appropriate glycopeptides by MS3 quantification [135]. We have used MS3 on the 4000 QTRAP (AB Sciex) to quantify O-glycoforms of hemopexin. CID fragmentation of O-glycopeptides typically generates a dominant Y0 ion that can be selected for ion-trap fragmentation (Fig. 6) [31,88]. We have used the sum of three linear ion trap peptide fragments (at m/z 716.3, 802.4, 100.5) to show a fivefold increase in sensitivity of detection of a minor glycoform of hemopexin by the MRM cubed workflow compared to MRM quantification of the Y0 and y-ions observed in MS2. The results show that MRM and MS3 are feasible strategies for quantification of O-glycopeptides with the added specificity of more abundant peptide fragments. MRM and MS3 workflows for quantification of site-specific protein glycoforms are summarized in Fig. 8.
Figure 8.
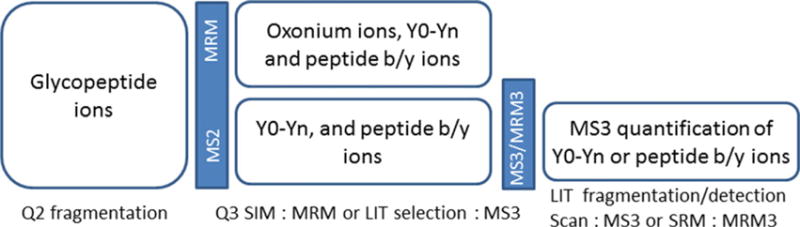
Schematic of MRM and MS3 workflows for quantification of glycopeptides.
In summary, quantification of proteins by LC-MS/MS-MRM is a well-established procedure that can be efficiently adopted for quantification of site-specific protein glycoforms. Enrichment of target proteins minimizes suppression of ionization and improves specificity of quantification of minor glycoforms that could be affected by coeluting glycopeptides or abundant peptides. Glycopeptide and glycoform-specific optimization of assay conditions improves both sensitivity and specificity of detection. With the introduction of SIS glycopeptide standards and reliable enrichment strategies, the MRM and MS3 assays are expected to provide sensitive quantification of even minor site-specific glycoforms.
Acknowledgments
This review is dedicated to our parents and families who make our work feasible and enjoyable. We want to thank Dr. Rejtar for expert introduction to quantitative glycoproteomics, Dr. Gilar for informative discussions of HILIC chromatography, and Dr. Edwards for useful comments on the manuscript. This work was supported by Grants UO1 CA168926 and RO1 CA135069.
Abbreviations
- CE
collision energy
- GalNAc
N-acetylgalactosamine
- GlcNAc
N-acetylglucosamine
- GWAS
genome-wide association study
- HexNAc
N-acetylhexosamine
- HILIC
hydrophilic interaction chromatography
- iSRM
intelligent SRM
- OST
oligosaccharyl transferase
- PGC
porous graphitized carbon
- QTOF
quadrupole TOF
- SIS
stable isotope standard
- SISCAPA
stable isotope standards captured by anti-peptide antibodies
- UPLC
ultra-performance LC
- SRM
selected reaction monitoring
Footnotes
References
- 1.Anderson L, Hunter CL. Quantitative mass spectrometric multiple reaction monitoring assays for major plasma proteins. Mol Cell Proteomics. 2006;5:573–588. doi: 10.1074/mcp.M500331-MCP200. [DOI] [PubMed] [Google Scholar]
- 2.Picotti P, Aebersold R. Selected reaction monitoringbased proteomics: workflows, potential, pitfalls and future directions. Methods. 2012;9:555–566. doi: 10.1038/nmeth.2015. [DOI] [PubMed] [Google Scholar]
- 3.Carr SA, Abbatiello SE, Ackermann BL, Borchers C, et al. Targeted peptide measurements in biology and medicine: best practices for mass spectrometry-based assay development using a fit-for-purpose approach. Mol Cell Proteomics. 2014;13:907–917. doi: 10.1074/mcp.M113.036095. [DOI] [PMC free article] [PubMed] [Google Scholar]
- 4.Kuzyk MA, Smith D, Yang J, Cross TJ, et al. Multiple reaction monitoring-based, multiplexed, absolute quantitation of 45 proteins in human plasma. Mol Cell Proteomics. 2009;8:1860–1877. doi: 10.1074/mcp.M800540-MCP200. [DOI] [PMC free article] [PubMed] [Google Scholar]
- 5.Gallien S, Duriez E, Domon B. Selected reaction monitoring applied to proteomics. J Mass Spectrom. 2011;46:298–312. doi: 10.1002/jms.1895. [DOI] [PubMed] [Google Scholar]
- 6.Kuhn E, Whiteaker JR, Mani DR, Jackson AM, et al. Interlaboratory evaluation of automated, multiplexed peptide immunoaffinity enrichment coupled to multiple reaction monitoring mass spectrometry for quantifying proteins in plasma. Mol Cell Proteomics. 2012;11:M111. doi: 10.1074/mcp.M111.013854. [DOI] [PMC free article] [PubMed] [Google Scholar]
- 7.Shi T, Fillmore TL, Sun X, Zhao R, et al. Antibody-free, targeted mass-spectrometric approach for quantification of proteins at low picogram per milliliter levels in human plasma/serum. Proc Natl Acad Sci USA. 2012;109:15395–15400. doi: 10.1073/pnas.1204366109. [DOI] [PMC free article] [PubMed] [Google Scholar]
- 8.Burgess MW, Keshishian H, Mani DR, Gillette MA, Carr SA. Simplified and efficient quantification of low-abundance proteins at very high multiplex via targeted mass spectrometry. Mol Cell Proteomics. 2014;13:1137–1149. doi: 10.1074/mcp.M113.034660. [DOI] [PMC free article] [PubMed] [Google Scholar]
- 9.Aebersold R, Mann M. Mass spectrometry-based proteomics. Nature. 2003;422:198–207. doi: 10.1038/nature01511. [DOI] [PubMed] [Google Scholar]
- 10.Kusebauch U, Deutsch EW, Campbell DS, Sun Z, et al. Using PeptideAtlas, SRMAtlas, and PASSEL: comprehensive resources for discovery and targeted proteomics. Curr Protoc Bioinformatics. 2014;46:13. doi: 10.1002/0471250953.bi1325s46. [DOI] [PMC free article] [PubMed] [Google Scholar]
- 11.Dennis JW, Nabi IR, Demetriou M. Metabolism cell surface organization disease. Cell. 2009;139:1229–1241. doi: 10.1016/j.cell.2009.12.008. [DOI] [PMC free article] [PubMed] [Google Scholar]
- 12.Gagneux P, Amess B, Diaz S, Moore S, et al. Proteomic comparison of human and great ape blood plasma reveals conserved glycosylation and differences in thyroid hormone metabolism. Am J Phys Anthropol. 2001;115:99–109. doi: 10.1002/ajpa.1061. [DOI] [PubMed] [Google Scholar]
- 13.Pang PC, Chiu PCN, Lee CL, Chang LY, et al. Human sperm binding is mediated by the Sialyl-Lewis(x) oligosaccharide on the zona pellucida. Science. 2011;333:1761–1764. doi: 10.1126/science.1207438. [DOI] [PubMed] [Google Scholar]
- 14.Cummings RD. The repertoire of glycan determinants in the human glycome. Mol Biosyst. 2009;5:1087–1104. doi: 10.1039/b907931a. [DOI] [PubMed] [Google Scholar]
- 15.Cummings RD, Pierce JM. The challenge promise of glycomics. Chem Biol. 2014;21:1–15. doi: 10.1016/j.chembiol.2013.12.010. [DOI] [PMC free article] [PubMed] [Google Scholar]
- 16.Helenius A, Aebi M. Intracellular functions of N-linked glycans. Science. 2001;291:2364–2369. doi: 10.1126/science.291.5512.2364. [DOI] [PubMed] [Google Scholar]
- 17.Dempski RE, Jr, Imperiali B. Oligosaccharyl transferase: gatekeeper to the secretory pathway. Curr Opin Chem Biol. 2002;6:844–850. doi: 10.1016/s1367-5931(02)00390-3. [DOI] [PubMed] [Google Scholar]
- 18.Mazumder R, Morampudi KS, Motwani M, Vasudevan S, Goldman R. Proteome-wide analysis of single-nucleotide variations in the N-glycosylation sequon of human genes. PLoS One. 2012;7:e36212. doi: 10.1371/journal.pone.0036212. [DOI] [PMC free article] [PubMed] [Google Scholar]
- 19.Lam PV, Goldman R, Karagiannis K, Narsule T, et al. Structure-based comparative analysis and prediction of N-linked glycosylation sites in evolutionarily distant eukaryotes. Genomics Proteomics Bioinformatics. 2013;11:96–104. doi: 10.1016/j.gpb.2012.11.003. [DOI] [PMC free article] [PubMed] [Google Scholar]
- 20.Zhang H, Li XJ, Martin DB, Aebersold R. Identification and quantification of N-linked glycoproteins using hydrazide chemistry, stable isotope labeling mass spectrometry. Nat Biotechnol. 2003;21:660–666. doi: 10.1038/nbt827. [DOI] [PubMed] [Google Scholar]
- 21.Liu T, Qian WJ, Gritsenko MA, Camp DG, et al. Human plasma N-glycoproteome analysis by immunoaffinity subtraction, hydrazide chemistry, and mass spectrometry. J Proteome Res. 2005;4:2070–2080. doi: 10.1021/pr0502065. [DOI] [PMC free article] [PubMed] [Google Scholar]
- 22.Zielinska DF, Gnad F, Wisniewski JR, Mann M. Precision mapping of an in vivo N-glycoproteome reveals rigid topological sequence constraints. Cell. 2010;141:897–907. doi: 10.1016/j.cell.2010.04.012. [DOI] [PubMed] [Google Scholar]
- 23.Kaji H, Shikanai T, Sasaki-Sawa A, Wen H, et al. Large-scale identification of N-glycosylated proteins of mouse tissues and construction of a glycoprotein database, Glyco-ProtDB. J Proteome Res. 2012;11:4553–4566. doi: 10.1021/pr300346c. [DOI] [PubMed] [Google Scholar]
- 24.Bennett EP, Mandel U, Clausen H, Gerken TA, et al. Control of mucin-type O-glycosylation: a classification of the polypeptide GalNAc-transferase gene family. Glycobiology. 2012;22:736–756. doi: 10.1093/glycob/cwr182. [DOI] [PMC free article] [PubMed] [Google Scholar]
- 25.Thaysen-Andersen M, Packer NH. Advances in LC-MS/MS-based glycoproteomics: getting closer to system-wide site-specific mapping of the N-O-glycoproteome. Biochim Biophys Acta. 2014;1844:1437–1452. doi: 10.1016/j.bbapap.2014.05.002. [DOI] [PubMed] [Google Scholar]
- 26.Xia B, Royall JA, Damera G, Sachdev GP, Cummings RD. Altered O-glycosylation sulfation of airway mucins associated with cystic fibrosis. Glycobiology. 2005;15:747–775. doi: 10.1093/glycob/cwi061. [DOI] [PubMed] [Google Scholar]
- 27.Steentoft C, Vakhrushev SY, Vester-Christensen MB, Schjoldager KT, et al. Mining the O-glycoproteome using zinc-finger nuclease-glycoengineered SimpleCell lines. Nat Methods. 2011;8:977–982. doi: 10.1038/nmeth.1731. [DOI] [PubMed] [Google Scholar]
- 28.Chandler K, Goldman R. Glycoprotein disease markers and single proteinomics. Mol Cell Proteomics. 2013;12:836–845. doi: 10.1074/mcp.R112.026930. [DOI] [PMC free article] [PubMed] [Google Scholar]
- 29.Hudak JE, Bertozzi CR. Glycotherapy: new advances inspire a reemergence of glycans in medicine. Chem Biol. 2014;21:16–37. doi: 10.1016/j.chembiol.2013.09.010. [DOI] [PMC free article] [PubMed] [Google Scholar]
- 30.Pan S, Chen R, Aebersold R, Brentnall TA. Mass spectrometry based glycoproteomics—from a proteomics perspective. Mol Cell Proteomics. 2011;10:R110. doi: 10.1074/mcp.R110.003251. [DOI] [PMC free article] [PubMed] [Google Scholar]
- 31.Zauner G, Kozak RP, Gardner RA, Fernandes DL, et al. Protein O-glycosylation analysis. Biol Chem. 2012;393:687–708. doi: 10.1515/hsz-2012-0144. [DOI] [PubMed] [Google Scholar]
- 32.Frost DC, Li L. Recent advances in mass spectrometry-based glycoproteomics. Adv Protein Chem Struct Biol. 2014;95:71–123. doi: 10.1016/B978-0-12-800453-1.00003-8. [DOI] [PubMed] [Google Scholar]
- 33.Jacobs PP, Callewaert N. N-glycosylation engineering of biopharmaceutical expression systems. Curr Mol Med. 2009;9:774–800. doi: 10.2174/156652409789105552. [DOI] [PubMed] [Google Scholar]
- 34.Hua S, Hu CY, Kim BJ, Totten SM, et al. Glycoanalytical multispecific proteolysis (Glyco-AMP): a simple method for detailed and quantitative glycoproteomic characterization. J Proteome Res. 2013;12(10):4414–4423. doi: 10.1021/pr400442y. [DOI] [PubMed] [Google Scholar]
- 35.Chaubard JL, Krishnamurthy C, Yi W, Smith DF, Hsieh-Wilson LC. Chemoenzymatic probes for detecting and imaging fucose-alpha(1–2)-galactose glycan biomarkers. J Am Chem Soc. 2012;134:4489–4492. doi: 10.1021/ja211312u. [DOI] [PMC free article] [PubMed] [Google Scholar]
- 36.Pratt MR, Bertozzi CR. Synthetic glycopeptides and glycoproteins as tools for biology. Chem Soc Rev. 2005;34:58–68. doi: 10.1039/b400593g. [DOI] [PubMed] [Google Scholar]
- 37.Alley WR, Jr, Mann BF, Novotny MV. High-sensitivity analytical approaches for the structural characterization of glycoproteins. Chem Rev. 2013;113:2668–2732. doi: 10.1021/cr3003714. [DOI] [PMC free article] [PubMed] [Google Scholar]
- 38.North SJ, Hitchen PG, Haslam SM, Dell A. Mass spectrometry in the analysis of N-linked and O-linked glycans. Curr Opin Struct Biol. 2009;19:498–506. doi: 10.1016/j.sbi.2009.05.005. [DOI] [PMC free article] [PubMed] [Google Scholar]
- 39.Harvey DJ. Derivatization of carbohydrates for analysis by chromatography; electrophoresis and mass spectrometry. J Chromatogr B Analyt Technol Biomed Life Sci. 2011;879:1196–1225. doi: 10.1016/j.jchromb.2010.11.010. [DOI] [PubMed] [Google Scholar]
- 40.Reinhold V, Zhang H, Hanneman A, Ashline D. Toward a platform for comprehensive glycan sequencing. Mol Cell Proteomics. 2013;12:866–873. doi: 10.1074/mcp.R112.026823. [DOI] [PMC free article] [PubMed] [Google Scholar]
- 41.Kailemia MJ, Ruhaak LR, Lebrilla CB, Amster IJ. Oligosaccharide analysis by mass spectrometry: a review of recent developments. Anal Chem. 2014;86:196–212. doi: 10.1021/ac403969n. [DOI] [PMC free article] [PubMed] [Google Scholar]
- 42.Bern M, Brito AE, Pang PC, Rekhi A, et al. Poly-lactosaminoglycan glycomics: enhancing the detection of high-molecular-weight N-glycans in matrix-assisted laser desorption ionization time-of-flight profiles by matched filtering. Mol Cell Proteomics. 2013;12:996–1004. doi: 10.1074/mcp.O112.026377. [DOI] [PMC free article] [PubMed] [Google Scholar]
- 43.Canis K, McKinnon TA, Nowak A, Haslam SM, et al. Mapping the N-glycome of human von Willebrand factor. Biochem J. 2012;447:217–228. doi: 10.1042/BJ20120810. [DOI] [PubMed] [Google Scholar]
- 44.Cheng PF, Snovida S, Ho MY, Cheng CW, et al. Increasing the depth of mass spectrometry-based glycomic coverage by additional dimensions of sulfoglycomics and target analysis of permethylated glycans. Anal Bioanal Chem. 2013;405:6683–6695. doi: 10.1007/s00216-013-7128-2. [DOI] [PubMed] [Google Scholar]
- 45.Ashline DJ, Hanneman AJ, Zhang H, Reinhold VN. Structural documentation of glycan epitopes: sequential mass spectrometry and spectral matching. J Am Soc Mass Spectrom. 2014;25:444–453. doi: 10.1007/s13361-013-0776-9. [DOI] [PMC free article] [PubMed] [Google Scholar]
- 46.Campbell MP, Ranzinger R, Lutteke T, Mariethoz J, et al. Toolboxes for a standardised and systematic study of glycans. BMC Bioinformatics. 2014;15:S9. doi: 10.1186/1471-2105-15-S1-S9. [DOI] [PMC free article] [PubMed] [Google Scholar]
- 47.Trinidad JC, Schoepfer R, Burlingame AL, Medzihradszky KF. N- and O-glycosylation in the murine synaptosome. Mol Cell Proteomics. 2013;12:3474–3488. doi: 10.1074/mcp.M113.030007. [DOI] [PMC free article] [PubMed] [Google Scholar]
- 48.Chandler KB, Pompach P, Goldman R, Edwards N. Exploring site-specific N-glycosylation microheterogeneity of haptoglobin using glycopeptide CID tandem mass spectra and glycan database search. J Proteome Res. 2013;12:3652–3666. doi: 10.1021/pr400196s. [DOI] [PMC free article] [PubMed] [Google Scholar]
- 49.Rudd PM, Dwek RA. Glycosylation: heterogeneity and the 3D structure of proteins. Crit Rev Biochem Mol Biol. 1997;32:1–100. doi: 10.3109/10409239709085144. [DOI] [PubMed] [Google Scholar]
- 50.Tran DT, Ten Hagen KG. Mucin-type O-glycosylation during development. J Biol Chem. 2013;288:6921–6929. doi: 10.1074/jbc.R112.418558. [DOI] [PMC free article] [PubMed] [Google Scholar]
- 51.Angata T, Fujinawa R, Kurimoto A, Nakajima K, et al. Integrated approach toward the discovery of glyco-biomarkers of inflammation-related diseases. Ann NY Acad Sci. 2012;1253:159–169. doi: 10.1111/j.1749-6632.2012.06469.x. [DOI] [PubMed] [Google Scholar]
- 52.Tharmalingam T, Adamczyk B, Doherty MA, Royle L, Rudd PM. Strategies for the profiling, characterisation and detailed structural analysis of N-linked oligosaccharides. Glycoconj J. 2013;30:137–146. doi: 10.1007/s10719-012-9443-9. [DOI] [PubMed] [Google Scholar]
- 53.Orlando R. Quantitative glycomics. Methods Mol Biol. 2010;600:31–49. doi: 10.1007/978-1-60761-454-8_3. [DOI] [PubMed] [Google Scholar]
- 54.Knezevic A, Polasek O, Gornik O, Rudan I, et al. Variability, heritability and environmental determinants of human plasma N-glycome. J Proteome Res. 2009;8:694–701. doi: 10.1021/pr800737u. [DOI] [PubMed] [Google Scholar]
- 55.Lauc G, Essafi A, Huffman JE, Hayward C, et al. Genomics meets glycomics-the first GWAS study of human N-Glycome identifies HNF1alpha as a master regulator of plasma protein fucosylation. PLoS Genet. 2010;6:e1001256. doi: 10.1371/journal.pgen.1001256. [DOI] [PMC free article] [PubMed] [Google Scholar]
- 56.Ahn J, Bones J, Yu YQ, Rudd PM, Gilar M. Separation of 2-aminobenzamide labeled glycans using hydrophilic interaction chromatography columns packed with 1.7 μm sorbent. J Chromatogr B. 2010;878:403–408. doi: 10.1016/j.jchromb.2009.12.013. [DOI] [PubMed] [Google Scholar]
- 57.Marino K, Bones J, Kattla JJ, Rudd PM. A systematic approach to protein glycosylation analysis: a path through the maze. Nat Chem Biol. 2010;6:713–723. doi: 10.1038/nchembio.437. [DOI] [PubMed] [Google Scholar]
- 58.Lauc G, Huffman JE, Pucic M, Zgaga L, et al. Loci associated with N-glycosylation of human immunoglobulin G show pleiotropy with autoimmune diseases and haematological cancers. PLoS Genet. 2013;9:e1003225. doi: 10.1371/journal.pgen.1003225. [DOI] [PMC free article] [PubMed] [Google Scholar]
- 59.Callewaert N, Van Vlierberghe H, Van Hecke A, Laroy W, et al. Noninvasive diagnosis of liver cirrhosis using DNA sequencer-based total serum protein glycomics. Nat Med. 2004;10:429–434. doi: 10.1038/nm1006. [DOI] [PubMed] [Google Scholar]
- 60.Klein A, Carre Y, Louvet A, Michalski JC, Morelle W. Immunoglobulins are the major glycoproteins involved in the modifications of total serum N-glycome in cirrhotic patients. Proteomics Clin Appl. 2010;4:379–393. doi: 10.1002/prca.200900133. [DOI] [PubMed] [Google Scholar]
- 61.Bekesova S, Kosti O, Chandler KB, Wu J, et al. N-glycans in liver-secreted and immunoglogulin-derived protein fractions. J Proteomics. 2012;75:2216–2224. doi: 10.1016/j.jprot.2012.01.024. [DOI] [PMC free article] [PubMed] [Google Scholar]
- 62.Bakovic MP, Selman MH, Hoffmann M, Rudan I, et al. High-throughput IgG Fc N-glycosylation profiling by mass spectrometry of glycopeptides. J Proteome Res. 2013;12:821–831. doi: 10.1021/pr300887z. [DOI] [PubMed] [Google Scholar]
- 63.Huffman JE, Pucic-Bakovic M, Klaric L, Hennig R, et al. Comparative performance of four methods for highthroughput glycosylation analysis of immunoglobulin G in genetic and epidemiological research. Mol Cell Proteomics. 2014;13:1598–1610. doi: 10.1074/mcp.M113.037465. [DOI] [PMC free article] [PubMed] [Google Scholar]
- 64.Selman MH, Derks RJ, Bondt A, Palmblad M, et al. Fc specific IgG glycosylation profiling by robust nano-reverse phase HPLC-MS using a sheath-flow ESI sprayer interface. J Proteomics. 2012;75:1318–1329. doi: 10.1016/j.jprot.2011.11.003. [DOI] [PubMed] [Google Scholar]
- 65.Plomp R, Hensbergen PJ, Rombouts Y, Zauner G, et al. Site-specific N-glycosylation analysis of human immunoglobulin e. J Proteome Res. 2014;13:536–546. doi: 10.1021/pr400714w. [DOI] [PubMed] [Google Scholar]
- 66.Nettleton MY, Kochan JP. Role of glycosylation sites in the IgE Fc molecule. Int Arch Allergy Immunol. 1995;107:328–329. doi: 10.1159/000237017. [DOI] [PubMed] [Google Scholar]
- 67.Defaus S, Gupta P, Andreu D, Gutierrez-Gallego R. Mammalian protein glycosylation–structure versus function. Analyst. 2014;139:2944–2967. doi: 10.1039/c3an02245e. [DOI] [PubMed] [Google Scholar]
- 68.Zhang Y, Yin H, Lu H. Recent progress in quantitative glycoproteomics. Glycoconj J. 2012;29:249–258. doi: 10.1007/s10719-012-9398-x. [DOI] [PubMed] [Google Scholar]
- 69.Wuhrer M. Glycomics using mass spectrometry. Glycoconj J. 2013;30:11–22. doi: 10.1007/s10719-012-9376-3. [DOI] [PMC free article] [PubMed] [Google Scholar]
- 70.Delaney J, Vouros P. Liquid chromatography ion trap mass spectrometric analysis of oligosaccharides using permethylated derivatives. Rapid Commun Mass Spectrom. 2001;15:325–334. doi: 10.1002/rcm.230. [DOI] [PubMed] [Google Scholar]
- 71.Zhang H, Wang Z, Stupak J, Ghribi O, et al. Targeted glycomics by selected reaction monitoring for highly sensitive glycan compositional analysis. Proteomics. 2012;12:2510–2522. doi: 10.1002/pmic.201100567. [DOI] [PMC free article] [PubMed] [Google Scholar]
- 72.Amano J, Nishikaze T, Tougasaki F, Jinmei H, et al. Derivatization with 1-pyrenyldiazomethane enhances ionization of glycopeptides but not peptides in matrix-assisted laser desorption/ionization mass spectrometry. Anal Chem. 2010;82:8738–8743. doi: 10.1021/ac101555a. [DOI] [PubMed] [Google Scholar]
- 73.Nishikaze T, Nakamura T, Jinmei H, Amano J. Negativeion MALDI-MS2 for discrimination of alpha2,3- and alpha2,6-sialylation on glycopeptides labeled with a pyrene derivative. J Chromatogr B Analyt Technol Biomed Life Sci. 2011;879:1419–1428. doi: 10.1016/j.jchromb.2010.10.032. [DOI] [PubMed] [Google Scholar]
- 74.Liu X, Qiu H, Lee RK, Chen W, Li J. Methylamidation for sialoglycomics by MALDI-MS: a facile derivatization strategy for both alpha2,3- and alpha2,6-linked sialic acids. Anal Chem. 2010;82:8300–8306. doi: 10.1021/ac101831t. [DOI] [PubMed] [Google Scholar]
- 75.Kurogochi M, Matsushista T, Amano M, Furukawa J, et al. Sialic acid-focused quantitative mouse serum glycoproteomics by multiple reaction monitoring assay. Mol Cell Proteomics. 2010;9:2354–2368. doi: 10.1074/mcp.M110.000430. [DOI] [PMC free article] [PubMed] [Google Scholar]
- 76.Deshpande N, Jensen PH, Packer NH, Kolarich D. GlycoSpectrumScan: fishing glycopeptides from MS spectra of protease digests of human colostrum sIgA. J Proteome Res. 2010;9:1063–1075. doi: 10.1021/pr900956x. [DOI] [PubMed] [Google Scholar]
- 77.van der Post S, Subramani DB, Backstrom M, Johansson ME, et al. Site-specific O-glycosylation on the MUC2 mucin protein inhibits cleavage by the Porphyromonas gingivalis secreted cysteine protease (RgpB) J Biol Chem. 2013;288:14636–14646. doi: 10.1074/jbc.M113.459479. [DOI] [PMC free article] [PubMed] [Google Scholar]
- 78.Lee B, Lopez-Ferrer D, Kim BC, Na HB, et al. Rapid and efficient protein digestion using trypsin-coated magnetic nanoparticles under pressure cycles. Proteomics. 2011;11:309–318. doi: 10.1002/pmic.201000378. [DOI] [PMC free article] [PubMed] [Google Scholar]
- 79.Stavenhagen K, Hinneburg H, Thaysen-Andersen M, Hartmann L, et al. Quantitative mapping of glycoprotein micro-heterogeneity and macro-heterogeneity: an evaluation of mass spectrometry signal strengths using synthetic peptides and glycopeptides. J Mass Spectrom. 2013;48:627–639. doi: 10.1002/jms.3210. [DOI] [PubMed] [Google Scholar]
- 80.Abbott KL, Pierce JM. Lectin-based glycoproteomic techniques for the enrichment and identification of potential biomarkers. Methods Enzymol. 2010;480:461–476. doi: 10.1016/S0076-6879(10)80020-5. [DOI] [PubMed] [Google Scholar]
- 81.Kaji H, Ocho M, Togayachi A, Kuno A, et al. Glycoproteomic discovery of serological biomarker candidates for HCV/HBV infection-associated liver fibrosis and hepatocellular carcinoma. J Proteome Res. 2013;12:2630–2640. doi: 10.1021/pr301217b. [DOI] [PubMed] [Google Scholar]
- 82.Nilsson J, Ruetschi U, Halim A, Hesse C, et al. Enrichment of glycopeptides for glycan structure and attachment site identification. Nat Methods. 2009;6:809–811. doi: 10.1038/nmeth.1392. [DOI] [PubMed] [Google Scholar]
- 83.Palmisano G, Lendal SE, Engholm-Keller K, Leth-Larsen R, et al. Selective enrichment of sialic acid-containing glycopeptides using titanium dioxide chromatography with analysis by HILIC and mass spectrometry. Nat Protoc. 2010;5:1974–1982. doi: 10.1038/nprot.2010.167. [DOI] [PubMed] [Google Scholar]
- 84.Parker BL, Palmisano G, Edwards AV, White MY, et al. Quantitative N-linked glycoproteomics of myocardial ischemia and reperfusion injury reveals early remodeling in the extracellular environment. Mol Cell Proteomics. 2011;10:M110. doi: 10.1074/mcp.M110.006833. [DOI] [PMC free article] [PubMed] [Google Scholar]
- 85.Cao J, Shen C, Wang H, Shen H, et al. Identification of N-glycosylation sites on secreted proteins of human hepatocellular carcinoma cells with a complementary proteomics approach. J Proteome Res. 2009;8:662–672. doi: 10.1021/pr800826u. [DOI] [PubMed] [Google Scholar]
- 86.Domon B, Costello CE. A systematic nomenclature for carbohydrate fragmentations in Fab-MS MS spectra of glycoconjugates. Glycoconj J. 1988;5:397–409. [Google Scholar]
- 87.Huddleston MJ, Bean MF, Carr SA. Collisional fragmentation of glycopeptides by electrospray ionization LC/MS and LC/MS/MS: methods for selective detection of glycopeptides in protein digests. Anal Chem. 1993;65:877–884. doi: 10.1021/ac00055a009. [DOI] [PubMed] [Google Scholar]
- 88.Wuhrer M, Catalina MI, Deelder AM, Hokke CH. Glycoproteomics based on tandem mass spectrometry of glycopeptides. J Chromatogr B Analyt Technol Biomed Life Sci. 2007;849:115–128. doi: 10.1016/j.jchromb.2006.09.041. [DOI] [PubMed] [Google Scholar]
- 89.Zubarev RA, Kelleher NL, McLafferty FW. Electron capture dissociation of multiply charged protein cations. A nonergodic process. J Am Chem Soc. 1998;120:3265–3266. [Google Scholar]
- 90.Syka JE, Coon JJ, Schroeder MJ, Shabanowitz J, Hunt DF. Peptide and protein sequence analysis by electron transfer dissociation mass spectrometry. Proc Natl Acad Sci USA. 2004;101:9528–9533. doi: 10.1073/pnas.0402700101. [DOI] [PMC free article] [PubMed] [Google Scholar]
- 91.Hogan JM, Pitteri SJ, Chrisman PA, McLuckey SA. Complementary structural information from a tryptic N-linked glycopeptide via electron transfer ion/ion reactions and collision-induced dissociation. J Proteome Res. 2005;4:628–632. doi: 10.1021/pr049770q. [DOI] [PMC free article] [PubMed] [Google Scholar]
- 92.Wang D, Hincapie M, Rejtar T, Karger BL. Ultrasensitive characterization of site-specific glycosylation of affinity-purified haptoglobin from lung cancer patient plasma using 10 mum i.d. porous layer open tubular liquid chromatography-linear ion trap collision-induced dissociation/electron transfer dissociation mass spectrometry. Anal Chem. 2011;83:2029–2037. doi: 10.1021/ac102825g. [DOI] [PMC free article] [PubMed] [Google Scholar]
- 93.Parker BL, Thaysen-Andersen M, Solis N, Scott NE, et al. Site-specific glycan-peptide analysis for determination of N-glycoproteome heterogeneity. J Proteome Res. 2013;12:5791–5800. doi: 10.1021/pr400783j. [DOI] [PubMed] [Google Scholar]
- 94.Liu Y, Huttenhain R, Surinova S, Gillet LC, et al. Quantitative measurements of N-linked glycoproteins in human plasma by SWATH-MS. Proteomics. 2013;13:1247–1256. doi: 10.1002/pmic.201200417. [DOI] [PubMed] [Google Scholar]
- 95.Stahl-Zeng J, Lange V, Ossola R, Aebersold R, Domon B. High sensitivity detection of plasma proteins by multiple reaction monitoring of N-glycosites. Mol Cell Proteomics. 2007;6:1809–1817. doi: 10.1074/mcp.M700132-MCP200. [DOI] [PubMed] [Google Scholar]
- 96.Kim YJ, Zaidi-Ainouch Z, Gallien S, Domon B. Mass spectrometry-based detection and quantification of plasma glycoproteins using selective reaction monitoring. Nat Protoc. 2012;7:859–871. doi: 10.1038/nprot.2012.023. [DOI] [PubMed] [Google Scholar]
- 97.Timmerman P, Lausecker B, Barosso B, van AP, et al. ‘Large meets small’: connecting the bioanalytical community around peptide and protein bioanalysis with LC-MS(/MS) Bioanalysis. 2012;4:627–631. doi: 10.4155/bio.12.37. [DOI] [PubMed] [Google Scholar]
- 98.Picotti P, Bodenmiller B, Aebersold R. Proteomics meets the scientific method. Nat Methods. 2013;10:24–27. doi: 10.1038/nmeth.2291. [DOI] [PubMed] [Google Scholar]
- 99.Domon B, Aebersold R. Options and considerations when selecting a quantitative proteomics strategy. Nat Biotechnol. 2010;28:710–721. doi: 10.1038/nbt.1661. [DOI] [PubMed] [Google Scholar]
- 100.Addona TA, Abbatiello SE, Schilling B, Skates SJ, et al. Multi-site assessment of the precision and reproducibility of multiple reaction monitoring-based measurements of proteins in plasma. Nat Biotechnol. 2009;27:633–641. doi: 10.1038/nbt.1546. [DOI] [PMC free article] [PubMed] [Google Scholar]
- 101.Wada Y, Azadi P, Costello CE, Dell A, et al. Comparison of the methods for profiling glycoprotein glycans—HUPO Human Disease Glycomics/Proteome Initiative multi-institutional study. Glycobiology. 2007;17:411–422. doi: 10.1093/glycob/cwl086. [DOI] [PubMed] [Google Scholar]
- 102.Leymarie N, Griffin PJ, Jonscher K, Kolarich D, et al. Interlaboratory study on differential analysis of protein glycosylation by mass spectrometry: the ABRF glycoprotein research multi-institutional study 2012. Mol Cell Proteomics. 2013;12:2935–2951. doi: 10.1074/mcp.M113.030643. [DOI] [PMC free article] [PubMed] [Google Scholar]
- 103.Kiyonami R, Schoen A, Prakash A, Peterman S, et al. Increased selectivity, analytical precision, and throughput in targeted proteomics. Mol Cell Proteomics. 2011;10:M110. doi: 10.1074/mcp.M110.002931. [DOI] [PMC free article] [PubMed] [Google Scholar]
- 104.Whiteaker JR, Zhao L, Anderson L, Paulovich AG. An automated and multiplexed method for high throughput peptide immunoaffinity enrichment and multiple reaction monitoring mass spectrometry-based quantification of protein biomarkers. Mol Cell Proteomics. 2010;9:184–196. doi: 10.1074/mcp.M900254-MCP200. [DOI] [PMC free article] [PubMed] [Google Scholar]
- 105.Gilar M, Olivova P, Daly AE, Gebler JC. Two-dimensional separation of peptides using RP-RP-HPLC system with different pH in first and second separation dimensions. J Sep Sci. 2005;28:1694–1703. doi: 10.1002/jssc.200500116. [DOI] [PubMed] [Google Scholar]
- 106.Escher C, Reiter L, MacLean B, Ossola R, et al. Using iRT, a normalized retention time for more targeted measurement of peptides. Proteomics. 2012;12:1111–1121. doi: 10.1002/pmic.201100463. [DOI] [PMC free article] [PubMed] [Google Scholar]
- 107.Unwin RD, Griffiths JR, Leverentz MK, Grallert A, et al. Multiple reaction monitoring to identify sites of protein phosphorylation with high sensitivity. Mol Cell Proteomics. 2005;4:1134–1144. doi: 10.1074/mcp.M500113-MCP200. [DOI] [PubMed] [Google Scholar]
- 108.Ahn YH, Lee JY, Lee JY, Kim YS, et al. Quantitative analysis of an aberrant glycoform of TIMP1 from colon cancer serum by L-PHA-enrichment and SISCAPA with MRM mass spectrometry. J Proteome Res. 2009;8:4216–4224. doi: 10.1021/pr900269s. [DOI] [PubMed] [Google Scholar]
- 109.Ahn YH, Shin PM, Oh NR, Park GW, et al. A lectin-coupled, targeted proteomic mass spectrometry (MRM MS) platform for identification of multiple liver cancer biomarkers in human plasma. J Proteomics. 2012;75:5507–5515. doi: 10.1016/j.jprot.2012.06.027. [DOI] [PubMed] [Google Scholar]
- 110.Cima I, Schiess R, Wild P, Kaelin M, et al. Cancer genetics-guided discovery of serum biomarker signatures for diagnosis and prognosis of prostate cancer. Proc Natl Acad Sci USA. 2011;108:3342–3347. doi: 10.1073/pnas.1013699108. [DOI] [PMC free article] [PubMed] [Google Scholar]
- 111.Ninonuevo MR, Perkins PD, Francis J, Lamotte LM, et al. Daily variations in oligosaccharides of human milk determined by microfluidic chips and mass spectrometry. J Agric Food Chem. 2008;56:618–626. doi: 10.1021/jf071972u. [DOI] [PubMed] [Google Scholar]
- 112.Santos-Fandila A, Zafra-Gomez A, Vazquez E, Navalon A, et al. Ultra high performance liquid chromatography-tandem mass spectrometry method for the determination of soluble milk glycans in rat serum. Talanta. 2014;118:137–146. doi: 10.1016/j.talanta.2013.10.013. [DOI] [PubMed] [Google Scholar]
- 113.Harvey DJ, Royle L, Radcliffe CM, Rudd PM, Dwek RA. Structural and quantitative analysis of N-linked glycans by matrix-assisted laser desorption ionization and negative ion nanospray mass spectrometry. Anal Biochem. 2008;376:44–60. doi: 10.1016/j.ab.2008.01.025. [DOI] [PubMed] [Google Scholar]
- 114.Harvey DJ. Fragmentation of negative ions from carbohydrates: part 1. Use of nitrate and other anionic adducts for the production of negative ion electrospray spectra from N-linked carbohydrates. J Am Soc Mass Spectrom. 2005;16:622–630. doi: 10.1016/j.jasms.2005.01.004. [DOI] [PubMed] [Google Scholar]
- 115.Harvey DJ, Edgeworth M, Krishna BA, Bonomelli C, et al. Fragmentation of negative ions from N-linked carbohydrates: part 6. Glycans containing one N-acetylglucosamine in the core. Rapid Commun Mass Spectrom. 2014;28:2008–2018. doi: 10.1002/rcm.6980. [DOI] [PubMed] [Google Scholar]
- 116.Jensen PH, Karlsson NG, Kolarich D, Packer NH. Structural analysis of N- and O-glycans released from glycoproteins. Nat Protoc. 2012;7:1299–1310. doi: 10.1038/nprot.2012.063. [DOI] [PubMed] [Google Scholar]
- 117.Isailovic D, Plasencia MD, Gaye MM, Stokes ST, et al. Delineating diseases by IMS-MS profiling of serum N-linked glycans. J Proteome Res. 2011;11:576–585. doi: 10.1021/pr200777u. [DOI] [PMC free article] [PubMed] [Google Scholar]
- 118.Hofmann J, Struwe WB, Scarff CA, Scrivens JH, et al. Estimating collision cross sections of negatively charged N-glycans using travelling wave ion mobility-mass spectrometry. Anal Chem. 2014;86:10789–10795. doi: 10.1021/ac5028353. [DOI] [PubMed] [Google Scholar]
- 119.Lepenies B, Yin J, Seeberger PH. Applications of synthetic carbohydrates to chemical biology. Curr Opin Chem Biol. 2010;14:404–411. doi: 10.1016/j.cbpa.2010.02.016. [DOI] [PubMed] [Google Scholar]
- 120.Wang Z, Chinoy ZS, Ambre SG, Peng W, et al. A general strategy for the chemoenzymatic synthesis of asymmetrically branched N-glycans. Science. 2013;341:379–383. doi: 10.1126/science.1236231. [DOI] [PMC free article] [PubMed] [Google Scholar]
- 121.Sanda M, Pompach P, Brnakova Z, Wu J, et al. Quantitative liquid chromatography-mass spectrometry-multiple reaction monitoring (LC-MS-MRM) analysis of site-specific glycoforms of haptoglobin in liver disease. Mol Cell Proteomics. 2013;12:1294–1305. doi: 10.1074/mcp.M112.023325. [DOI] [PMC free article] [PubMed] [Google Scholar]
- 122.Gilar M, Yu YQ, Ahn J, Xie H, et al. Characterization of glycoprotein digests with hydrophilic interaction chromatography and mass spectrometry. Anal Biochem. 2011;417:80–88. doi: 10.1016/j.ab.2011.05.028. [DOI] [PubMed] [Google Scholar]
- 123.Davies M, Smith KD, Harbin AM, Hounsell EF. High-performance liquid chromatography of oligosaccharide alditols glycopeptides on a graphitized carbon column. J Chromatogr. 1992;609:125–131. doi: 10.1016/0021-9673(92)80155-n. [DOI] [PubMed] [Google Scholar]
- 124.Koizumi K. High-performance liquid chromatographic separation of carbohydrates on graphitized carbon columns. J Chromatogr A. 1996;720:119–126. doi: 10.1016/0021-9673(94)01274-1. [DOI] [PubMed] [Google Scholar]
- 125.Zauner G, Koeleman CA, Deelder AM, Wuhrer M. Nano-HPLC-MS of glycopeptides obtained after nonspecific proteolysis. Methods Mol Biol. 2013;951:113–127. doi: 10.1007/978-1-62703-146-2_9. [DOI] [PubMed] [Google Scholar]
- 126.Pompach P, Brnakova Z, Sanda M, Wu J, et al. Site-specific glycoforms of haptoglobin in liver cirrhosis and hepatocellular carcinoma. Mol Cell Proteomics. 2013;12:1281–1293. doi: 10.1074/mcp.M112.023259. [DOI] [PMC free article] [PubMed] [Google Scholar]
- 127.Carr SA, Huddleston MJ, Bean MF. Selective identification and differentiation of N- and O-linked oligosaccharides in glycoproteins by liquid chromatography-mass spectrometry. Protein Sci. 1993;2:183–196. doi: 10.1002/pro.5560020207. [DOI] [PMC free article] [PubMed] [Google Scholar]
- 128.Sanda M, Pompach P, Benicky J, Goldman R. LC-MS3 quantification of O-glycopeptides in human serum. Electrophoresis. 2013;34:2342–2349. doi: 10.1002/elps.201200658. [DOI] [PMC free article] [PubMed] [Google Scholar]
- 129.Song E, Pyreddy S, Mechref Y. Quantification of glycopeptides by multiple reaction monitoring liquid chromatography/tandem mass spectrometry. Rapid Commun Mass Spectrom. 2012;26:1941–1954. doi: 10.1002/rcm.6290. [DOI] [PMC free article] [PubMed] [Google Scholar]
- 130.Zhao Y, Jia W, Wang J, Ying W, et al. Fragmentation and site-specific quantification of core fucosylated glycoprotein by multiple reaction monitoring-mass spectrometry. Anal Chem. 2011;83:8802–8809. doi: 10.1021/ac201676a. [DOI] [PubMed] [Google Scholar]
- 131.Hong Q, Lebrilla CB, Miyamoto S, Ruhaak LR. Absolute quantitation of immunoglobulin G and its glycoforms using multiple reaction monitoring. Anal Chem. 2013;85:8585–8593. doi: 10.1021/ac4009995. [DOI] [PMC free article] [PubMed] [Google Scholar]
- 132.Toyama A, Nakagawa H, Matsuda K, Sato TA, et al. Quantitative structural characterization of local N-glycan microheterogeneity in therapeutic antibodies by energy-resolved oxonium ion monitoring. Anal Chem. 2012;84:9655–9662. doi: 10.1021/ac3023372. [DOI] [PubMed] [Google Scholar]
- 133.Lee HJ, Cha HJ, Lim JS, Lee SH, et al. Abundance-ratio-based semiquantitative analysis of site-specific N-linked glycopeptides present in the plasma of hepatocellular carcinoma patients. J Proteome Res. 2014;13:2328–2338. doi: 10.1021/pr4011519. [DOI] [PubMed] [Google Scholar]
- 134.Royle L, Radcliffe CM, Dwek RA, Rudd PM. Methods in Molecular Biology. In: Brockhausen I, editor. Glycobiology Protocols. Vol. 347. Humana Press, Inc; Totowa, NJ: 2006. pp. 125–143. [Google Scholar]
- 135.Fortin T, Salvador A, Charrier JP, Lenz C, et al. Multiple reaction monitoring cubed for protein quantification at the low nanogram/milliliter level in nondepleted human serum. Anal Chem. 2009;81:9343–9352. doi: 10.1021/ac901447h. [DOI] [PubMed] [Google Scholar]