Abstract
Please cite this paper as: Qian et al. (2011) Attempted early detection of influenza A (H1N1) pandemic with surveillance data of influenza‐like illness and unexplained pneumonia. Influenza and Other Respiratory Viruses 5(6), e479–e486.
Background To collect disease information and provide data for early detection of epidemics, two surveillance systems were established for influenza‐like illness (ILI) and unexplained pneumonia (UP) in Wuxi, People’s Republic of China.
Objectives The current study aims to describe the performance of these surveillance systems during 2004–2009 and to evaluate the value of surveillance data in detection of influenza epidemics.
Methods Two national ILI sentinel hospitals and three UP sentinel hospitals provided data to the surveillance systems. The surveillance data from hospital‐based outpatient clinics and emergency rooms were compared by year. The ILI data of 2009 were further modeled based on previous data using both a control chart method and a moving average regression method. Alarms of potential epidemics would be raised when the input surveillance data surpassed a threshold.
Results In 2009, the proportions of ILI and respiratory illness with fever (one surveillance syndrome of the UP system) to total patient visits (3·40% and 11·76%, respectively) were higher than the previous years. The surveillance data of both systems also showed developing trends similar to the influenza A (H1N1) pandemic in 2009. When the surveillance data of 2009 were fitted in the two detection models, alarms were produced on the occurrence of the first local case of influenza A (H1N1), outbreaks in schools and in general populations.
Conclusions The results indicated the potential for using ILI and UP surveillance data as syndromic indicators to detect and provide an early warning for influenza epidemics.
Keywords: Control chart, early detection, influenza, Serfling method, surveillance
Introduction
Influenza, commonly known as the flu, is a severe infectious disease accounting for between 250 000 and 500 000 deaths worldwide every year. Millions of people died in the influenza pandemic of 1918, one of the worst epidemic disasters in recorded human history. 1 The life style of modern society, including overcrowded cities and rapid global transportation, has resulted in dissemination of influenza and generation of novel virus strains. In the past year, the World Health Organization (WHO) announced a level‐6 alert for the influenza A (H1N1) pandemic, the highest level of disease outbreak, because of the sustained spread of this new virus on a global scale. 2 The world was fortunate not to have experienced another devastating influenza epidemic, because the fatality rate of the new virus strain was similar to seasonal influenza virus. 3 However, there remains an inevitability of a new influenza pandemic, which could be highly infectious and as deadly as the 1918 influenza pandemic. Thus, it is necessary, although challenging to detect the onset of a new influenza epidemic, to allow the government to make timely and proper interventions to reduce the social and economic impact from influenza epidemics.
The influenza surveillance system long has been playing an essential role in collecting disease information and providing evidence for prevention and control strategies and measures. Two surveillance systems were established in Wuxi for influenza‐like illness (ILI) and unexplained pneumonia (UP) after the severe acute respiratory syndrome (SARS) outbreak. The ILI system was implemented for influenza surveillance, and the UP system was designed to track lower respiratory illness with pneumonia symptoms. Although the disease surveillance systems appeared decades later than in developed countries, their performance is by no means inferior to define the distribution of circulating strains in the community and detect disease aberration. Here we described and compared the accumulated ILI data from 2004 to 2009 and UP data from 2007 to 2009. To further evaluate the effectiveness of these surveillance systems in early warning of influenza epidemics, we monitored ILI data between 2004 and 2008 by both a control chart method and the Serfling method and tested goodness of fit using influenza A (H1N1) data of 2009.
Methods
Surveillance site
Wuxi is a prefecture‐level city of Jiangsu province, located in eastern China, with a population of 6·2 million. Wuxi has seven districts and two county‐level cities (Jiangyin and Yixing). Wuxi has a typical subtropical monsoon climate and seasonal influenza usually peaks once a year. 4
Surveillance systems for ILI and UP
There are two surveillance systems in Wuxi. One is ILI surveillance system and the other is UP surveillance systems. Both systems collected data from sentinel hospital‐based outpatient clinics and emergency rooms. All the selected sentinel hospitals are general hospitals and available to every resident in Wuxi city including Jiangyin and Yixing county. The participating doctors in referral sentinel hospitals were provided with detailed diagnosis instructions for sample selection.
As required by the Chinese Center for Disease control and Prevention (CDC), two hospitals (Children’s Hospital and the No. 3 People’s Hospital of Wuxi) were selected as the national sentinel hospitals for ILI surveillance. The number of patient visits ranged from 8000 to 12 000/week. ILI was defined as follows: fever ≥38°C, either cough or sore throat, and lack of evidence of other laboratory‐confirmed diagnosis. Pharyngeal swab specimens collected from patients with ILI were sent to CDC laboratories for subsequent isolation and identification. The proportion of patient visits for ILI was calculated as the number of patients with ILI divided by the total number of patients and was reported through the influenza surveillance system of China.
The UP surveillance was performed in three hospitals (the No. 2 People’s Hospital of Wuxi, the People’s Hospital of Jiangyin County, and the People’s Hospital of Yixing County). This system was built with special attention to lower respiratory illness, especially pneumonia caused by unknown reagent like SARS. Routinely collected data included respiratory illness with fever (RIWF, also known as acute respiratory illness) and classified pneumonia. Emergency measures would be taken in case of any UP. Pneumonia was diagnosed according to International Classification of Diseases (10th version, J00‐J99). Unexplained pneumonia was defined as follows: fever ≥38°C, pneumonia‐like characteristics in diagnostic imaging, decreased white blood cell count or decreased lymphocyte differential count in early clinical stage, and no improvement in or even worsening of patient’s condition after regular antibiotic treatment for 3–5 days. The total number of patient visits ranged from 11 000 to 14 000/week, among whom an average of 3·5–3·7% were diagnosed as classified pneumonia. Weekly numbers of RIWF and classified pneumonia were reported to Wuxi Center for Disease Prevention and Control.
Statistical analysis of surveillance data
We retrospectively studied ILI data from 2004 to 2009 and UP data from 2007 to 2009, respectively. All the data were organized by Microsoft Office Excel 2007. Statistical analysis was performed by using spss software (version 17.0, SPSS Inc., Chicago, IL, USA). The Kolmogorov–Smirnov test was used to check the normality of the data. The chi‐square test was used for the comparison of different ratios and proportions.
The ILI data during 2004–2008 were used in statistical modeling for influenza detection. Both a control chart method 5 , 6 , 7 and a moving average regression method 8 , 9 were applied to produce the threshold value. Alarms of potential epidemics were raised when the input surveillance data of 2009 surpassed the threshold.
The control chart method was originally developed to determine and control the situation for manufacturing processes and was later implicated in surveillance analysis. 10 In this study, a long‐term average weekly proportion of ILI (P) and its standard deviation (Sp) were calibrated using all the surveillance data. The data higher than P + 2Sp were referred to as being out of statistical control and were excluded. Such data were usually observed in epidemics of seasonal flu and could not generally represent a stable and predictable situation over time. Adjusted average weekly proportion of ILI (P’) and standard deviation (Sp’) were calculated with those data in the state of statistical control. The threshold was defined as P’ + 2Sp’.
The moving average regression method was originally proposed by Serfling and was used in our study to generate a time‐varying threshold for influenza. 8 , 11 , 12 , 13 , 14 A linear secular trend was estimated from the surveillance data through 2004–2008 by using the regression analysis tool of Excel. The secular trend was then removed from the original surveillance data, so the adjusted data represented only seasonal change and could be compared by year. The time‐varying threshold was calibrated as the 5‐year moving average plus 1·6 SD (standard deviation) (P = 0·05) or 2·0 SD (P = 0·01) from the mean.
Results
The epidemic timeline of the 2009 influenza A (H1N1) pandemic in Wuxi
The first imported case of the influenza A (H1N1) was reported on June 25, 2009 (the 26th week of the year). The first local case was reported on August 16 (week 33). The first school case was reported on September 3 (week 36), and transmission spread quickly when students came back to school in September. The influenza epidemic spread widely during September to December in the general population, with 132 confirmed cases in September, 89 cases in October, 146 cases in November, and 113 cases in December. The last identified patient was reported on February 12, 2010. The epidemic timeline is shown in Figure 1.
Figure 1.
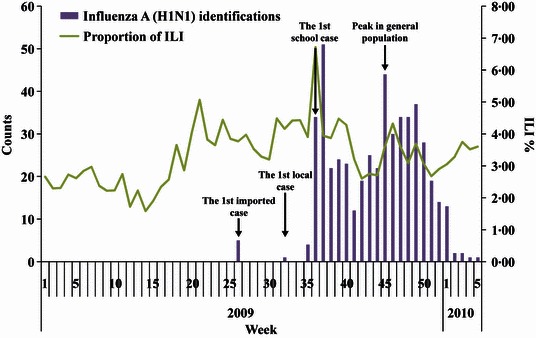
Sentinel surveillance data of influenza A (H1N1) during 2009–2010 in Wuxi, People’s Republic of China.
The epidemic description of ILI in Wuxi during 2007–2009
The surveillance data collected from the two sentinel hospitals showed an earlier peak of the proportion of ILI in 2009 when compared with the same period in 2007 and 2008 (Figure 2). The ILI proportion aberrantly increased to 3·72% in the 22nd week of 2009, higher than 3·61% in 2007 and 2·74% in 2008. This increase in ILI proportion appeared 4 weeks earlier before the first imported case of influenza A (H1N1) and started to decline after week 28. Simultaneously with the appearance of the first local case, the proportion of ILI started to increase rapidly beginning in week 34, indicating the early stage of the influenza epidemic. The proportion of ILI peaked in the general population at week 39 (4·74%), when the schools also experienced a peak of illness.
Figure 2.
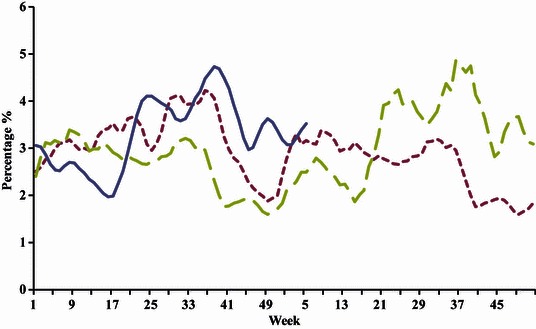
Annual cycles of influenza‐like illness (ILI) surveillance data during 2007–2010 in Wuxi, People’s Republic of China. Weekly proportion of ILI to total patient visits were calculated and plotted in the figure.
The epidemic description of UP in Wuxi during 2007–2009
ILI and UP both belong to RIWF or acute respiratory illness. However, the ILI system and UP system have different surveillance duties. The UP system is more concerned about illness with pneumonia symptoms. The 2003 SARS outbreak provided an opportunity to learn about outbreaks and prevention measures. As a result, the surveillance system for UP was established in 2004, and since then no more SARS cases have been detected. In 2009, significantly higher RIWF counts (a total of 83 633 cases, including 2955 classified pneumonia cases) and total visiting patients of the sentinel hospitals (710 956 visits) were observed compared with those observed in 2007 (587 034 patient visits, 58 202 RIWF cases, and 2149 pneumonia cases) and 2008 (640 971 patient visits, 64 986 RIWF cases, and 2293 pneumonia cases) (P < 0·01; Table 1 and Figure 3). The proportion of RIWF to total patient visits (11·76%) was also significantly higher than that in the previous 2 years (9·91% and 10·14%, respectively), while the proportion of pneumonia to RIWF was similar in all 3 years (3·53–3·69%) (Table 1 and Figure 3). The proportion of RIWF began to increase in week 32, around the time of the first imported influenza A (H1N1) case. When we examined the 2009 epidemic season, the trend of UP surveillance data was similar to the trend of ILI data (2, 3). Therefore, the data observed from UP surveillance system may also reflect the epidemic situation of influenza.
Table 1.
Surveillance data of unexplained pneumonia during 2007–2009 in Wuxi, People’s Republic of China
| Year | Total patient visits | Respiratory illness with fever (RIWF) | % of RIWF to total patient visits | Pneumonia with fever | % of pneumonia with fever to RIWF |
|---|---|---|---|---|---|
| 2007 | 587 034 | 58 202 | 9·91 | 2149 | 3·69 |
| 2008 | 640 971 | 64 986 | 10·14 | 2293 | 3·53 |
| 2009 | 710 956 | 83 633 | 11·76 | 2995 | 3·58 |
Figure 3.
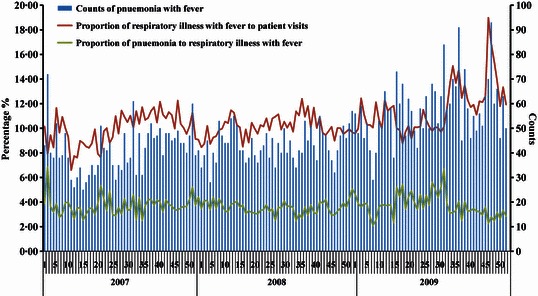
Annual cycles of unexplained pneumonia (UP) surveillance data during 2007–2009 in Wuxi, People’s Republic of China.
Analysis of ILI surveillance data for early epidemic detection
The basic design of outbreak detection is that an alert is generated when the current data surpass a threshold. Therefore, determining a threshold is essential and crucial for the performance of an early warning system. To obtain the optimal sensitivity and specificity, both control chart method and moving average regression method were used to calibrate the threshold.
The control chart method was used to determine an influenza threshold by week. A centerline threshold value was drawn based on the weekly proportion of ILI from 2004 to 2008. When the 2009 data were fitted into the chart, alarms of aberrant higher proportions of illness appeared in week 18, week 20 to week 29, week 31 to week 41, week 45 to week 47, and week 49 (Figure 4). These results were consistent with the true observations, including the first imported case in week 26, the first local case in week 33, the outbreak in school beginning in week 36, and the outbreak peak in general population in week 45.
Figure 4.
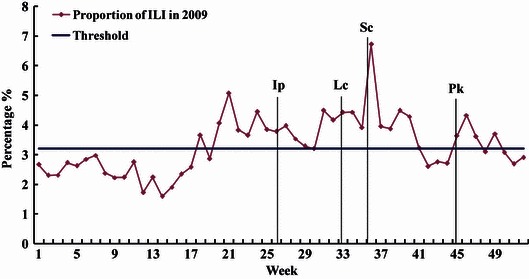
Detection of influenza epidemic by control chart method based on the surveillance data of influenza‐like illness (ILI) during 2004 to 2008 in Wuxi, People’s Republic of China. The threshold was calibrated as the average weekly proportion of ILI + 2Sp (3·2%). Weekly ILI% is calculated as the weekly counts of ILI to total patient visits. The occurrence of each important epidemic event is marked by a vertical line. Legend: Ip, the first imported influenza A (H1N1) case; Lc, the first local influenza A (H1N1) case; Sc, the outbreak of influenza A (H1N1) in school; Pk, the epidemic peak of influenza A (H1N1) in general population.
In the moving average method, a time‐varying threshold for influenza was generated. The ILI counts for 2009 were higher than the moving average baseline in week 18, week 20 to week 21, week 24, and week 32 to week 50 (Figure 5). More precisely, the ILI counts were higher than mean + 1·6 SD in week 34 to week 37, week 39, and week 45 to week 47, and the periods from week 34 to week 37 and week 46 to week 47 showed the highest ILI counts (above mean + 2·0 SD). The aberration points were consistent with the reported date of the first local case, the outbreak in schools, and the peak in the general population.
Figure 5.
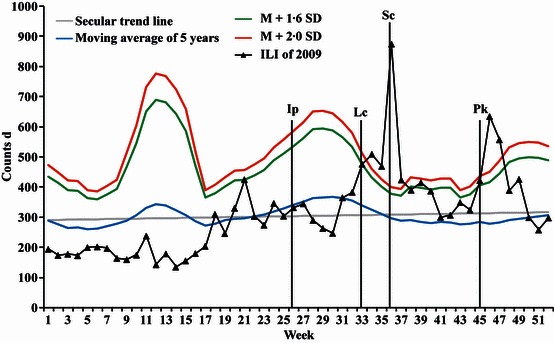
Detection of influenza epidemic by moving average regression method (Serfling method) based on the surveillance data of influenza‐like illness (ILI) during 2004–2008 in Wuxi, People’s Republic of China. Weekly proportion of ILI is calculated as the weekly counts of ILI to total patient visits. The occurrence of each important epidemic event is marked by a vertical line. Legend: Ip, the first imported influenza A (H1N1) case; Lc, the first local influenza A (H1N1) case; Sc, the outbreak of influenza A (H1N1) in school; Pk, the epidemic peak of influenza A (H1N1) in general population.
Discussion
The early detection of disease outbreaks has long been important to public health. The importance of a surveillance network at the global level has been unprecedentedly emphasized because of the emergence of newly infectious diseases, pandemics, and the threats of bioterrorism. 15 The monitoring of surveillance data plays an essential role in detecting signals for a potential outbreak.
For diseases or illnesses with enormous social impact, timeliness of detection is extremely valuable. With these types of diseases or illnesses, indicators like hospital consultations rather than mortality or morbidity are used in modeling, because they tend to provide earlier outbreak indication. 16 , 17 For influenza, ILI is commonly used as an indicator to predict the occurrence of epidemics. 13 , 18 , 19 Unlike other diseases, the value of routinely collected ILI data for influenza detection has been carefully studied and confirmed. 17 , 18 , 20 In this current study, weekly counts of consultations for ILI and UP were monitored for influenza detection. The distribution of sentinel ILI data in 2009 (Figure 2) were consistent with the real spread of the pandemic and showed aberrant increase close to or earlier than the reference data. These results confirmed the capability of ILI surveillance system to detect influenza. Although the UP surveillance system was designed to detect SARS instead of influenza, the data are useful because ILI and pneumonia usually have similar symptoms such as fever, cough, and breathing difficulty. Compared with the reference data (Figure 1), the sentinel UP data (Table 1 and Figure 3) also showed similar epidemic trend. However, the efficiency of early detection was not high using the UP surveillance system as significantly increased proportion of RIWF was observed in sentinel hospitals only after the first local case was reported. A reasonable explanation might be because of the diagnostic criteria. ILI was used specifically to indicate influenza, while RIWF includes pneumonia and many other kinds of respiratory illnesses besides ILI. The nature of the UP system could not distinguish between the respiratory complaints related to influenza and those caused by other pathogens. The population at risk could be another reason for not being able to detect outbreaks because the ILI sentinel sites and UP sentinel sites cover different areas. Nevertheless, the sentinel UP data provide additional information to detect influenza epidemic and can add confidence to declare an epidemic alarm.
At the beginning of the 2009 pandemic flu period, Asia was in especially high alert of epidemic influenza and China implemented aggressive policies trying to delay illness spread by early identification and isolation of every confirmed H1N1 patient. The increased proportion of ILI and RIWF before the first imported H1N1 case could be explained as a surveillance artifact because of the heightened concern of individuals. With the development of the epidemic, control strategies were changed to intensive treatment of the seriously ill and self‐isolation of mild cases. People who had mild flu symptoms were encouraged to take anti‐viral medicines and stay at home instead of seeking medical care in hospitals. All the sentinel hospitals collected data as usual without any strengthened effort. The higher proportion of ILI and RIWF observed after week 29 was more likely due to the high incidence of H1N1 influenza in general population rather than surveillance artifact.
A variety of statistical methods have been developed to monitor surveillance data, including time series, regression, cumulative sum (CUSUM), and hidden Markov models. 9 , 11 , 14 , 21 , 22 , 23 , 24 The performance of these models is usually evaluated from the following characteristics: sensitivity, specificity, and timeliness. 21 , 25 Sensitivity is the ability to find a real outbreak alert; specificity is the ability to exclude false alarm; timeliness is the ability to raise an alarm within the shortest amount of time from the onset of the peak of the season.
Most approaches of early detection produce alerts based on the theory of signal detection. 25 The optimal sensitivity and specificity depend on a proper level of threshold, but there is always a trade‐off between a high threshold for good specificity and a low threshold for good sensitivity. The calibration of a threshold is a complex determination for each system. Both the control chart method and the Serfling method are time series approaches and have their own advantages in reducing the variance caused by epidemic data or secular trend. 14 , 21 The control chart method optimizes the threshold calibration by excluding the unexpected data that are beyond the controlled scope. 6 The Serfling method provides reasonably accurate estimates by adjusting the threshold line with secular regression trend. 8 The US Centers for Disease Control and Prevention (Atlanta, GA, USA) developed an Early Aberration Reporting System (EARS) based on CUSUM method, which can use only recent data and is supposed to incorporate the threshold calculation by regression method. 21 , 22 However, a study in Hong Kong showed that the regression method and the time series method are superior to the CUSUM method in a small city with fewer sentinel sites, more variable data, and a more abrupt peak in activity. 14 As a result, the CUSUM method was not used in our study.
The control chart method detected all four remarkable signals, namely the occurrence of the first imported case, the first local case, outbreaks in schools, and the peak in the general population (Figure 4). It also produced two false‐positive alarms, one in the beginning and the other at the end of the epidemic period. When using mean + 1·6 SD as the threshold, the Serfling method detected the outbreaks in schools and the peak in the general population, with a false‐positive signal in the interval; when raising the threshold to mean + 2·0 SD, only the outbreaks in schools could be detected in a timely manner, and the second alarm was 1 week after the peak in the general population (Figure 5). The comparison of the two methods indicated that the control chart method had better sensitivity and timeliness and the Serfling method had better specificity. Nevertheless, considering that the false‐positive alerts of the control method appeared outside the epidemic period, this fact might be taken in favor of a more sensitive detection. The same opinion was seen in Gault’s paper. 18 A final decision probably should be made combining the results of both methods. The control chart method can generate sensitive and timely alerts, and Serfling method can offer secular trend to increase specificity and avoid wasting medical resources.
In developing countries like China, surveillance systems like the ILI and UP systems have only recently been implemented. We performed this study after the 2009 pandemic flu in attempt to make full use of these routinely collected background data. The results are theoretically helpful for healthcare workers to take prevention and control measures when influenza epidemic occur, including preparing anti‐viral drugs and other medical supply needs, and sending health education messages. So far no such actions, which we already took during the epidemic period, have been applied based on our study. Future studies will be carried out to improve the performance of these surveillance systems, such as adding more sentinel sites, covering larger population, improving the quality of indicators, and trying different detection algorithms. Studies of decision making are also needed before these approaches could be used in practice. The decision theory provides mathematical methods to estimate the benefits of true alarms and the costs of false alarms for getting an optimal threshold. 25 This analysis was beyond the scope of our current study, and we will investigate such methods in our future work.
In conclusion, this study described the surveillance data of ILI and UP during 2007–2009 and the epidemic progress of influenza A (H1N1) pandemic in Wuxi, China. The surveillance data of both systems were correlated with the influenza epidemic and therefore valuable in monitoring influenza activity and generating early warning methods. The control chart method and Serfling method had their respective merits and faults in data analysis. Further studies could be considered to optimize the threshold of warning. The principle is to improve performance of surveillance systems and allow timely precautionary measures to be implemented in vulnerable populations.
Acknowledgements
This study was supported by the National Mega‐project of Science Research Project (2009ZX1004‐904), Jiangsu Provincial Project of Health Research (H200956), Jiangsu Provincial Project of Preventive Medicine Research (Y201026), and Wuxi Development Project of Science and Technology (CSZ00955, CSE009012, and CSZ01050).
References
- 1. Glezen WP. Emerging infections: pandemic influenza. Epidemiol Rev 1996; 18:64–76. [DOI] [PubMed] [Google Scholar]
- 2. Chan M. World now at the start of 2009 influenza pandemic. 2009; Available at http://www.who.int/mediacentre/news/statements/2009/h1n1_pandemic_phase6_20090611/en/index.html (Accessed 25 June 2010).
- 3. Donaldson LJ, Rutter PD, Ellis BM et al. Mortality from pandemic A/H1N1 2009 influenza in England: public health surveillance study. BMJ 2009; 339:b5213. [DOI] [PMC free article] [PubMed] [Google Scholar]
- 4. Chinese Center for Disease Control and Prevention . Guideline for prevention and control of influenza [in Chinese]. 2008; Available at http://www.pandemicflu.ac.cn/n3520543/n3521106/ n3521141/27167.html (Accessed 25 June 2010).
- 5. Benneyan JC. Statistical quality control methods in infection control and hospital epidemiology, Part II: chart use, statistical properties, and research issues. Infect Control Hosp Epidemiol 1998; 19:265–283. [PubMed] [Google Scholar]
- 6. Benneyan JC. Statistical quality control methods in infection control and hospital epidemiology, part I: introduction and basic theory. Infect Control Hosp Epidemiol 1998; 19:194–214. [DOI] [PubMed] [Google Scholar]
- 7. Deng A, He J, Kang M et al. Study on early warning based on influenza surveillance data in Guangdong province. Chin J Public Health 2009; 25:592–593. [Google Scholar]
- 8. Serfiling RE. Methods for current statistical analysis of excess pneumonia‐influenza deaths. Public Health Rep 1963; 78:494–506. [PMC free article] [PubMed] [Google Scholar]
- 9. Chatfield C. Time‐Series Forecasting. Boca Raton: Chapman & Hall/CRC, 2000. [Google Scholar]
- 10. Benneyan JC. Use and interpretation of statistical quality control charts. Int J Qual Health Care 1998; 10:69–73. [DOI] [PubMed] [Google Scholar]
- 11. Thompson WW, Shay DK, Weintraub E et al. Influenza‐associated hospitalizations in the United States. JAMA 2004; 292:1333–1340. [DOI] [PubMed] [Google Scholar]
- 12. Simonsen L, Reichert TA, Viboud C, Blackwelder WC, Taylor RJ, Miller MA. Impact of influenza vaccination on seasonal mortality in the US elderly population. Arch Intern Med 2005; 165:265–272. [DOI] [PubMed] [Google Scholar]
- 13. Cooper DL, Verlander NQ, Elliot AJ, Joseph CA, Smith GE. Can syndromic thresholds provide early warning of national influenza outbreaks? J Public Health 2009; 31:17–25. [DOI] [PubMed] [Google Scholar]
- 14. Cowling BJ, Wong IOL, Ho L‐M, Riley S, Leung GM. Methods for monitoring influenza surveillance data. Int J Epidemiol 2006; 35:1314–1321. [DOI] [PubMed] [Google Scholar]
- 15. Castillo‐Salgado C. Trends and Directions of Global Public Health Surveillance. Epidemiol Rev 2010; 32:93–109. [DOI] [PubMed] [Google Scholar]
- 16. Simonsen L, Fukuda K, Schonberger L, Cox N. The impact of influenza epidemics on hospitalizations. J Infect Dis 2000; 181:831–837. [DOI] [PubMed] [Google Scholar]
- 17. Tsui F‐C, Wagner MM, Dato V, Chang C‐CH. Value of ICD‐9‐coded chief complaints for detection of epidemics. J Am Med Inform Assoc 2002; 6:s41–s47. [PMC free article] [PubMed] [Google Scholar]
- 18. Gault G, Larrieu S, Durand C, Josseran L, Jouves B, Filleul L. Performance of a syndromic system for influenza based on the activity of general practitioners, France. J Public Health 2009; 31:286–292. [DOI] [PubMed] [Google Scholar]
- 19. Buehler JW, Whitney EA, Smith D, Prietula MJ, Stanton SH, Isakov AP. Situational uses of syndromic surveillance. Biosecur Bioterror 2009; 7:165–177. [DOI] [PubMed] [Google Scholar]
- 20. Quenel P, Dab W, Hannoun C, Cohen JM. Sensitivity, specificity and predictive values of health service based indicators for the surveillance of influenza a epidemics. Int J Epidemiol 1994; 23:849–855. [DOI] [PubMed] [Google Scholar]
- 21. Hutwagner L, Browne T, Seeman GM, Fleischauer AT. Comparing aberration detection methods with simulated data. Emerg Infect Dis 2005; 11:314–316. [DOI] [PMC free article] [PubMed] [Google Scholar]
- 22. Hutwagner LC, Thompson WW, Seeman GM, Treadwell T. A simulation model for assessing aberration detection methods used in public health surveillance for systems with limited baselines. Stat Med 2005; 24:543–550. [DOI] [PubMed] [Google Scholar]
- 23. Yang P, Duan W, Lv M et al. Review of an influenza surveillance system, Beijing, People’s Republic of China. Emerg Infect Dis 2009; 15:1603–1608. [DOI] [PMC free article] [PubMed] [Google Scholar]
- 24. Watkins R, Eagleson S, Veenendaal B, Wright G, Plant A. Disease surveillance using a hidden Markov model. BMC Med Inform Decis Mak 2009; 9:39. [DOI] [PMC free article] [PubMed] [Google Scholar]
- 25. Wagner MM, Tsui F‐C, Espino JU et al. The emerging science of very early detection of disease outbreaks. J Public Health Manag Pract 2001; 7:51–59. [DOI] [PubMed] [Google Scholar]


