

Abstract
Background
Neuraminidase (NA) inhibitors (NAIs) are currently the only antivirals effective against influenza infections due to widespread resistance to M2 inhibitors.
Methods
Influenza A and B viruses (n = 1079) collected worldwide between April 01, 2011, and September 30, 2011, were assessed for susceptibility to FDA‐approved NAIs, oseltamivir and zanamivir, and investigational peramivir, using the fluorescent‐based NA‐Fluor™ Influenza Neuraminidase Assay Kit. A subset of viruses (n = 98) were tested for susceptibility to the investigational NAI, laninamivir.
Results
Influenza A(H1N1)pdm09 viruses (n = 326) were sensitive to all NAIs, except for two (0·6%) with H275Y (N1 numbering; H274Y in N2 numbering) substitution, which exhibited elevated IC 50s for oseltamivir and peramivir, and a third with previously unreported N325K substitution, exhibiting reduced susceptibility to oseltamivir. Influenza A(H3N2) viruses (n = 407) were sensitive to all NAIs. Influenza B viruses (n = 346) were sensitive to all NAIs, except two (0·6%) with H273Y (N1 numbering; H274Y in N2 numbering) substitution, exhibiting reduced susceptibility to oseltamivir and peramivir, and one with previously unreported G140R and N144K substitutions, exhibiting reduced susceptibility to oseltamivir, zanamivir, and peramivir. All influenza A and B viruses were sensitive to laninamivir. It is unknown whether substitutions N325K, G140R, and N144K were present in the virus prior to culturing because clinical specimens were unavailable for testing.
Conclusions
This study summarizes NAI susceptibility of influenza viruses circulating worldwide during the 2011 Southern Hemisphere (SH) season, assessed using the NA‐Fluor™ Kit. Despite low resistance to NAIs among tested influenza viruses, constant surveillance of influenza virus susceptibility to NAIs should be emphasized.
Keywords: Influenza, neuraminidase inhibitor, oseltamivir, peramivir, Southern Hemisphere, zanamivir
Introduction
Neuraminidase inhibitors (NAIs) and M2 ion channel blockers (adamantanes) are two classes of antiviral medications approved by the United States (US) Food and Drug Administration (FDA) for management of influenza virus infections. Adamantanes are however not effective against influenza B viruses1 and are no longer recommended by the US Centers for Disease Control and Prevention (CDC) due to widespread resistance among circulating human influenza A viruses,2 leaving NAIs as the only antiviral option currently available for the control of influenza infections. The NAIs, oseltamivir and zanamivir, are licensed in many countries worldwide and are effective against influenza A and B infections, including the recently emerged influenza A(H1N1)pdm09 viruses.3 Peramivir, an intravenous (IV) formulation, is now licensed in Japan and South Korea,4, 5 while laninamivir (prodrug CS‐8958), an inhaled long‐acting NAI developed by Biota and Daiichi Sankyo, is now approved in Japan.6
Resistance to NAIs among influenza viruses circulating worldwide was previously low (<1%),7, 8 but during the 2007–2008 season, a dramatic emergence of oseltamivir‐resistant seasonal influenza A(H1N1) viruses with the H275Y mutation in the NA occurred.9, 10, 11, 12, 13 By the 2008–2009 season, many countries were reporting up to 100% oseltamivir resistance among seasonal influenza A(H1N1) viruses.14, 15 In contrast, oseltamivir resistance among the pandemic A(H1N1)pdm09 viruses circulating in 2009–2010 was <1% in the United States, with majority of oseltamivir‐resistant viruses recovered from patients with a history of oseltamivir exposure, many of whom were severely immunocompromised.16 In the subsequent 2010–2011 season, the United States reported approximately 1·0% oseltamivir resistance among the A(H1N1)pdm09 viruses,17 with evidence suggesting a low level of community transmission of these H275Y variants. In September 2011, a cluster of 29 cases infected with oseltamivir‐resistant influenza A(H1N1)pdm09 viruses was reported in Australia.18, 19 These oseltamivir‐resistant H275Y viruses were in circulation between May, 2011, and August, 2011, a period corresponding to the peak of the SH 2011 influenza season.20 Majority of the patients from whom they were recovered had no known oseltamivir exposure. The potential for the emergence and spread of NAI‐resistant virus variants, coupled with the limited pharmaceutical options currently available for the control of influenza infections, emphasizes the need to monitor NAI susceptibility among influenza viruses circulating globally.
NAI susceptibility testing is primarily performed using functional neuraminidase inhibition (NI) assays; the most common being the chemiluminescent21 and fluorescent22 methods. These NI assays utilize small synthetic substrates and require propagated viral isolates. Madin–Darby canine kidney (MDCK) cells are the most commonly used cell line for propagation of influenza viruses in surveillance laboratories prior to testing in the NI assay. However, recent studies have shown that these cells may provide a growth advantage to particular influenza virus variants, some of them with altered susceptibility to NAIs.23, 24 This necessitates the analysis of the NA sequence of virus isolates and their matching original clinical specimens, for known and novel markers associated with reduced NAI susceptibility.
There is no established cutoff fifty percent inhibitory value (IC50) for either NI assay that is indicative of clinically relevant resistance. Presently, monitoring susceptibility to NAIs is conducted using a combination of the NI assay and sequence analysis. Viruses showing elevated IC50s in the NI assay compared with NAI‐susceptible reference viruses and/or baseline IC50s for the drug by virus type/subtype must be genetically tested by conventional sequencing10 or mutation detection analysis such as pyrosequencing25, 26, 27 or real‐time PCR28, 29 to confirm the presence of molecular markers of resistance, in order to define the observed NAI resistance. Assay choice and variations in assay conditions affect the IC50 and the baseline values.
The fluorescent NI assay has been the most commonly used assay by influenza surveillance laboratories worldwide. It has recently become the method of choice to assess influenza virus susceptibility to NAIs by the World Health Organization (WHO) Center for Surveillance, Epidemiology and Control of Influenza, at the CDC in Atlanta, Georgia, United States. This assay was recently developed as a commercial kit, the NA‐Fluor™ Influenza Neuraminidase Assay Kit (Applied Biosystems, Foster City, CA, USA), which provides validated reagents together with a protocol, enabling improved testing quality. In February 2011, the CDC began utilizing the commercial NA‐Fluor™ Kit reagents and the modified manufacturer's protocol to achieve its surveillance objectives.
The Southern Hemisphere influenza season corresponds to the winter season of the temperate Southern Hemisphere, which usually starts in April or May, ends in September or October, and often peaks in July or August. In this study, the “2011 Southern Hemisphere Season” is defined as the as the period between April 1, 2011, and September 30, 2011. Influenza virus specimens collected globally during this period were tested for NAI susceptibility.
This study reports the results of NAI susceptibility testing of influenza viruses circulating worldwide during the “2011 Southern Hemisphere influenza season” using a modified protocol of the NA‐Fluor™ Kit.
Materials and methods
Viruses
Seasonal influenza A and B viruses were collected between April 01, 2011, and September 30, 2011, in the United States (34 states) and 51 other countries in Africa, Asia, Europe, North America, Oceania, and South America. The viruses were collected from tropical and temperate countries, geographically located in either the Northern Hemisphere (NH), Southern Hemisphere (SH), or both hemispheres (NH/SH) (Table 1). The geographic regions within hemispheres are as defined by the Virus Reference Team of the Virus Surveillance and Diagnosis Branch, Influenza Division, CDC.
Table 1.
Geographic and temporal distribution of seasonal influenza A and B viruses collected during the 2011 Southern Hemisphere season (April 01, 2011–September 30, 2011)
| Geographic regiona | Influenza type/subtype | Number of viruses collected in 2011, by month | ||||||
|---|---|---|---|---|---|---|---|---|
| April | May | June | July | August | September | Total | ||
| Northern Hemisphere (NH)b | A(H1N1)pdm09 | 59 | 24 | 37 | 36 | 20 | 19 | 195 |
| A(H3N2) | 92 | 28 | 18 | 32 | 29 | 43 | 242 | |
| B | 101 | 26 | 32 | 39 | 39 | 50 | 287 | |
| NH Total | 252 | 78 | 87 | 107 | 88 | 112 | 724 | |
| Southern Hemisphere (SH)c | A(H1N1)pdm09 | 5 | 11 | 25 | 28 | 22 | 0 | 91 |
| A(H3N2) | 4 | 23 | 45 | 43 | 31 | 8 | 154 | |
| B | 1 | 8 | 15 | 3 | 4 | 0 | 31 | |
| SH Total | 10 | 42 | 85 | 74 | 57 | 8 | 276 | |
| Northern/Southern Hemisphere (NH/SH)d | A(H1N1)pdm09 | 5 | 6 | 9 | 17 | 3 | 0 | 40 |
| A(H3N2) | 4 | 7 | 0 | 0 | 0 | 0 | 11 | |
| B | 18 | 4 | 4 | 0 | 1 | 1 | 28 | |
| NH/SH Total | 27 | 17 | 13 | 17 | 4 | 1 | 79 | |
| Global | A(H1N1)pdm09 | 69 | 41 | 71 | 81 | 45 | 19 | 326 |
| A(H3N2) | 100 | 58 | 63 | 75 | 60 | 51 | 407 | |
| B | 120 | 38 | 51 | 42 | 44 | 51 | 346 | |
| Global total | 289 | 137 | 185 | 198 | 149 | 121 | 1079 | |
Regions in each hemisphere are as designated by the Virus Reference Team of the Virus Surveillance and Diagnosis Branch, Influenza Division, CDC.
NH includes countries located above the equator in CDC‐designated regions of Europe, North America, and parts of Africa, Asia, and South America.
SH includes countries located below the equator in CDC‐designated regions of Oceania and parts of Africa, Asia, and South America.
NH/SH includes countries located along the equator in parts of Africa and South America. These countries lie in both NH and SH.
Viruses were submitted to the WHO Collaborating Center for Surveillance, Epidemiology and Control of Influenza at the CDC in Atlanta, Georgia, United States, and propagated in MDCK cells (ATCC, Manassas, VA, USA) or embryonated chicken eggs. Prior to antiviral susceptibility testing, viruses were antigenically characterized by the hemagglutination inhibition (HI) assay30 to determine and/or confirm virus type/subtype. Stocks of reference influenza A(H1N1)pdm09 viruses used in this study, A/California/07/2009 and A/North Carolina/39/2009, were also propagated in MDCK cells.
Neuraminidase inhibitors
Oseltamivir carboxylate, the active compound of the ethyl ester prodrug oseltamivir phosphate, was supplied by Hoffmann‐La Roche (Basel, Switzerland); zanamivir, by GlaxoSmithKline (Uxbridge, UK); and peramivir, by BioCryst Pharmaceuticals (Birmingham, AL, USA), and laninamivir (R‐125489), the pharmacologically active form of the inhaled prodrug laninamivir octanoate (CS‐8958), was provided by Biota (Melbourne, Vic., Australia).
Neuraminidase inhibition assay
Susceptibilities of viruses to NAIs were assessed in the fluorescent NI assay in which NA activity is measured based on the release of the fluorescent product 4‐methylumbelliferone (4‐MU) after cleavage of the substrate 2‐(4‐methylumbelliferyl)‐a‐D‐N‐acetylneuraminic acid (MUNANA). The assay was performed using the NA‐Fluor™ Influenza Neuraminidase Assay kit (Applied Biosystems, Foster City, CA) with modifications to the provided manufacturer's protocol (Table 2).
Table 2.
Modifications of the Na‐Fluor™ Influenza Neuraminidase Assay Kit
| Modified aspects of assay | Manufacturer's protocola | Modified CDC protocol |
|---|---|---|
| Plate layout for NAI dilutions | 8 rows | 12 columns |
| Number of NAI dilutions | 6 | 10 |
| Final concentration range for NAIs | 10 000–0·01 nm | 1000–0·03 nm |
| Incubation time (after addition of virus to the NAI) | 20–30 minutes | 45 minutes |
| Incubation time (after addition of substrate) | 30 minutes–2 hours | 1 hour |
| Use of plate shaker during incubations | Protocol recommends tapping plate every 10 minutes | No shaker used. Plate tapped repeatedly, at one time only, after addition of substrate |
| Stop solution | Used unaltered or with addition of 40% Ethanol to inactivate virus | Used unaltered, as provided in the kit |
| Replicate testing | Two per isolate | one per isolate (repeated if necessary) |
| Wavelength of plate reader |
Excitation: λ = 350–365 nm Emission: λ = 440–460 nm |
Excitation: λ = 355 nm Emission: λ = 460 nm |
Provided in the NA‐Fluor™ Influenza Neuraminidase Assay Kit.
Briefly, test and reference viruses were diluted at concentrations corresponding to the target fluorescence signal generated by 1000 pmol/well of the 4‐MU standard. The target signal for the Victor3V™ plate reader (Perkin Elmer, Whaltham, MA, USA) in use at the CDC is 500 000 relative fluorescence units (RFU). A virus dilution calculation spreadsheet (Excel, Microsoft, Redmond, WA) was used to determine the appropriate dilution of virus to be used in the inhibition portion of the assay. The spreadsheet is available upon request (email: fluantiviral@cdc.gov). This tool rapidly provides the dilutions of virus, together with the amount of virus and 1× assay buffer to be used in the reaction. Subsequently, 25 μl of each diluted virus was mixed with 25 μl of a range of concentrations of each NAI (0·12–4000 nm; with a final concentration in the reaction of 0·03–1000 nm) and incubated at 37°C for 45 minutes, after which 50 μl of the 200 μm NA‐Fluor™ Substrate (MUNANA) was added to the virus and inhibitor mix and incubated at 37°C for 60 minutes. The reaction was terminated with stop solution, and the level of NA activity at different drug concentrations was quantified on a Victor3V™ plate reader (PerkinElmer, Waltham, MA, USA) at an excitation filter (λ = 364 nm) and an emission filter (λ = 450 nm). For reference purposes, a pair of oseltamivir‐sensitive and oseltamivir‐resistant influenza A(H1N1)pdm09 virus strains, A/California/07/2009 and A/North Carolina/39/2009, respectively, were included in each assay.
A protocol detailing the modified NI assay used in this study is available from the CDC upon request (email: fluantiviral@cdc.gov).
Data analysis
Raw fluorescent NI assay data (expressed as RFU) were plotted against drug concentration (nm) to determine IC50 values, using an updated version of the curve‐fitting software JASPR version 1.2 (CDC, Atlanta, GA, USA).31 Curve fitting in JASPR version 1.2 was performed using the equation: V = Vmax * (1 – ([I] / (Ki + [I]))), where Vmax is the maximum rate of metabolism, [I] is the inhibitor concentration, V is the response being inhibited, and Ki is the IC50 for the inhibition curve. JASPR version 1.2 software used in this study is available from the CDC upon request (email: fluantiviral@cdc.gov). The generated NA inhibition curves were visually inspected to ensure that all data points are on or close to the curve and, if necessary, the test was repeated.
Distribution analyses of IC50 values for each drug were performed to determine quartiles and establish statistical cutoffs for identification of potentially resistant viruses (outliers). Box‐and‐whisker plots were used to display the distribution of log‐transformed IC50s. For influenza B viruses, similar additional analyses were performed for each drug by their hemagglutinin (HA) lineages, B/Yamagata and B/Victoria. All analyses were performed using SAS 9.2 software (SAS Institute, Cary, NC, USA).
The statistical cutoff was set at three times the IQR to the right of the third quartile (X 0·75).31 Viruses with IC50 > X 0·75 + 3 IQR and ≥10‐fold the mean IC50 for the drug for each virus type/subtype were considered extreme outliers. Mild outliers had IC50 above the statistical cutoff (>X 0·75 + 3 IQR), which were >twofold but <10‐fold greater than the mean IC50 for the drug for each type/subtype. These criteria were elected for mild outliers, as using previous criterion of IC50 between 1·5 and 3 IQR from the 75th percentile10 resulted in characterization of viruses without genetic changes in the NA as outliers.
Descriptive statistics, with exclusion of all outliers, were performed on original untransformed IC50 values, to compute the mean, median, and standard deviation (SD) for each drug by virus type/subtype and by HA antigenic lineage for influenza type B viruses. Paired t‐tests were used to compare IC50s for each drug between virus types/subtypes and between lineages. Statistical significance was set at α = 0·05.
All outliers were further tested by genetic analysis to detect known and/or novel markers associated with reduced susceptibility to NAIs. Those harboring well‐characterized NA mutations previously associated with NAI resistance were considered resistant to the respective drug. Viruses showing uncharacterized novel mutations were described as showing reduced susceptibility to the respective drug and were analyzed further.
Pyrosequencing
Pyrosequencing was performed on outliers to detect known molecular markers in the NA associated with reduced susceptibility to NAIs, using the PyroMark ID platform (Qiagen, Valencia, CA, USA), as previously described.26, 27 Viruses showing admixture of wild‐type and variant nucleotides by sequence analysis (SQA) were further assessed by single‐nucleotide polymorphism (SNP) analysis to determine proportions of wild‐type and variant genotypes. Details on materials and methods used for pyrosequencing can be obtained from the CDC upon request (email: fluantiviral@cdc.gov).
Sequencing
Full sequence analysis of the NA gene by dideoxy chain termination method was performed on all outliers as previously described.10 The N1 NA and straight numbering systems are used to describe amino acid changes throughout the text. The NA sequences generated in this study were deposited in GISAID (http://www.gisaid.org).
Results
Geographic distribution of viruses collected during the 2011 Southern Hemisphere influenza season
Each influenza virus type/subtype was almost equally represented in the study (Table 1), which corresponded well with viruses that circulated globally during the period defining the 2011 Southern Hemisphere influenza season (April 01–September 30, 2011). Among the viruses collected from NH countries, a slightly higher proportion of influenza B viruses (40%) were tested, while a much higher proportion of influenza A (H3N2) viruses (56%) were tested among those collected from SH countries. The majority of the viruses collected and tested were from the NH (67%), while 26% were from the SH, and 7% were from countries situated in both hemispheres. Most of the NH viruses were collected in Asia (40%) and North America (39%), while most SH viruses (86%) were from South American countries, and majority of NH/SH viruses (85%) were from Africa.
Among individual countries, the United States in North America (in the NH) submitted the highest number of viruses (n = 227) of all types/subtypes, while Chile and Argentina, both temperate South American countries (in the SH), submitted the highest number of all virus types/subtypes among viruses collected in that region, n = 66 and n = 53, respectively (data not shown).
Temporally, at a global level, the majority (27%) of all virus types/subtypes tested were collected in the month of April (Table 1), while September recorded the least number (11%) of viruses tested globally. In the NH, the highest number of viruses (35%) tested among all types/subtypes was collected in April, while in the SH, most tested viruses (31%) were collected in June.
Susceptibility of seasonal influenza viruses to the FDA‐approved and investigational neuraminidase inhibitors
Influenza A and B virus isolates (n = 1079) collected in 34 states of US (n = 227) and 51 other countries (n = 852), between April 01, 2011, and September 30, 2011, were tested for susceptibility to NAIs in the fluorescent NI assay, as part of surveillance activities for the “2011 Southern Hemisphere Season.” Viruses passaged in MDCK cells were tested for susceptibility to oseltamivir, zanamivir, and peramivir. A subset of viruses (n = 98) were also tested against laninamivir.
The NAI susceptibility for each virus was initially evaluated based on an IC50 cutoff (Table 3) statistically established for each drug and virus type/subtype to enable identification of outliers (with significantly higher or lower IC50s compared with other viruses). Outliers underwent genetic testing by pyrosequencing and/or conventional sequencing to detect known and/or novel markers associated with reduced susceptibility to NAIs. Those showing NA mutations associated with NAI resistance were characterized as resistant to the respective drug. Mild outliers with no apparent genetic changes in the NA even upon full sequencing of the NA gene were considered NAI susceptible. All outliers with IC50s 3 IQR below the 25th percentile were considered NAI susceptible for the respective drug; however, those showing uncharacteristically low IC50s for a virus type/subtype were tested by real‐time PCR to confirm that they were correctly typed and subtyped.
Table 3.
Neuraminidase inhibitor susceptibility of influenza surveillance isolates collected between April 01, 2011, and September 30, 2011, by fluorescent NI assay
| NAI | Type/subtype | IC50 (nm) | ||||||||||
|---|---|---|---|---|---|---|---|---|---|---|---|---|
| Including outliers | Excluding outliers | |||||||||||
| No. of isolates (n)a | Min–Maxb | Q1c | Mediand | Q3e | IQRf | Statistical cutoffg | No. of isolates (n)h | Min–Maxi | Mean (± SD)j | Mediank | ||
| Oseltamivir | A/H1N1pdm09 | 326 | 0·10–194·34 | 0·16 | 0·20 | 0·26 | 0·10 | 0·56 | 313 | 0·10–0·56 | 0·22 ± 0·08 | 0·20 |
| A/H3N2 | 407 | 0·03–0·27 | 0·11 | 0·13 | 0·15 | 0·04 | 0·27 | 407 | 0·03–0·27 | 0·13 ± 0·04 | 0·13 | |
| B | 346 | 2·13–68·70 | 6·28 | 9·51 | 14·02 | 7·74 | 37·24 | 344 | 2·13–33·22 | 10·43 ± 5·24 | 9·51 | |
| Zanamivir | A/H1N1pdm09 | 326 | 0·08–1·74 | 0·20 | 0·22 | 0·25 | 0·05 | 0·40 | 315 | 0·08–0·40 | 0·23 ± 0·05 | 0·22 |
| A/H3N2 | 407 | 0·14–1·37 | 0·27 | 0·33 | 0·43 | 0·16 | 0·91 | 403 | 0·14–0·89 | 0·37 ± 0·13 | 0·33 | |
| B | 346 | 0·46–11·73 | 0·94 | 1·23 | 1·67 | 0·73 | 3·86 | 345 | 0·46–3·24 | 1·34 ± 0·53 | 1·23 | |
| Peramivir | A/H1N1pdm09 | 326 | 0·03–17·47 | 0·05 | 0·06 | 0·07 | 0·02 | 0·13 | 318 | 0·03–0·13 | 0·06 ± 0·02 | 0·06 |
| A/H3N2 | 407 | 0·04–0·29 | 0·08 | 0·10 | 0·13 | 0·05 | 0·28 | 405 | 0·04–0·28 | 0·11 ± 0·04 | 0·10 | |
| B | 346 | 0·15–210·68 | 0·46 | 0·66 | 0·99 | 0·53 | 2·58 | 337 | 0·15–2·47 | 0·77 ± 0·44 | 0·64 | |
| Laninamivir | A/H1N1pdm09 | 42 | 0·13–0·39 | 0·17 | 0·19 | 0·20 | 0·03 | 0·29 | 38 | 0·13–0·29 | 0·18 ± 0·03 | 0·18 |
| A/H3N2 | 33 | 0·25–0·80 | 0·34 | 0·37 | 0·40 | 0·06 | 0·58 | 32 | 0·25–0·50 | 0·37 ± 0·05 | 0·37 | |
| B | 23 | 0·62–2·67 | 1·24 | 1·41 | 1·77 | 0·53 | 3·36 | 23 | 0·62–2·67 | 1·50 ± 0·49 | 1·41 | |
Number of all tested isolates, including outliers that were analyzed to determine statistical cutoff for outliers.
Minimum to maximum IC50 values for all tested viruses.
Q1: first quartile (25th percentile; X0·25) for all tested viruses.
Median (Q2): second quartile (50th percentile; X0·50) for all tested viruses.
Q3: third quartile (75th percentile; X0·75) for all tested viruses.
IQR: interquartile range (IQR = Q3–Q1).
Statistical cutoff for IC50 values for NAI susceptibility, set at 3 interquartile ranges (3 IQR) from the 75th percentile (= X 0·75 + 3 IQR). Outliers with IC50 above this cutoff and >10 times the mean IC50 for each drug were characterized as extreme outliers. Mild outliers were isolates with IC50 >X 0·75 + 3 IQR, but >twofold and <10‐fold that of the mean IC50 of the drug for the virus type/subtype.
Number of isolates analyzed to determine mean and median IC50s for the drug (outliers excluded).
Minimum to maximum IC50 values for isolates analyzed to determine mean and median IC50s for the drug (outliers excluded).
Mean and standard deviation (SD) of IC50 values for the drug among susceptible viruses (outliers excluded).
Median of IC50 values for the drug among susceptible viruses (outliers excluded).
Table 3 shows mean IC50 values ± standard deviation (SD) and median for influenza A and B viruses for each NAI. Overall, the influenza A(H1N1)pdm09 viruses exhibited similar sensitivities to oseltamivir, zanamivir, and laninamivir, but were fourfold more sensitive to peramivir compared with the other three NAIs (P = < 0·001). The influenza A(H3N2) viruses were threefold more sensitive to oseltamivir and peramivir, than to zanamivir and laninamivir. Influenza B viruses were less sensitive to oseltamivir than to zanamivir, peramivir, and laninamivir, by seven‐, 13‐ and 10‐fold, respectively (P = < 0·001).
Among type A viruses, A(H1N1)pdm09 viruses were approximately twofold less susceptible to oseltamivir, but approximately twofold more sensitive to zanamivir, peramivir, and laninamivir compared with A(H3N2) viruses. Generally, the type B viruses exhibited lower sensitivity to all four NAIs compared with influenza A viruses, but most dramatically to oseltamivir, where B viruses had 80‐ and 47‐fold lower susceptibility to the drug compared with both influenza A(H1N1)pdm09 and A(H3N2) viruses, respectively.
All influenza A(H1N1)pdm09 viruses tested with oseltamivir (n = 326) were sensitive to the drug (Table 3), with exception of three extreme outliers (Table 4). These outliers exhibited IC50s that were approximately 800‐, 300‐ and 19‐fold, respectively, greater than the mean IC50 for the drug (0·22 ± 0·08 nm). Genetic analysis showed that the isolate A/Puerto Rico/09/2011 harbored the oseltamivir resistance conferring H275Y mutation in the NA, while the isolate A/Alberta/RV1242/2011 consisted of a mixed population of H275 wild‐type virus and H275Y variants (H275H/Y), in addition to a mix of D199 wild‐type and D199N variants (D199D/N; D198D/N in N2 numbering). The H275H/Y mix comprised of 54·2% wild‐type virus and 45·8% variants, while the D199D/N mix comprised of 43% wild‐type virus and 57% variants. Of note, IC50 values for oseltamivir (69·92 nm) and peramivir (6·48 nm) for this virus were approximately threefold less than those for the isolate A/Puerto Rico/09/2011 with the dominant H275Y mutation, respectively (Table 4). Another extreme outlier for oseltamivir, the isolate A/Santiago/14689/2011, which exhibited the least fold difference in IC50 for oseltamivir (19‐fold) compared with the mean IC50 for the drug, did not have the H275Y mutation. Instead, this virus contained a previously unreported substitution in the NA, N325K (N1 and N2 numbering). However, it is unknown whether the N325K substitution was present before the virus' passage in MDCK cells due to unavailability of clinical material. In addition to the extreme oseltamivir outliers, a total of 10 influenza A(H1N1)pdm09 viruses were mild outliers to oseltamivir with IC50s that were three‐ to sixfold greater than the mean IC50 for the drug. Some of these outliers showed genetic changes in the NA (Table 4), including A/Vietnam/108/2011 with F147V (F143V in N2 numbering) mutation and A/Santiago/15706/2011 with G460S (G461S in N2 numbering) mutation, which exhibited six‐ and fourfold increases in IC50, respectively, compared with the mean IC50 for the drug. Other influenza A(H1N1)pdm09 outliers for oseltamivir were A/Dominican Republic/5507/2011 and A/Brazil/568/2011, both with S247N (S246N in N2 numbering) mutation in the NA, as well as A/Puerto Rico/05/2011 and A/Bolivia/258/2011, both of which had D199N (D198N in N2 numbering) mutation.
Table 4.
Amino acid changes detected in outliers for neuraminidase inhibitors among influenza A and B virus isolates
| GISAID accession | Strain designation | Type/subtype | Date collected | AAa changes in NA (N1/straight numbering) | AA changes in NA (N2 numbering) | IC50 (nm)b and fold differencec | ||
|---|---|---|---|---|---|---|---|---|
| Oseltamivir | Zanamivir | Peramivir | ||||||
| Extreme outliers | ||||||||
| EPI366310 | A/Puerto Rico/09/2011 | A(H1N1)pdm09 | 07/19/11 | H275Y | H274Y | 194·34 (883) | 0·24 (1) | 17·47 (291) |
| EPI366260 | A/Alberta/RV1242/2011 | A(H1N1)pdm09 | 04/23/11 | H275H/Y, D199D/N | H274H/Y, D198D/N | 69·92 (318) | 0·67 (3) | 6·48 (108) |
| EPI366316 | A/Santiago/14689/2011 | A(H1N1)pdm09 | 07/12/11 | N325K | N325K | 4·27 (19) | 1·74 (8) | 0·16 (3) |
| EPI366210 | B/Dominican Republic/5506/2011 | B (Victoria) | 07/11/11 | H273Y | H274Y | 23·71 (2) d | 1·09 (1) | 12·43 (15) |
| EPI331163 | B/Ontario/1256/2011 | B (Victoria) | 05/06/11 | G140R, N144K | G142R, N146K | 68·70 (6) | 11·73 (10) | 210·68 (257) |
| EPI366257 | B/Ontario/006876/2011e | B (Yamagata) | 04/10/11 | H273Y | H274Y | 59·20 (9) | 0·93 (1) | 33·49 (62) |
| Mild outliers | ||||||||
| EPI366345 | A/Vietnam/108/2011 | A(H1N1)pdm09 | 04/04/11 | F174V | F173V | 1·22 (6) | 0·83 (4) | 0·06 (1) |
| EPI366319 | A/Santiago/15706/2011 | A(H1N1)pdm09 | 07/20/11 | G460S | G461S | 0·80 (4) | 1·06 (5) | 0·26 (4) |
| –f | A/Dominican Republic/5507/2011 | A(H1N1)pdm09 | 07/11/11 | S247N | S246N | 0·73 (3) | 0·39 (2) | 0·15 (3) |
| EPI366307 | A/Puerto Rico/05/2011 | A(H1N1)pdm09 | 05/31/11 | D199N | D198N | 0·65 (3) | 0·49 (2) | 0·21 (4) |
| EPI366272 | A/Bolivia/258/2011 | A(H1N1)pdm09 | 08/06/11 | D199N | D198N | 0·60 (3) | 0·43 (2) | 0·09 (2) |
| –f | A/Brazil/568/2011 | A(H1N1)pdm09 | 07/02/11 | S247N | S246N | 0·56 (3) | 0·36 (2) | 0·17 (3) |
| –f | A/Bolivia/603/2011 | A(H3N2) | 08/08/11 | D151G | D151Gf | 0·06 (0) | 1·37 (4) | 0·08 (1) |
| –f | A/Puerto Rico/34/2011 | A(H3N2) | 07/21/11 | D151D/G/N | D151D/G/Nf | 0·05 (0) | 0·94 (3) | 0·08 (1) |
| EPI340972 | B/Guatemala/16/2011 | B (Victoria) | 08/18/11 | S244P | S245P | 10·15 (1) | 3·24 (3) | 0·60 (1) |
| EPI366197 | B/Bangladesh/4013/2011 | B (Victoria) | 09/29/11 | A136S | A138S | 33·22 (3) | 0·60 (0) | 4·77 (6) |
| EPI366200 | B/Bangladesh/8008/2011 | B (Victoria) | 08/27/11 | I120V | 21·10 (2) | 0·98 (1) | 4·36 (5) | |
| EPI366238 | B/Kenya/9528/2011 | B (Victoria) | 09/30/11 | M403V | M400V | 21·76 (2) | 0·80 (1) | 3·59 (4) |
| EPI345979 | B/British Columbia/RV1383/2011 | B (Yamagata) | 09/22/11 | T106N | T110N | 20·79 (3) | 1·01 (1) | 0·85 (2) |
Bold fonts indicate outlier IC50 values for respective NAIs.
AA: amino acid changes in the NA.
Generated in fluorescent NI assay.
Compared with the mean IC50 for the drug by subtype for influenza A viruses, and by antigenic lineage for type B viruses.
Mild outlier for oseltamivir, but extreme outlier for peramivir.
Previously reported (reference 46); GenBank accession JN601140.
Tested by pyrosequencing, accession numbers not available.
Amino acid substitution not detected in matching original clinical specimens that were available for testing.
Among influenza A(H1N1)pdm09 viruses tested for zanamivir (n = 326), all showed sensitivity to the drug, except for 11 mild outliers (data not shown) whose IC50s were two‐ to eightfold greater than the mean IC50 for the drug (0·23 ± 0·05 nm; Table 3). Mild outliers for zanamivir included the two viruses mentioned above that were extreme outliers for oseltamivir, A/Alberta/RV1242/2011 with the mixed double mutations H275H/Y and D199D/N, and A/Santiago/14689/2011 with N325K mutation, which showed three‐ and eightfold increases in IC50 compared with the mean for the drug (0·23 ± 0·05 nm), respectively. Other mild outliers for zanamivir were A/Vietnam/108/2011 with F147V and A/Bolivia/258/2011 with D199N mutation; both isolates were also mild outliers for oseltamivir.
All influenza A(H1N1)pdm09 viruses tested for peramivir (n = 326) were sensitive to the drug, with the exception of the two extreme outliers mentioned above, which contained the H275Y change, A/Puerto Rico/09/2011 and A/Alberta/RV1242/2011, whose IC50s that were ~300‐ and ~100‐fold greater than the mean IC50 for the drug (0·06 ± 0·08 nm; Table 3), respectively. In addition, six mild outliers to peramivir were detected, including A/Santiago/14689/2011 with N325K mutation and A/Brazil/568/2011 with S247N mutation, both showing a threefold increase in IC50 compared with that of peramivir‐susceptible viruses.
Overall, the frequency of oseltamivir resistance was low (0·6%) among influenza A(H1N1)pdm09 viruses collected globally (n = 326), with the detection of only two viruses harboring H275Y substitution in the NA. In the United States alone, only one such virus was detected among the 55 tested influenza A(H1N1)pdm09 viruses, translating to 1·8% oseltamivir resistance. The only other country where a H275Y virus was detected was Canada, from where only three A(H1N1)pdm09 viruses were submitted to the CDC in the time period covered by this study.
Virus isolates of the A(H3N2) subtype that were tested for oseltamivir, zanamivir, and peramivir (n = 407) were all sensitive to the three NAIs, with exception of 5 mild outliers for zanamivir; two of which exhibited mutations at residue 151 of the NA, D151G and a mixed D151D/G/N mutations, respectively (Table 4). Although full NA sequence analysis revealed that a vast majority of influenza A(H3N2) virus isolates harbored mutations at residue 151, they did not exhibit significantly elevated IC50s for zanamivir and were not outliers for this drug in the fluorescent NI assay that was utilized in this study. Of note, mutations at residue 151 were not detected in matching original clinical specimens that were available for testing. Amino acid substitutions at residue D151 of the NA typically result from propagation of virus in cell culture and should therefore not be reported as molecular markers of NAI resistance.
The IC50s for all influenza B viruses tested for oseltamivir (n = 346) fell in a wide range (Table 3), but most fell below the statistical cutoff of 37·24 nm, except for those of two isolates, B/Ontario/006876/2011 and B/Ontario/1256/2011, whose IC50s were 59·20 and 68·70 nm, respectively. Both of these IC50s were only ~sixfold higher than the mean IC50 for oseltamivir for B viruses (10·43 ± 5·24 nm), which meant that these two viruses were only mild outliers for oseltamivir, based on our criterion for mild outliers (IC50 above statistical cutoff and >10‐fold mean IC50 for the drug). Full NA sequence analysis showed that B/Ontario/006876/2011 had H273Y (H274Y in N2 numbering) mutation, while B/Ontario/1256/20 had two amino acid changes, G140R and N144K (G142R and N146K in N2 numbering). The matching clinical samples were unavailable testing, and thus, the presence of the G140R and N144K substitutions prior to the virus culturing could not be ascertained. Another isolate, B/Dominican Republic/5506/2011, had the H273Y mutation in the NA, but its IC50 for oseltamivir (23·71 nm) was only approximately twofold higher than the mean IC50 of the drug for B viruses (10·43 ± 5·24 nm).
All type B isolates tested for zanamivir (n = 346) showed sensitivity to the drug, with the exception of one virus, B/Ontario/1256/2011, mentioned above as an outlier for oseltamivir, whose IC50 (11·73 nm) was approximately 10‐fold greater than that of zanamivir‐susceptible B viruses (1·34 ± 0·53 nm). Another influenza B isolate, B/Guatemala/16/2011, had the S244P (S245P in N2 numbering) mutation in the NA and was a mild outlier for zanamivir (threefold), but was sensitive to oseltamivir and peramivir (Table 4).
Among all type B viruses tested for peramivir (n = 346), three extreme outliers for the drug were detected, including B/Ontario/1110/2011, B/Ontario/1256/2011, and B/Dominican Republic/5506/2011, whose IC50s were 44‐, 277‐, and 16‐fold greater than the mean IC50 for the drug for all B viruses (0·77 ± 0·44 nm). As mentioned earlier, B/Ontario/006876/2011 was also an outlier for oseltamivir, while B/Ontario/1256/2011 was an outlier for oseltamivir and zanamivir as well. The isolate B/Dominican Republic/5506/2011 exhibited H273Y, but was an outlier for neither oseltamivir nor peramivir, based on IC50 analysis of all type B viruses.
All influenza viruses in a subset (n = 98) tested for laninamivir, including 42 A(H1N1)pdm09, 33 A(H3N2), and 23 influenza B isolates showed sensitivity to the drug, with exception of four outliers among A(H1N1)pdm09 viruses and one outlier among A(H3N2) viruses whose IC50s were only approximately twofold more than the mean IC50 for the drug (0·20 and 0·37 nm, respectively).
Susceptibility of influenza B viruses to neuraminidase inhibitors, by antigenic lineage
When IC50s were analyzed based on virus type/subtype (Table 3), influenza B viruses exhibited significantly reduced susceptibility to oseltamivir (P = < 0·001), in comparison with their sensitivity to zanamivir, peramivir, and laninamivir. As mentioned above, influenza B viruses were significantly less susceptible to oseltamivir than influenza A(H1N1)pdm09 (approximately 80‐fold) and A(H3N2) viruses (approximately 50‐fold).
The influenza B isolates also exhibited a wide range and variability of IC50s for oseltamivir (2·13–33·22 nm), even after exclusion of outliers (Table 3). Furthermore, 13 (4%) of the 344 influenza B viruses whose IC50s fell below the upper statistical cutoff for oseltamivir (37·24 nm) showed ≥twofold reduced susceptibly to oseltamivir (between 21·10 and 33·22 nm) when compared to the mean IC50 of the drug for all B viruses (10·43 ± 5·24 nm).
The seemingly reduced susceptibility to oseltamivir among type B viruses (Table 3), as well as the high variability in IC50s for the drug, prompted additional analyses, based on their genetic and antigenic lineage, to determine whether this would be a contributing factor. Of the 346 influenza B viruses tested for oseltamivir, 290 (84%) were antigenically characterized as B/Brisbane/60/2008‐like (the Victoria lineage reference virus), while 56 (16%) were characterized as B/Wisconsin/01/2010‐like (the Yamagata lineage reference virus).
Distribution analyses of IC50 values with box‐and‐whisker plots were performed for oseltamivir (Figure 1) and the other three NAIs (figures not shown), to detect outliers among viruses belonging to the Victoria and Yamagata lineages. Descriptive analyses of IC50 values were also performed, with exclusion of outliers, to determine mean and median IC50s for each drug and lineage (Table 5).
Figure 1.
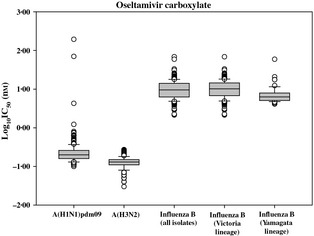
Box‐and‐whisker plots showing distribution of log‐transformed oseltamivir carboxylate IC 50s for influenza A(H1N1)pdm09 (n = 326), influenza A(H3N2) (n = 407), influenza B (n = 346), influenza B Victoria lineage (n = 290) and influenza B Yamagata lineage (n = 56) isolates. The boxes represent the 25–75th percentiles, and horizontal lines within the box represent median values. The whiskers represent the lowest and highest values in the 25th percentile minus 1·5 IQR and 75th percentile plus 1·5 IQR regions, respectively.
Table 5.
NAI susceptibility of influenza B surveillance isolates collected between April 01, 2011, and September 30, 2011, by fluorescent NI assay
| NAI | Lineagea | IC50 (nm) | ||||||||||
|---|---|---|---|---|---|---|---|---|---|---|---|---|
| Including outliers | Excluding outliers | |||||||||||
| No. of isolates (n) b | Min–Maxc | Q1d | Mediane | Q3f | IQRg | Statistical cutoffh | No. of isolates (n)i | Min–Maxj | Mean (± SD) k | Medianl | ||
| Oseltamivir | Victoria | 290 | 2·13–68·70 | 6·76 | 10·15 | 14·43 | 7·67 | 37·44 | 288 | 2·13–33·22 | 11·01 ± 5·33 | 10·13 |
| Yamagata | 56 | 4·11–59·20 | 5·10 | 6·28 | 7·89 | 2·79 | 16·26 | 49 | 4·11–12·34 | 6·57 ± 2·02 | 6·01 | |
| Zanamivir | Victoria | 290 | 0·46–11·73 | 0·89 | 1·18 | 1·42 | 0·53 | 3·01 | 286 | 0·46–2·82 | 1·23 ± 0·44 | 1·18 |
| Yamagata | 56 | 0·83–3·02 | 1·49 | 1·88 | 2·24 | 0·75 | 4·49 | 53 | 0·83–3·02 | 1·86 ± 0·53 | 1·89 | |
| Peramivir | Victoria | 290 | 0·15–210·68 | 0·47 | 0·72 | 1·08 | 0·61 | 2·91 | 283 | 0·15–2·70 | 0·83 ± 0·49 | 0·70 |
| Yamagata | 56 | 0·26–33·49 | 0·46 | 0·52 | 0·60 | 0·14 | 1·02 | 52 | 0·26–1·00 | 0·54 ± 0·14 | 0·52 | |
| Laninamivir | Victoria | 20 | 0·62–2·67 | 1·27 | 1·43 | 1·77 | 0·50 | 3·27 | 20 | 0·62–2·67 | 1·52 ± 0·52 | 1·43 |
| Yamagata | 3 | 1·17–1·47 | 1·17 | 1·40 | 1·47 | 0·30 | 2·37 | 3 | 1·17–1·47 | 1·35 ± 0·16 | 1·40 | |
Antigenic lineages determined for HA.
Number of all tested isolates, including outliers that were analyzed to determine statistical cutoff for outliers.
Minimum to maximum IC50 values for all tested viruses.
Q1: first quartile (25th percentile; X0·25) for all tested viruses.
Median (Q2): second quartile (50th percentile) for all tested viruses.
Q3: third quartile (75th percentile; X0·75) for all tested viruses.
IQR: interquartile range (IQR = Q3–Q1).
Statistical cutoff for IC50 values for NAI susceptibility, set at 3 interquartile ranges (3 IQR) from the 75th percentile (= X0·75 + 3 IQR). Outliers with IC50 above this cutoff and >10 times the mean IC50 for each drug were characterized as extreme outliers. Mild outliers were isolates with IC50 >X0·75 + 3 IQR, but >twofold and <10‐fold that of the mean IC50 of the drug for the virus type/subtype.
Number of isolates analyzed to determine mean and median IC50s for the drug.
Minimum to maximum IC50 values for isolates analyzed to determine mean and median IC50s for the drug (outliers excluded).
Mean and standard deviation (SD) of IC50 values for the drug among susceptible viruses (outliers excluded).
Median of IC50 values for the drug among susceptible viruses (outliers excluded).
When IC50s were analyzed by lineage (Table 5), viruses belonging to the Victoria lineage exhibited approximately twofold greater mean IC50 for oseltamivir (11·01 ± 5·33 nm) than viruses of Yamagata lineage (6·57 ± 2·02 nm), suggesting that the latter group of viruses was more susceptible to the drug. Of note, the mean IC50 for oseltamivir among Victoria lineage influenza B viruses was not significantly different from that of the entire type B virus population (10·43 ± 5·24 nm), which was expected because the majority (84%) of the B viruses in the study were of Victoria lineage.
Among viruses of the Victoria lineage, only two outliers for oseltamivir were detected (Table 4), B/Dominican Republic/5506/2011 with H273Y and B/Ontario/1256/2011, which had previously uncharacterized changes in the NA, G140R and N144K. Their IC50s for oseltamivir were two‐ and sixfold greater than mean IC50 of the drug for this lineage (11·01 ± 5·33 nm), respectively. Both isolates were extreme outliers for peramivir, while B/Ontario/1256/2011 was an extreme outlier for zanamivir as well. The few of the mild outliers for oseltamivir, zanamivir, and peramivir detected among viruses of Victoria lineage showed various amino acid changes in the NA (Table 4).
Among influenza B viruses of the Yamagata lineage, only one extreme outlier for oseltamivir was detected (Table 4), the isolate B/Ontario/006876/2011 with H273Y mutation, which was also an extreme outlier for peramivir but not for zanamivir. In addition, three mild outliers for oseltamivir were detected among B viruses of the Yamagata lineage, including B/British Columbia/RV1383/2011, which had a T106N (T110N in N2 numbering) amino acid change in the NA. There were no outliers for zanamivir among influenza B viruses of the Yamagata lineage.
In contrast to oseltamivir, there were no apparent differences in IC50s for zanamivir, peramivir, or laninamivir between viruses belonging to the Victoria and Yamagata lineages (Table 5).
Discussion
Influenza is an emerging and re‐emerging respiratory pathogen affecting humans worldwide, usually prevalent in temperate regions as annually recurring outbreaks referred to as the influenza season. The influenza activity typically occurs between November and March in the temperate Northern Hemisphere (north of the Tropic of Cancer) and between April and September in the temperate Southern Hemisphere (south of the Tropic of Capricorn),32 usually peaking during cold winter months,20, 33 with a temporal overlap of influenza activity between both hemispheres.34, 35 During seasonal epidemics, dominant types/subtypes of influenza virus are described, which may vary within hemispheres and in their impact on morbidity. For this reason, twice a year, the WHO makes recommendations for the composition of seasonal influenza vaccines that are published before the start of the influenza season in each respective hemisphere, in February and in September.36
For virus surveillance, the Influenza Division at the CDC receives domestic US specimens collected through state surveillance, and as one of the five WHO Influenza Collaborating Centers, it also receives viruses from other countries and territories worldwide for antigenic and genetic characterization, and antiviral susceptibility assessment.37 The CDC usually requests participating laboratories to submit viruses that are representative of each type and subtype. In this study, based on the types/subtypes of influenza viruses collected between April 01, 2011, and September 30, 2011, that were tested, influenza B viruses were the predominant virus type from countries in the NH, while influenza A(H3N2) viruses were the predominant virus subtype from the SH. Temporally, the highest number of tested viruses from the NH and SH was collected in April and June, respectively.
This study reports for the first time the use of a commercially developed fluorescent NI assay, the NA‐Fluor™ Influenza Neuraminidase Assay Kit, to assess the NAI susceptibility of a large group of circulating human influenza A and B viruses. We established NAI susceptibility cutoff IC50 values for each NAI and influenza virus type/subtype using the criterion of 3 IQR from the 25th (X 0·25−3 IQR) and 75th percentile (X 0·75 + 3 IQR) to detect outliers. We further characterized extreme outliers as viruses with IC50 above the upper cutoff (X 0·75 + 3 IQR) in addition to IC50 >10‐fold the mean IC50 for the respective NAI, while mild outliers were above the upper cutoff with IC50 >twofold and <10‐fold that of the respective NAI. We elected this criterion because the classical criterion 1·5 IQR from the 25th and 75th percentiles (the position of whiskers on a box plot) resulted in the detection of too many mild outliers with no apparent changes in the NA. Based on our criteria, the majority of the viruses tested showed sensitivity to all three NAIs that were evaluated. In addition, a subset of viruses tested with the newer NAI, laninamivir, showed sensitivity to this drug, with IC50s in ranges similar to those of zanamivir. This observation was expected because zanamivir and laninamivir share structural similarity.38 Earlier surveillance studies7, 39 used box‐and‐whisker plot analyses to identify two kinds of outliers, mild (1·5–3 IQR from the 25th and 75th percentiles) and extreme (3 IQR from the 25th and 75th percentiles and at least >10‐fold mean IC50). Another study40 using box‐and‐whisker plot analysis identified outliers based on IC50 1·5 IQR from the 25th and 75th percentiles, while in another study,41 isolates with IC50 values outside the 95% confidence limits (mean IC50 ± 2 SD) were characterized as outliers. One study10 used the criterion of “mean IC50 value + 3 SD” to identify outliers; extreme outliers were isolates with IC50s outside this criterion and >10‐fold the mean IC50 for each respective type/subtype and drug, and mild outliers were those with IC50s outside the cutoff criterion but <10‐fold the mean IC50 value.
The main goal of antiviral susceptibility surveillance is to detect the emergence/spread of drug resistant variants (such as H275Y) and to recognize a change in the drug susceptibility of viruses compared with those circulating in the previous season. In this study, the H275Y substitution was detected in only 2 (0·6%) of the 326 influenza A(H1N1)pdm09 viruses, one of which contained a mix of H275Y and H275 wild‐type viruses, in addition to a mix of D199N and D199 wild‐type viruses, and was three times less resistant to oseltamivir and peramivir than the other resistant virus, which was predominantly H275Y. In addition, we detected a novel amino acid substitution N325K in the NA of one A(H1N1)pdm09 isolate, A/Santiago/14689/2011, which exhibited significantly reduced susceptibility to oseltamivir (19‐fold), and mildly reduced sensitivity to zanamivir and peramivir. Of note, the N325K lies outside the NA enzyme active site. This mutation is rare and has been detected at very low frequency (0·01%) among influenza A(H1N1)pdm09 viruses collected since 2009 to date (data not shown).
Novel NA substitutions were also detected in one influenza B isolate, B/Ontario/1256/2011, with G140R and N144K, which showed significantly reduced susceptibility to zanamivir and peramivir, but only mildly reduced sensitivity to oseltamivir. We also detected two A(H1N1)pdm09 viruses with S247N substitution in the NA, both showing mildly reduced susceptibility to oseltamivir and peramivir. A similar influenza A(H1N1)pdm09 virus S247N variant with mildly reduced oseltamivir and zanamivir sensitivity was detected in more than 10% of community specimens in Singapore and more than 30% of samples from northern Australia during the early months of 2011.42 This variant was also detected in other regions of the Asia‐Pacific. When combined with the H275Y substitution, as detected in an oseltamivir‐treated patient, the dual S247N+H275Y mutant exhibited extremely high oseltamivir resistance.42 This finding emphasizes a need to monitor for NA changes such as the S247N substitution, which by itself causes only a mild decrease in susceptibility to NAIs, but when present in combination with substitutions, such as H275Y, has the potential to dramatically augment resistance to NAIs. An important limitation of this study was the unavailability of original clinical specimens matching virus isolates with previously unreported changes in the NA, such as A/Santiago/14689/2011 with N325K substitution and B/Ontario/1256/2011 with G140R and N144K substitutions. It is imperative that changes in the NA that are detected in cell culture–grown isolates are confirmed in matching original specimens, because the MDCK cells have been shown to provide growth advantage to particular virus variants with altered susceptibility to NAIs, even in the absence of drug pressure.23, 24
Similarly to previous studies utilizing the fluorescent NI assay, influenza viruses exhibited apparent difference in levels of sensitivity to the two FDA‐approved NAIs, oseltamivir and zanamivir, depending on their antigenic type/subtype. Noteworthy, influenza B viruses exhibited significantly (50–80‐fold) reduced susceptibility to oseltamivir compared with influenza A viruses, a finding previously reported in several studies.7, 41 Such dramatic differences complicate the overall analysis of susceptibility and necessitate establishing a type/subtype by serological or molecular methods prior to (or in parallel with) the assessment of drug susceptibility. Further statistical analyses of IC50 data for influenza B viruses, performed by lineage, revealed that viruses of the Victoria lineage were less susceptible (twofold) to oseltamivir than viruses of the Yamagata lineage. Since 1983, two lineages influenza B viruses, Victoria or Yamagata lineages that are distinct at the genetic and antigenic levels, have cocirculated worldwide.43 Antibodies produced against these two lineages of influenza B viruses have shown no cross‐protection;44 therefore, the WHO recommends influenza B component of the vaccine strain on the basis of virus that may become predominant B virus in the coming season. Although recent viruses from both antigenic lineages contain the NA from the Yamagata lineage,45 the continuous evolution has led to genetic (and possibly antigenic) divergence among the NA of Yamagata and Victoria lineages, suggesting differences in NAI susceptibility between the two lineages.
Overall, during the 2011 Southern Hemisphere season, oseltamivir resistance among A(H1N1)pdm09 viruses was low (0·6%). This low trend is similar to that seen in previous seasons, since the emergence of the 2009 H1N1 pandemic virus.16, 17 Among influenza B viruses, the corresponding H273Y mutation, associated with reduced susceptibility to oseltamivir and peramivir in this virus type, was detected in only two (0·6%) viruses. One of these H273Y variants, B/Ontario/006876/2011, was previously detected by Public Health Ontario surveillance46 using the chemiluminescent NI assay, where it exhibited reduced susceptibility to oseltamivir and peramivir, as it did in the present study.
Despite the low incidence of oseltamivir resistance observed during the 2011 Southern Hemisphere season, the spread of oseltamivir‐resistant A(H1N1)pdm09 viruses is still a concern and may develop as a result of selective pressure or spontaneous mutation, such as the cluster of oseltamivir‐resistant H275Y variants detected in the Hunter New England region of New South Wales, Australia.18, 19 Therefore, it remains prudent to continue conducting NAI sensitivity testing of viruses to monitor emergence of H275Y and other NAI‐resistant virus variants, particularly if the use of NAIs increases in the community.
The NI method used in this study has been shown to be well suited for the surveillance of drug resistance, particularly as it has been reported to be more predictive of in vivo susceptibility than cell based assays.47 While detection of H275Y variants can be readily performed using the fluorescent NI assay, especially when all three NAIs used in this study provide a clearly recognized IC50 pattern, the detection of H275Y variants present in mixed populations or that of novel amino acid substitutions which may alter NAI susceptibility may not be as apparent in such a functional assay; hence, additional genetic testing of potentially resistant viruses is vital. Targeted surveillance directed to the isolation and testing of influenza viruses from immunocompetent or immunocompromised individuals undergoing treatment with NAIs may allow a more focused and thorough assessment of the potential for influenza viruses to develop clinically significant resistance to these compounds. In addition, monitoring could be enhanced by detection of H275Y directly on clinical specimens using molecular methods, including pyrosequencing25, 26, 27 or real‐time RT‐PCR techniques.28, 29
With the development of the new NA‐Fluor™ commercial kit, the fluorescent‐based NI assay has become the functional (phenotypic) method of choice for monitoring the susceptibility of influenza viruses to NAIs at the CDC. Of note, the fluorescent NI assay has been shown to provide the greater discrimination between IC50 values of oseltamivir‐susceptible and oseltamivir‐resistant H275Y variants compared with the chemiluminescent assay.48 The NA‐Fluor™ Kit comes with the manufacturer's protocol, which facilitates harmonization of the testing in laboratories worldwide. The NA‐Fluor™ assay used in this study was performed similarly to the fluorescent‐based assay previously used at the CDC which used in‐house‐prepared reagents,48 although the latter is more prone to interassay variability. Previous studies have shown that the absolute IC50 value as well as a fold difference compared with a control, used to determine virus susceptibility, is affected by a variety of factors such as a choice of buffer system, substrate, and NA enzyme concentration.49 We made a few modifications to the manufacturer's protocol provided in the NA‐Fluor™ Kit, to address specific needs and requirements and to optimize the assay in order to reduce background noise and maintain the signal for NA activity within the linear range for the assay.
The results of this study establish a baseline for influenza NAI susceptibility data generated using the commercial NA‐Fluor™ Influenza Neuraminidase Assay Kit and reiterate that constant monitoring of resistance to NAIs should be sustained.
Author contributions
Kristina Ballenger contributed to validation of the NA‐Fluor ™ Influenza Neuraminidase Inhibition Assay Kit. Vasiliy P. Mishin facilitated development of the second version of the JASPR curve‐fitting software. Marnie Levine contributed to pyrosequencing assay design and analysis of influenza viruses and clinical specimens. Rebecca J. Garten contributed to analysis of Sanger sequencing data.
Disclaimer
We declare that we have no potential conflict of interests. The findings and conclusions of this report are those of the authors and do not necessarily represent the views of the Centers for Disease Control and Prevention (CDC).
Supporting information
Figure S1. Box‐and‐whisker plots showing distribution of log‐transformed oseltamivir carboxylate IC50s for influenza A(H1N1)pdm09 (n = 326), influenza A(H3N2) (n = 407) and influenza B (n = 346).
Figure S2. Box‐and‐whisker plots showing distribution of log‐transformed zanamivir IC50s for influenza A(H1N1)pdm09 (n = 326), influenza A(H3N2) (n = 407) and influenza B (n = 346).
Figure S3. Box‐and‐whisker plots showing distribution of log‐transformed peramivir IC50s for influenza A(H1N1)pdm09 (n = 326), influenza A(H3N2) (n = 407) and influenza B (n = 346).
Figure S4. Box‐and‐whisker plots showing distribution of log‐transformed laninamivir IC50s for influenza A(H1N1)pdm09 (n = 326), influenza A(H3N2) (n = 407) and influenza B (n = 346).
Acknowledgements
We wish to thank our collaborators in the WHO's Global Influenza Surveillance and Response System (GISRS) and United States public health laboratories for the submission of influenza virus isolates and clinical specimens. We also thank our colleagues from the Virus Reference Team and Influenza Sequence Activity Team, Influenza Division, CDC, for their valuable assistance on this project.
Okomo‐Adhiambo et al (2013) Neuraminidase inhibitor susceptibility surveillance of influenza viruses circulating worldwide during the 2011 Southern Hemisphere season. Influenza and Other Respiratory Viruses 7(5), 645–658
References
- 1. Pinto LH, Lamb RA. The M2 proton channels of influenza A and B viruses. J Biol Chem 2006; 281:8997–9000. [DOI] [PubMed] [Google Scholar]
- 2. CDC . High levels of adamantane resistance among influenza A (H3N2) viruses and interim guidelines for use of antiviral agents–United States, 2005–2006 influenza season. MMWR Morb Mortal Wkly Rep 2006; 55:44–46. [PubMed] [Google Scholar]
- 3. Gubareva LV, Trujillo AA, Okomo‐Adhiambo M et al Comprehensive assessment of 2009 pandemic influenza A (H1N1) virus drug susceptibility in vitro. Antivir Ther 2010; 15:1151–1159. [DOI] [PubMed] [Google Scholar]
- 4. Shetty AK, Peek LA. Peramivir for the treatment of influenza. Expert Rev Anti Infect Ther 2012; 10:123–143. [DOI] [PubMed] [Google Scholar]
- 5. Sugaya N, Kohno S, Ishibashi T, Wajima T, Takahashi T. Efficacy, safety, and pharmacokinetics of intravenous peramivir in children with 2009 pandemic H1N1 influenza A virus infection. Antimicrob Agents Chemother 2012; 56:369–377. [DOI] [PMC free article] [PubMed] [Google Scholar]
- 6. Sunagawa S, Higa F, Cash HL, Tateyama M, Uno T, Fujita J. Single‐dose inhaled laninamivir: registered in Japan and its potential role in control of influenza epidemics. Influenza Other Respi Viruses 2013; 7:1–3. [DOI] [PMC free article] [PubMed] [Google Scholar]
- 7. Monto AS, McKimm‐Breschkin JL, Macken C et al Detection of influenza viruses resistant to neuraminidase inhibitors in global surveillance during the first 3 years of their use. Antimicrob Agents Chemother 2006; 50:2395–2402. [DOI] [PMC free article] [PubMed] [Google Scholar]
- 8. Mungall BA, Xu X, Klimov A. Surveillance of influenza isolates for susceptibility to neuraminidase inhibitors during the 2000–2002 influenza seasons. Virus Res 2004; 103:195–197. [DOI] [PubMed] [Google Scholar]
- 9. CDC . Influenza activity–United States and worldwide, May 18‐September 19, 2008. MMWR Morb Mortal Wkly Rep 2008; 57:1046–1049. [PubMed] [Google Scholar]
- 10. Sheu TG, Deyde VM, Okomo‐Adhiambo M et al Surveillance for neuraminidase inhibitor resistance among human influenza A and B viruses circulating worldwide from 2004 to 2008. Antimicrob Agents Chemother 2008; 52:3284–3292. [DOI] [PMC free article] [PubMed] [Google Scholar]
- 11. Hauge SH, Dudman S, Borgen K, Lackenby A, Hungnes O. Oseltamivir‐resistant influenza viruses A (H1N1), Norway, 2007–2008. Emerg Infect Dis 2009; 15:155–162. [DOI] [PMC free article] [PubMed] [Google Scholar]
- 12. Lackenby A, Hungnes O, Dudman SG et al Emergence of resistance to oseltamivir among influenza A(H1N1) viruses in Europe. Euro Surveill 2008; 13:pii–8026. [DOI] [PubMed] [Google Scholar]
- 13. Besselaar TG, Naidoo D, Buys A et al Widespread oseltamivir resistance in influenza A viruses (H1N1), South Africa. Emerg Infect Dis 2008; 14:1809–1810. [DOI] [PMC free article] [PubMed] [Google Scholar]
- 14. CDC . Update: influenza activity–United States, September 28, 2008‐April 4, 2009, and composition of the 2009–2010 influenza vaccine. MMWR Morb Mortal Wkly Rep 2009; 58:369–374. [PubMed] [Google Scholar]
- 15. Baranovich T, Saito R, Suzuki Y et al Emergence of H274Y oseltamivir‐resistant A(H1N1) influenza viruses in Japan during the 2008–2009 season. J Clin Virol 2010; 47:23–28. [DOI] [PubMed] [Google Scholar]
- 16. Graitcer SB, Gubareva L, Kamimoto L et al Characteristics of patients with oseltamivir‐resistant pandemic (H1N1) 2009, United States. Emerg Infect Dis 2011; 17:255–257. [DOI] [PMC free article] [PubMed] [Google Scholar]
- 17. Storms AD, Gubareva LV, Su S et al Oseltamivir‐resistant pandemic (H1N1) 2009 virus infections, United States, 2010–2011. Emerg Infect Dis 2012; 18:308–311. [DOI] [PMC free article] [PubMed] [Google Scholar]
- 18. Hurt AC, Hardie K, Wilson NJ et al Community transmission of oseltamivir‐resistant A(H1N1)pdm09 influenza. N Engl J Med 2011a; 365:2541–2542. [DOI] [PubMed] [Google Scholar]
- 19. Hurt AC, Hardie K, Wilson NJ et al Characteristics of a widespread community cluster of H275Y oseltamivir‐resistant A(H1N1)pdm09 influenza in Australia. J Infect Dis 2012; 206:148–157. [DOI] [PMC free article] [PubMed] [Google Scholar]
- 20. Hope‐Simpson RE. The role of season in the epidemiology of influenza. J Hyg (Lond) 1981; 86:35–47. [DOI] [PMC free article] [PubMed] [Google Scholar]
- 21. Buxton RC, Edwards B, Juo RR, Voyta JC, Tisdale M, Bethell RC. Development of a sensitive chemiluminescent neuraminidase assay for the determination of influenza virus susceptibility to zanamivir. Anal Biochem 2000; 280:291–300. [DOI] [PubMed] [Google Scholar]
- 22. Potier M, Mameli L, Belisle M, Dallaire L, Melancon SB. Fluorometric assay of neuraminidase with a sodium (4‐methylumbelliferyl‐alpha‐D‐N‐acetylneuraminate) substrate. Anal Biochem 1979; 94:287–296. [DOI] [PubMed] [Google Scholar]
- 23. Hurt AC, Holien JK, Parker M, Kelso A, Barr IG. Zanamivir‐resistant influenza viruses with a novel neuraminidase mutation. J Virol 2009; 83:10366–10373. [DOI] [PMC free article] [PubMed] [Google Scholar]
- 24. Okomo‐Adhiambo M, Nguyen HT, Sleeman K et al Host cell selection of influenza neuraminidase variants: implications for drug resistance monitoring in A(H1N1) viruses. Antiviral Res 2010a; 85:381–388. [DOI] [PubMed] [Google Scholar]
- 25. Deyde VM, Gubareva LV. Influenza genome analysis using pyrosequencing method: current applications for a moving target. Expert Rev Mol Diagn 2009; 9:493–509. [DOI] [PubMed] [Google Scholar]
- 26. Deyde VM, Okomo‐Adhiambo M, Sheu TG et al Pyrosequencing as a tool to detect molecular markers of resistance to neuraminidase inhibitors in seasonal influenza A viruses. Antiviral Res 2009; 81:16–24. [DOI] [PubMed] [Google Scholar]
- 27. Deyde VM, Sheu TG, Trujillo AA et al Detection of molecular markers of drug resistance in 2009 pandemic influenza A (H1N1) viruses by pyrosequencing. Antimicrob Agents Chemother 2010; 54:1102–1110. [DOI] [PMC free article] [PubMed] [Google Scholar]
- 28. Bolotin S, Robertson AV, Eshaghi A et al Development of a novel real‐time reverse‐transcriptase PCR method for the detection of H275Y positive influenza A H1N1 isolates. J Virol Methods 2009; 158:190–194. [DOI] [PMC free article] [PubMed] [Google Scholar]
- 29. Hindiyeh M, Ram D, Mandelboim M et al Rapid detection of influenza A pandemic (H1N1) 2009 virus neuraminidase resistance mutation H275Y by real‐time reverse transcriptase PCR. J Clin Microbiol 2010; 48:1884–1887. [DOI] [PMC free article] [PubMed] [Google Scholar]
- 30. WHO . Available at http://www.who.int/influenza/resources/documents/manual_diagnosis_surveillance_influenza/en/index.html
- 31. Okomo‐Adhiambo M, Sleeman K, Ballenger K et al Neuraminidase inhibitor susceptibility testing in human influenza viruses: a laboratory surveillance perspective. Viruses 2010b; 2:2269–2289. [DOI] [PMC free article] [PubMed] [Google Scholar]
- 32. Depoortere E, Mantero J, Lenglet A, Kreidl P, Coulombier D. Influenza A(H1N1)v in the southern hemisphere–lessons to learn for Europe? Euro Surveill 2009; 14:pii–19246. [DOI] [PubMed] [Google Scholar]
- 33. Simonsen L. The global impact of influenza on morbidity and mortality. Vaccine 1999; 17(Suppl 1):S3–S10. [DOI] [PubMed] [Google Scholar]
- 34. Finkelman BS, Viboud C, Koelle K, Ferrari MJ, Bharti N, Grenfell BT. Global patterns in seasonal activity of influenza A/H3N2, A/H1N1, and B from 1997 to 2005: viral coexistence and latitudinal gradients. PLoS ONE 2007; 2:e1296. [DOI] [PMC free article] [PubMed] [Google Scholar]
- 35. Kenah E, Chao DL, Matrajt L, Halloran ME, Longini IM Jr. The global transmission and control of influenza. PLoS ONE 2011; 6:e19515. [DOI] [PMC free article] [PubMed] [Google Scholar]
- 36. WHO . Available at http://www.who.int/influenza/vaccines/virus/recommendations/201202_recommendation.pdf
- 37. CDC . Available at http://www.cdc.gov/flu/weekly/
- 38. Yamashita M. Laninamivir and its prodrug, CS‐8958: long‐acting neuraminidase inhibitors for the treatment of influenza. Antivir Chem Chemother 2010; 21:71–84. [DOI] [PubMed] [Google Scholar]
- 39. Tashiro M, McKimm‐Breschkin JL, Saito T et al Surveillance for neuraminidase‐inhibitor‐resistant influenza viruses in Japan, 1996–2007. Antivir Ther 2009; 14:751–761. [DOI] [PubMed] [Google Scholar]
- 40. Hurt AC, Barr IG, Hartel G, Hampson AW. Susceptibility of human influenza viruses from Australasia and South East Asia to the neuraminidase inhibitors zanamivir and oseltamivir. Antiviral Res 2004; 62:37–45. [DOI] [PubMed] [Google Scholar]
- 41. McKimm‐Breschkin J, Trivedi T, Hampson A et al Neuraminidase sequence analysis and susceptibilities of influenza virus clinical isolates to zanamivir and oseltamivir. Antimicrob Agents Chemother 2003; 47:2264–2272. [DOI] [PMC free article] [PubMed] [Google Scholar]
- 42. Hurt AC, Lee RT, Leang SK et al Increased detection in Australia and Singapore of a novel influenza A(H1N1)2009 variant with reduced oseltamivir and zanamivir sensitivity due to a S247N neuraminidase mutation. Euro Surveill 2011b; 16:pii–19884. [PubMed] [Google Scholar]
- 43. Rota PA, Hemphill ML, Whistler T, Regnery HL, Kendal AP. Antigenic and genetic characterization of the haemagglutinins of recent cocirculating strains of influenza B virus. J Gen Virol 1992; 73:2737–2742. [DOI] [PubMed] [Google Scholar]
- 44. Rota PA, Wallis TR, Harmon MW, Rota JS, Kendal AP, Nerome K. Cocirculation of two distinct evolutionary lineages of influenza type B virus since 1983. Virology 1990; 175:59–68. [DOI] [PubMed] [Google Scholar]
- 45. Xu X, Lindstrom SE, Shaw MW et al Reassortment and evolution of current human influenza A and B viruses. Virus Res 2004; 103:55–60. [DOI] [PubMed] [Google Scholar]
- 46. Higgins RR, Beniprashad M, Chong‐King E et al Recovery of influenza B Virus with the H273Y point mutation in the neuraminidase active site from a human patient. J Clin Microbiol 2012; 50:2500–2. [DOI] [PMC free article] [PubMed] [Google Scholar]
- 47. Tisdale M. Monitoring of viral susceptibility: new challenges with the development of influenza NA inhibitors. Rev Med Virol 2000; 10:45–55. [DOI] [PubMed] [Google Scholar]
- 48. Nguyen HT, Sheu TG, Mishin VP, Klimov AI, Gubareva LV. Assessment of pandemic and seasonal influenza A (H1N1) virus susceptibility to neuraminidase inhibitors in three enzyme activity inhibition assays. Antimicrob Agents Chemother 2010; 54:3671–3677. [DOI] [PMC free article] [PubMed] [Google Scholar]
- 49. Gubareva LV, Webster RG, Hayden FG. Detection of influenza virus resistance to neuraminidase inhibitors by an enzyme inhibition assay. Antiviral Res 2002; 53:47–61. [DOI] [PubMed] [Google Scholar]
Associated Data
This section collects any data citations, data availability statements, or supplementary materials included in this article.
Supplementary Materials
Figure S1. Box‐and‐whisker plots showing distribution of log‐transformed oseltamivir carboxylate IC50s for influenza A(H1N1)pdm09 (n = 326), influenza A(H3N2) (n = 407) and influenza B (n = 346).
Figure S2. Box‐and‐whisker plots showing distribution of log‐transformed zanamivir IC50s for influenza A(H1N1)pdm09 (n = 326), influenza A(H3N2) (n = 407) and influenza B (n = 346).
Figure S3. Box‐and‐whisker plots showing distribution of log‐transformed peramivir IC50s for influenza A(H1N1)pdm09 (n = 326), influenza A(H3N2) (n = 407) and influenza B (n = 346).
Figure S4. Box‐and‐whisker plots showing distribution of log‐transformed laninamivir IC50s for influenza A(H1N1)pdm09 (n = 326), influenza A(H3N2) (n = 407) and influenza B (n = 346).