Abstract
Please cite this paper as: Fox et al. (2012) Adjuvanted pandemic influenza vaccine: variation of emulsion components affects stability, antigen structure, and vaccine efficacy. Influenza and Other Respiratory Viruses DOI: 10.1111/irv.12031.
Abstract Background Adjuvant formulations are critical components of modern vaccines based on recombinant proteins, which are often poorly immunogenic without additional immune stimulants. Oil‐in‐water emulsions comprise an advanced class of vaccine adjuvants that are components of approved seasonal and pandemic influenza vaccines. However, few reports have been published that systematically evaluate the in vitro stability and in vivo adjuvant effects of different emulsion components.
Objectives To evaluate distinct classes of surfactants, oils, and excipients, for their effects on emulsion particle size stability, antigen structural interactions, and in vivo activity when formulated with a recombinant H5N1 antigen.
Methods Emulsions were manufactured by high pressure homogenization and characterized alone or in the presence of vaccine antigen by dynamic light scattering, zeta potential, viscosity, pH, hemolytic activity, electron microscopy, fluorescence spectroscopy, and SDS‐PAGE. In vivo vaccine activity in the murine model was characterized by measuring antibody titers, antibody‐secreting plasma cells, hemagglutination inhibition titers, and cytokine production.
Results We demonstrate that surfactant class and presence of additional excipients are not critical for biological activity, whereas oil structure is crucial. Moreover, we report that simplified two‐component emulsions appear more stable by particle size than more complex formulations.Finally, differences in antigen structural interactions with the various emulsions do not appear to correlate with in vivo activity.
Conclusions Oil‐in‐water emulsions can significantly enhance antibody and cellular immune responses to a pandemic influenza antigen. The dramatic differences in adjuvant activity between squalene‐based emulsion and medium chain triglyceride‐based emulsion are due principally to the biological activity of the oil composition rather than physical interactions of the antigen with the emulsion.
Keywords: Oil‐in‐water emulsion, pandemic influenza, vaccine adjuvant
Introduction
Metabolizable oil‐in‐water (o/w) emulsions have been widely used as effective vaccine adjuvants. While squalene appears to be the preferred metabolizable oil, 1 various emulsifier compositions exist in human and veterinary products. For example, MF59® employs polysorbate 80 (Tween® 80) and sorbitan trioleate (Span® 85), while AS03® utilizes only polysorbate 80. Other commonly used pharmaceutical emulsifiers include poloxamers (Pluronics®) and phospholipids. Emulsifier selection is based on emulsion stabilizing capacity and/or biological activity. Some surfactants, including polysorbate 80 and poloxamer 401, have been shown to induce apoptosis and necrosis, which in turn cause immunostimulation. 2
We recently demonstrated that substitution of squalene with other metabolizable oils such as long‐ or medium‐chain triglycerides (MCT) in o/w emulsions dramatically affects adjuvant activity when combined with an inactivated trivalent split‐virus influenza vaccine. 3 In contrast, substitution of egg phosphatidylcholine with different synthetic phosphatidylcholine emulsifiers in a squalene emulsion resulted in similar biological activity. 4 In the present work, we expand upon these findings to evaluate the effects on emulsion stability, antigen‐adjuvant compatibility, and biological activity of (i) different emulsifier classes (i.e. poloxamer versus polysorbate versus phosphatidylcholine), (ii) different oil classes (i.e. squalene versus MCT), and (iii) common excipients (i.e. glycerol, antioxidant, phosphate buffer), when formulated with a recombinant pandemic influenza vaccine.
Materials and methods
Adjuvant formulations
Shark liver squalene (≥98% purity) and sorbitan trioleate (Span® 85) were purchased from Sigma–Aldrich (St. Louis, MO, USA). Miglyol® 810, a MCT oil, was obtained courtesy of Sasol (Witten, Germany). DL‐α‐tocopherol, poloxamer 188 (Pluronic® F68), and glycerol were purchased from Spectrum Chemical (Gardena, CA, USA). Egg phosphatidylcholine (egg PC) was obtained from Avanti Polar Lipids, Inc. (Alabaster, AL, USA). Polysorbate 80 was obtained from NOF Corporation (Ultrapure HX; Tokyo, Japan) or J.T. Baker (Phillipsburg, NJ, USA). Buffer components were also obtained from J. T. Baker. All emulsion formulations were prepared by making separate aqueous and oil phases. Polysorbate 80, poloxamer 188, glycerol, and buffer components were dissolved in the aqueous phase with stirring, whereas sorbitan trioleate, egg phosphatidylcholine, and α‐tocopherol were dissolved in the oil phase with sonication and heating. Aqueous and oil phases were then mixed with a Silverson Heavy Duty Laboratory Mixer Emulsifier (3/4 in. tubular square hole high shear screen attachment; East Longmeadow, MA, USA) at ∼1000 g for 10 minutes (or 5 minutes in the case of EM022) to yield a crude emulsion. The crude emulsion was processed through a Microfluidics M110P (Newton, MA, USA) high‐pressure homogenizer for 12 passes at ∼207 MPa (∼30 000 psi), except in the case of EM022 (processed at 8500 psi for five passes). The recirculating product was cooled by a water bath near room temperature. Formulations were monitored for stability over 6 months at 5°C, ambient temperature, 37°C, and 60°C. Particle size, zeta potential, viscosity, and hemolysis assay measurements were performed as described previously. 3
Antigen‐adjuvant compatibility
Recombinant H5 A/Vietnam/1203/2004 (rH5) was purchased from Protein Sciences Corp (Meriden, CT, USA). Particle size measurement and gold‐stained PVDF membrane blots from SDS‐PAGE gels were performed on mixtures consisting of 2% v/v emulsion adjuvant (or 2·5% v/v in the case of EM022) and 0·1 mg/ml rH5 at 0, 4, or 24 hours after mixing antigen with adjuvant, with samples stored at ∼5°C or room temperature. The control sample contained saline instead of emulsion adjuvant. Three particle size measurements on one aliquot for each sample at each timepoint were collected. Twenty microliter samples were prepared for SDS‐PAGE by mixing with 20 μl of 4× reducing sample buffer and 40 μl 20% SDS.
Fluorescence spectroscopy
Fluorescence spectra on oil‐in‐water emulsions with and without rH5 at a concentration of 15·2 μg/ml were collected on a Horiba FluoroMax 3‐22 spectrometer. A fluorescence excitation of 280 nm and an emission range of 295–500 nm were selected to evaluate changes in secondary structural motifs in the presence of emulsions by exciting tryptophan and tyrosine residues. Due to a large amount of turbidity in the emulsion samples, a small volume (60 μl, 3 mm) quartz cuvette was selected to improve detection of protein by decreasing the fluorescence path‐length through turbid emulsions (permitting more light to pass through the sample). Further, a 1‐second integration time and a 5‐nm slit width on both excitation and emission beams were used. Only single scans of each sample were collected to mitigate effects of photo‐bleaching variability between samples; collected signal was concurrently divided by signal from a reference photodiode to reduce effects of source intensity variation on signal intensity between samples. Finally, spectra of emulsions without rH5 were subtracted from the spectra of the rH5‐containing emulsions to produce an estimation of the fluorescence contribution of the protein alone. Sample preparation consisted of diluting each emulsion to 2% oil in PBS pH 7·2 to mimic the in vivo immunization conditions; EM022 was also prepared at 2·5% oil. For rH5‐containing samples, protein was diluted into the above emulsion formulations as well as a PBS control to a final rH5 concentration of 15·2 μg/ml. This protein concentration is necessarily higher than the concentration used in the in vivo studies to yield fluorescence spectra with sufficient intensities to support reliable structural analysis. Spectral analysis was performed with GRAMS/AI (Galactic Software, Salem, NH, USA) spectral analysis suite with center of mass and maximum emission wavelengths calculated with baseline of zero.
Cryo‐electron microscopy
Cryo‐transmission electron microsopy (cryo‐TEM) was performed by NanoImaging Services (La Jolla, CA, USA). Samples were prepared at IDRI by mixing 50 μl of antigen stock concentration (0·5–0·75 mg/ml HA) with 200 μl emulsion stock concentration (10% v/v oil for EM016 and EM057 and 5% v/v oil for EM022) and sent to NanoImaging Services, after which they were imaged within 1 week of arrival. Samples were preserved in vitrified ice supported by holey carbon films on 400‐mesh copper grids. Three microliters of sample suspension was dropped on a clean grid, blotted away with filter paper, then immediately vitrified in liquid ethane, and stored under liquid nitrogen until transferred to the FEI Tecnai T12 electron microscope for imaging. Images were taken at 120 keV beam energy on an FEI Eagle 4 × 4 k CCD camera. Vitreous ice grids were transferred into the electron microscope with a cryostage operating below −170°C, with images acquired at multiple scales to assess the overall distribution of the specimen. Once suitable target areas were identified at lower magnification, additional images were taken at 21 000×, 52 000× and 110 000× at a nominal underfocus of −1·5 μm (110 k), −3 μm (52 k), and −5 μm (21 k) at electron doses of ∼10–25 e/Å2.
Animals
Female C57BL/6 mice 6–7 weeks were purchased from Charles River Laboratories (Wilmington, MA, USA) and were housed and maintained under specific pathogen‐free conditions at the Infectious Disease Research Institute. All procedures were performed in accordance with the regulations and guidelines of the IDRI animal care and use committee. Mice were immunized intramuscularly two times, 4 weeks apart. Recombinant H5 A/Vietnam/1203/2004 was purchased from Protein Sciences Corporation and was used at either 1, 0·1, or 0·01 μg for the immunizations and was either mixed with saline or with various oil‐in‐water emulsions as indicated. Blood/sera were collected at day 0, and 4 weeks after the prime and boost immunizations. Spleens and bone marrow were harvested for immunogenicity studies either 1 or 4 weeks following the boost immunization as described.
Antibody responses
Sera were analyzed for antigen‐specific IgG, IgG1, IgG2c antibodies by antibody capture ELISA. Polysorp ELISA plates (Nunc‐immuno polysorp 96‐well plates were coated with rH5 Vietnam protein at a concentration of 1·0 μg/ml in 0·1 m bicarbonate coating buffer at 100 μl per well. Plates were allowed to incubate overnight at 4°C. Contents of plates were then removed. Plates were blocked with a PBS‐tween 0·5%, 1% BSA (Albumin from Bovine Serum Powder Sigma A9418‐100G) solution for 2 hours at room temperature at 200 μl per well. Plates were washed five times in PBS‐tween 0·1% and one time in PBS 1×, followed by patting them dry on absorbent cloths. Columns two through 12 of each plate received 100 μl per well of a PBS‐tween 0·5%, 0·1% BSA solution. Column one received 112·5 μl per well of the PBS‐tween 0·5%, 0·1% BSA solution. Next, 12·5 μl of each sample was then added to the first column. The samples were then serial diluted (1:5 dilutions) across the plate. The plates were incubated at room temperature for 2 hours. Plates were washed five times in PBS‐tween 0·1% and one time in PBS 1×, followed by drying on absorbent cloths. IgG1‐horseradish peroxidase (HRP) and IgG2c‐HRP was then added at a 1:2000 dilution at 100 μl per well with the PBS‐tween 0·5%, 0·1%BSA solution as the diluent. IgG‐HRP was added at a 1:4000 dilution at 100 μl per well with the PBS‐tween 0·5%, 0·1% BSA solution as the diluent. Plates were incubated at room temperature for 1 hour. Plates were washed five times in PBS‐tween 0·1% and one time in PBS 1×, followed by drying on absorbent cloths. SureBlue TMB substrate solution was added to the plates at 100 μl per well for 1 minute 50 seconds. The reaction was then stopped with 50 μl per well of H2S04. Plates were then read on a plate reader at 450–570 nm. Endpoint titer was determined using Prism (GraphPad Software, La Jolla, CA, USA) following a sigmoidal fit (variable slope) of the values determined at dilution, with the endpoint titer corresponding to a cutoff value (C) determined as described previously 5 with C = X + SDf, where X is the average and SD is the standard deviation of the negative sera control plate, and f is the multiplier at the 99·9% confidence level. A cutoff value of 0·1 OD was assigned if the cutoff value as determined above was <0·1 OD. On rare occasions, individual plate wells registered an abnormally high reading near the highest dilutions. These were excluded from the sigmoidal fit by employing the Grubb’s test on the suspect value, comparing to the four dilutions surrounding the dilution in question at the 99·9% confidence level. 6
Hemagglutination inhibition (HI) antibody responses
HI titers were performed by either Midwest Research Institute (Kansas City, MO, USA) or Tria Bioscience Corp. (Seattle, WA, USA) using horse erythrocytes. Briefly, sera were collected from mice 4 weeks after each immunization (Day 28 and Day 56). HI antibodies were tested against either the vaccine strain (A/Vietnam/1203/04‐Clade 1) or against heterologous H5N1 strains (A/Vietnam/1194/2004‐Clade 1, A/Cambodia/R0405050/2007‐Clade 1, A/Chicken/Korea/IS/06‐Clade 2·2, A/Turkey/turkey/1/2005‐Clade 2·2, or A/Anhui/1/2005‐Clade 2·3·4). The HI titer was defined as the reciprocal of the highest dilution of sera, which completely inhibits the agglutination of the RBCs. Pre‐immune titers in all mice were ≤10.
Enumeration of long‐lived antibody‐secreting plasma cells
A bone marrow ELISPOT was used to determine the induction of vaccine‐specific long‐lived antibody‐secreting plasma cells (ASPC) following immunization with rH5 from A/Vietnam/1203/04 (Protein Sciences Corp.) with and without adjuvant. ELISPOT plates (Millipore) were prepared 1 day in advance. Plates were pre‐wetted with 15 μl of 35% EtOH for <30 seconds. The plates were washed with 200 μl of PBS three times and coated with 100 μl of rH5 Vietnam at 10 μg/ml in 0·1 m bicarbonate coating buffer. The plates were incubated overnight at 4°C. Plates were washed three times with 200 μl of PBS‐Tween (0·5%). The plates were blocked with 200 μl of cRPMI and allowed to incubate at RT for 2 hours. The plates were then washed three times with 200 μl of PBS‐Tween (0·5%). Three weeks after the second immunization, femurs were collected, bone marrow extracted, and single cell suspensions prepared and placed on ice. The bone marrow cells were added to rows A and E at 150 μl per well with a concentration of 10 × 106 cells/ml. One‐hundred microliters of cRPMI was added to rows B, C, D, F, G, and H. Next, 50 μl of cells was removed from row A and serial diluted through row D and 50 μl of cells was removed from row E and serial diluted through row H. The last 50 μl was discarded. The plates were then incubated for 3–5 hours at 37°C. The plates were washed three times with PBS‐Tween (0·5%). Anti‐mouse Total IgG‐HRP was diluted 1:1000 in filtered PBS‐Tween (0·5%) with 5% FBS. Diluted antibody at 100 μl per well was added to the plates and incubated at 4°C overnight. Plates were washed four times with PBS‐Tween (0·5%) and once with PBS. The AEC developer was prepared immediately prior to adding 100 μl of the developing solution to each well. The plates were allowed to develop for 30 minutes, and the reaction was stopped by rinsing the plates with distilled water. The plates were air dried and counted by an ELISPOT plate reader (C.T.L. Serie3A Analyzer; Cellular Technology Ltd., Cleveland, OH, USA), and the data were analyzed using Immunospot® software (CTL Analyzer LLC).
Cytokine ELISPOTs
IL‐5 (and IFN‐γ) ELISPOT kits purchased from eBioscience were used to measure intracellular cytokine responses to rH5 A/Vietnam/1203/04. To perform this assay, the capture antibody was diluted in sterile ELISPOT Coating Buffer. The ELISPOT plates (Millipore) were pre‐wetted with 15 μl of 35% EtOH. Plates were washed twice with sterile ELISPOT coating buffer. Plates were then coated with 100 μl/well of capture antibody solution and were incubated at 4°C overnight. After incubation, the coating antibody was aspirated from the plate and washed two times with 200 μl/well with sterile ELISPOT Coating Buffer. The ELISPOT Coating buffer was then aspirated from the wells, and the plates were blocked with 200 μl/well with complete RPMI‐1640 at RT for 1 hour. The stimulants were then diluted to the proper concentrations and added to the plate at 100 μl/well. The splenocytes were added to the plates at 2 × 10⁶ cells/ml at 100 μl/well (for a total of 2 × 10⁵ cells/well). The plates were incubated at 37°C for 48 hours. After incubation, the cells and stimulants were aspirated from the plates, and the plates were washed three times with ELISPOT Wash Buffer. The biotinylated detection antibody was then diluted in Assay Diluent and added to the plate at 100 μl/well. The plates were incubated for 2 hours at RT. The plates were aspirated of the detection antibody solution and washed four times with ELISPOT Wash Buffer. The Avidin‐horseradish peroxidase reagent was diluted in Assay Diluent and added to the plates at 100 μl/well and incubated for 45 minutes at RT. The AV‐HRP solution was then aspirated from the wells, and the plates were washed three times with ELISPOT Wash Buffer and then two times with 1 × PBS. Next, 100 μl/well of freshly prepared AEC substrate solution was added to the plates and developed at RT for 30 minutes. The substrate reaction was stopped by washing the wells three times with distilled water. The plates were air dried and counted by an ELISPOT plate reader (C.T.L. Serie3A Analyzer; Cellular Technology Ltd), and the data were analyzed using Immunospot® software (CTL Analyzer LLC).
Statistical analysis
anova with Tukey’s multiple comparison test was performed using PRISM software.
Results
Emulsion characterization and stability
Table 1 displays chemical structures representative of the oils, emulsifiers, and excipients employed in this study. Squalene, a linear triterpene, clearly differs in structure from Miglyol® 810, an MCT‐based oil. Likewise, each of the emulsifiers represents different classes of structures. However, all components listed in Table 1 are already used in commercially available oral or injectable pharmaceutical products. 7 , 8 , Table 2 defines the composition of each emulsion manufactured along with physical properties. The first three emulsions (EM057, EM016, EM074) provide a sample set that directly compares different classes of emulsifiers with squalene. EM074 and EM059 allow comparison of two different oils with the same emulsifier. EM058, EM030, and EM001 are similar to EM074 but with various excipient additions. Both EM030 and EM001 are referred to as SE (stable emulsion) in earlier publications. 9 , 10 Finally, EM022 provides a comparator for all emulsions, with composition based on the commercially available adjuvant MF59®. It is apparent from Table 2 that all emulsions are hemocompatible, with negative zeta potentials, low viscosity values, and neutral or slightly acidic pH values. Note that immediately prior to immunization, the formulations were mixed with phosphate buffered saline and antigen, which brought pH values within the range of 6·3–7·2 for all formulations (data not shown).
Table 1.
Emulsion component structures
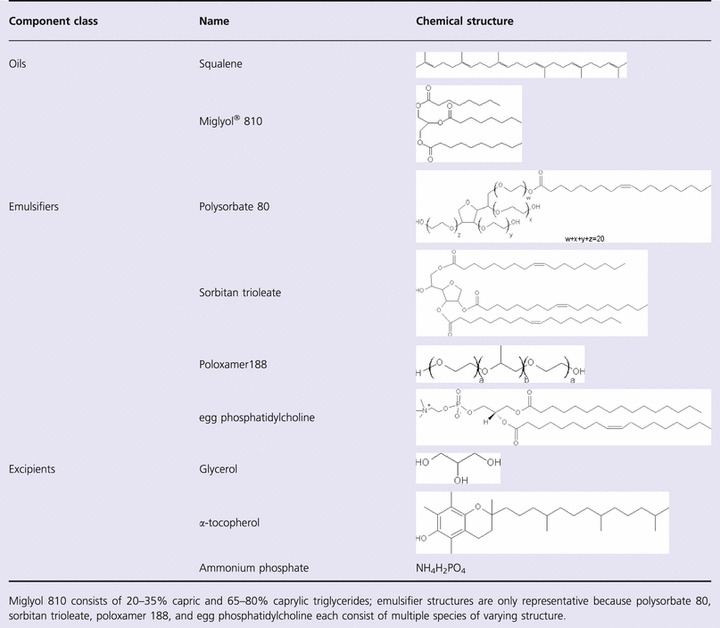
Table 2.
Emulsion composition and physical characterization
| Emulsion | Oil (% v/v) | Surfactant (% w/v) | Excipients | Dilution for injection | Hemolysis (%) | Zeta potential (mV) | Dynamic viscosity (cP) | pH |
|---|---|---|---|---|---|---|---|---|
| EM057 | Squalene (10) | P188 (1·9) | – | 5× | 0·1 | −5·5 | 1·9 | 7·6 |
| EM016 | Squalene (10) | P80 (1·9) | – | 5× | 0·1 | −12·6 | 1·5 | 6·2 |
| EM074 | Squalene (10) | eggPC (1·9) | – | 5× | 0·1 | −15·1 | 1·5 | 7·1 |
| EM059 | MCT (10) | eggPC (1·9) | – | 5× | 0·4 | −25·7 | 1·6 | 4·2 |
| EM058 | Squalene (10) | eggPC/P188 (1·9/0·1) | Phosphate buffer | 5× | 0·6 | −6·3 | 1·6 | 5·5 |
| EM030 | Squalene (10) | eggPC/P188 (1·9/0·1) | Phosphate buffer, glycerol | 5× | 0·1 | −4·5 | 1·6 | 5·6 |
| EM001 | Squalene (10) | eggPC/P188 (1·9/0·1) | Phosphate buffer, glycerol, α‐toc | 5× | 0·0 | −7·0 | NM | 5·6 |
| EM022* | Squalene (5) | P80/S85 (0·5/0·5) | Citrate buffer | 2× | 0·1 | −22·3 | 1·2 | 6·1 |
Hemolysis measured near date of manufacture; zeta potential, viscosity, and pH measured ∼3 months post‐manufacture. To more closely mimic MF59®, EM022 was manufactured at 5%25v/v oil, whereas all other emulsions were manufactured at 10% v/v oil (corresponding physical measurements could be affected by the lower oil content in EM022, e.g. viscosity).
MCT, medium‐chain triglyceride; eggPC, egg phosphatidylcholine; P80, polysorbate 80; P188, poloxamer 188; S85, sorbitan trioleate; α‐toc, α‐tocopherol; NM, not measured.
Particle size stability at various temperatures for each emulsion was measured over a 3‐month period (Figure 1A–D). Particle size instability is arbitrarily defined as >50% growth from initial size. Visual instability is defined as any deviation from a homogeneous milky‐white formulation. Average values and standard deviations from two lots of each emulsion are plotted. Initial particle sizes for all emulsions are between 75 and 200 nm. At refrigerated temperatures, very little size growth is apparent in any of the emulsions. However, at elevated temperatures, many of the emulsions fail size or visual stability parameters. It is striking that EM016 and EM057 remain stable visually and by particle size at all temperatures.
Figure 1.
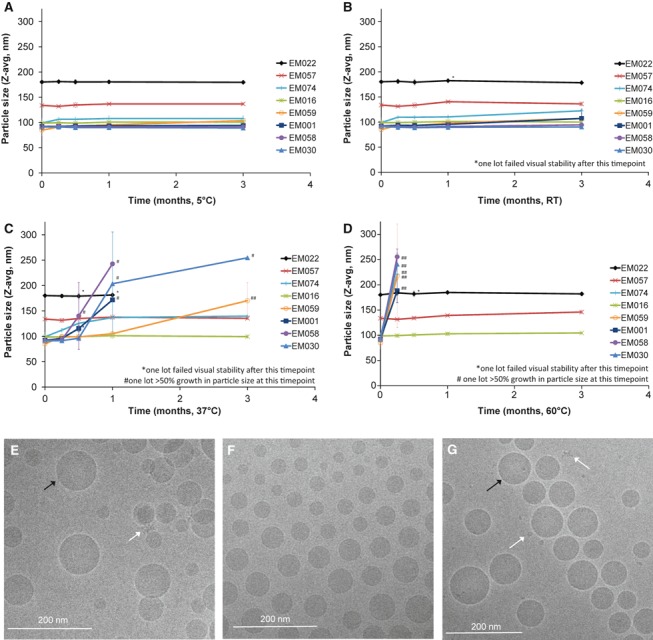
Emulsion particle size and cryo‐TEM characterization. Particle size as measured by dynamic light scattering of various emulsions stored at (A) 5°C, (B) RT, (C) 37°C, or (D) 60°C. Cryo‐TEM images of antigen‐adjuvant mixtures elucidate formulation spherical nanoparticle morphology of representative emulsions (E) rH5 + EM022, (F) rH5 + EM057, (G) rH5 + EM016. Oil droplets are indicated by black arrow; white arrows point to smaller particles indicative of protein.
To visualize formulation morphology, vaccines containing rH5 and representative emulsions EM022, EM057, or EM016 were imaged by cryo‐transmission electron microscopy (cryo‐TEM, Figure 1E–G). Images of the emulsion formulations appeared similar for each emulsion, consisting of spherical particles ∼25–150 nm in diameter with the EM022 size slightly larger than the other emulsions, confirming dynamic light scattering measurements. Smaller particles indicative of protein were visible in some images, but whether there was any preferential association of the antigen with the emulsion droplets was inconclusive.
Emulsion–antigen interactions
Emulsions were mixed with a recombinant influenza antigen (rH5) and monitored by particle size immediately after mixing, 4 hours post‐mixing, and 24 hours post‐mixing, with vaccines stored at two different temperatures. Essentially no change in particle size was evident for any of the formulations (Figure S1). Likewise, SDS‐PAGE analysis (followed by PVDF membrane blot and gold stain) revealed similar antigen structural patterns compared with antigen without adjuvant at the same timepoints as above (Figure S2). Together these assays indicated that no detectable gross degradation of antigen or adjuvant formulation occurred for up to 24 hours after mixing. However, there are notable differences in the intrinsic fluorescence of tryptophan residues within the natively folded protein in phosphate buffered saline and in the oil‐in‐water emulsions as shown in Figure 2. The rH5 tryptophan residues are localized probes of the unique chemical microenvironment created by a combination of the protein fold and interacting molecules from the pool of excipients. In general, when a protein denatures (exposing fluorescent aromatic residues to water) its emission maxima redshifts and the intensity decreases, while folding to form hydrophobic pockets and aggregated states result in blueshifts and higher intensities. 11 A range of behavior is demonstrated in Figure 2, with the presence of emulsion generally causing a reduced energy (higher wavelength) emission from rH5, as can be seen by the red (positive) shift in center of mass and emission maximum. Interestingly, rH5 in EM001 produced a negative spectral result after subtraction of fluorescence from EM001 without rH5. This may be due to interference from the intrinsic fluorescence of α‐tocopherol, 11 an excipient which is not present in any of the other emulsions.
Figure 2.
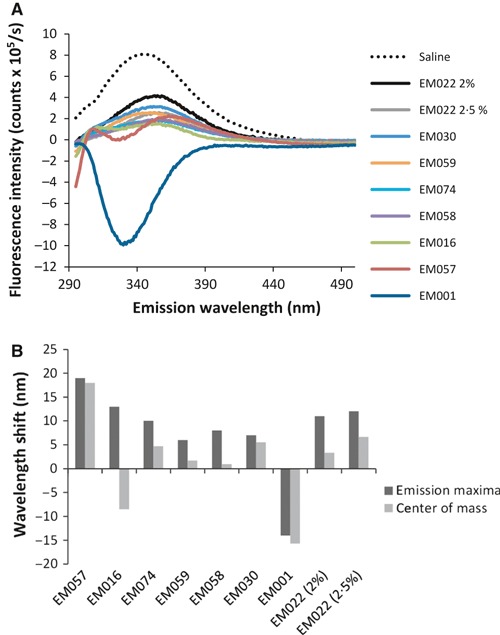
Antigen‐adjuvant compatibility evaluation by intrinsic fluorescence spectroscopy. (A) Intrinsic fluorescence emission of rH5 antigen in oil‐in‐water emulsions. From the spectra in (a), intensity maxima and center of mass are determined (B). Shifts in emission maxima and fluorescence emission band center of mass correlate to changes in antigen structure or chemical microenvironment.
Emulsion effects on biological activity
Antibody endpoint titers measured after the prime immunization revealed that all vaccines containing emulsions except EM059 induced higher IgG1 and IgG2c antibodies than the antigen alone (Figure 3A). In contrast, the vaccine containing EM059 induced equivalent or even lower antibodies than antigen without adjuvant. This pattern was evident after the boost immunization as well (Figure 3B). Higher numbers of long‐lived ASPC in the bone marrow were detected for all emulsions, except EM059 and EM074, compared with antigen alone (Figure 3C). The mean of the IgG1 antibody titers are generally higher than the IgG2c antibodies, indicating a Th2‐type immune response induced by the squalene‐based emulsion adjuvants. Hemagglutination inhibition (HI) titers against the vaccine strain (A/Vietnam/1203/04) after a prime were evident only in mice immunized with rH5 plus EM057 and EM030 (Figure 4A). However, HI titers mirrored the antibody endpoint titer and bone marrow ELISPOT results 4 weeks after a boost immunization, with all adjuvanted groups (except EM059) producing higher HI titers against the homologous Vietnam strain compared with antigen without adjuvant (Figure 4B). A similar pattern was observed for cross‐reactive HI titers against the heterologous A/Chicken/Korea strain.
Figure 3.
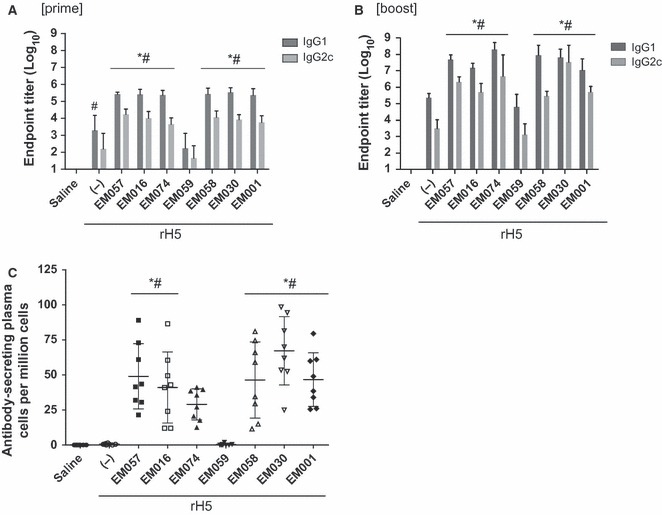
Antibody responses to rH5 vaccines containing various emulsions as measured after prime and boost immunizations. For simplicity, not all significant differences between groups are displayed on the graphs; those not indicated on the graphs are described below. (A) Post‐prime IgG1 and IgG2c antibody endpoint titers. (B) Post‐boost IgG1 and IgG2c antibody endpoint titers. Statistical differences between groups not indicated on the graph are as follows (P < 0·05): (IgG1) EM001 versus EM030, EM058, and EM074; EM016 versus EM058 and EM074; (IgG2) EM030 versus EM001, EM057, EM016, and EM058; EM074 versus EM058. (C) Long‐lived antibody‐secreting cells in the bone marrow detected post‐boost. Statistical differences between groups not indicated on the graph are as follows (P < 0·05): EM030 versus EM074. Error bars represent standard deviation of the mean.
Figure 4.
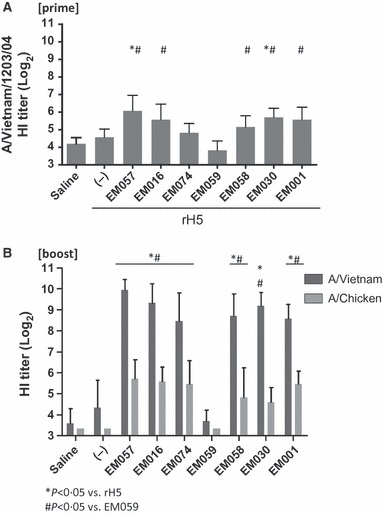
HI titers against homologous and heterologous vaccine strains. (A) Post‐prime HI titer against vaccine strain. (B) Post‐boost HI titers against homologous and heterologous strains. Error bars represent standard deviation of the mean.
Cellular immune responses were investigated by ELISPOT (IL‐5, IFN‐γ). Higher numbers of IL‐5 producing cells were evident by ELISPOT in all emulsion‐containing vaccines, except EM059, compared with antigen without adjuvant 1 week after the boost immunization, whereas 4 weeks after the boost injection only EM001, EM030, and EM058 were significantly different from the antigen without adjuvant (Figure 5), although all adjuvanted groups were still higher than EM059. Levels of IFN‐γ producing cells (after prime or boost) were not different between the adjuvanted groups and the antigen without adjuvant, with the exception of EM016 after prime due to one high responding animal (data not shown). Multiplex cytokine bead array assays using Luminex® were performed to detect IL‐2, IL‐5, IL‐10, IL‐13, IL‐17, IFN‐γ, and TNF‐α responses (Figure S3). Overall, the cytokine panel results showed some antigen‐specific induction of IL‐2, IL‐5, IL‐13, and TNF‐α production in the adjuvanted groups (except EM059). Thus, the cytokine data confirm the indication from the antibody data that the squalene‐based emulsions elicit a Th2‐type response, with the dramatic exception of EM059, which was essentially indistinguishable from the negative saline control in all cytokines measured. Indeed, the most striking finding in both the antibody and cellular results is the absence of biological activity in the EM059 group.
Figure 5.
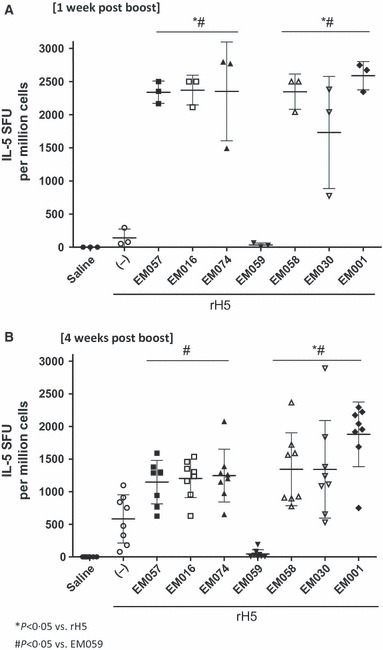
Antigen‐specific IL‐5 producing cells detected (A) 1 or (B) 4 weeks after boost immunization. Statistical differences between groups not indicated on the graph are as follows (P < 0·05): (4 weeks post‐boost) EM001 versus EM057. Error bars represent standard deviation of the mean.
Following the results from the physical stability and initial in vivo adjuvant screen, EM057, EM016, and EM030 were selected for further biological evaluation, including dose‐sparing capacity. In this experiment, the emulsions above were compared with EM022, an MF59®‐like emulsion. Three doses of the rH5 (1, 0·1 and 0·01 μg) were tested, and the two lower concentrations (0·1 and 0·01 μg) were tested with the emulsions. Significant levels of antigen‐specific IgG1 and IgG2c antibodies were observed with all doses of rH5 with any of the adjuvanted groups compared to rH5 without adjuvant after both a prime and boost (Figure S4). Likewise, long‐lived antigen‐specific plasma cells were observed with all of the emulsions combined with 0·1 μg rH5, and all but EM016 when combined with 0·01 μg rH5, compared with any dose of rH5 alone. All of the emulsions induced significant HI titers against the vaccine strain after the boost (Figure 6). The same pattern was observed for cross‐reactive HI titers against all of the H5 influenza strains tested, with the exception of the HI titers against the A/Turkey/turkey strain with the lowest dose of rH5, where only the EM057 group induced higher responses than any dose of rH5 alone. Therefore, the above antibody assays indicate that the emulsions are similar in their biological activity. Perhaps most surprisingly, the above results indicated an unexpected reverse dose response in the antigen alone groups; in other words, the lowest dose of rH5 (0·01 μg) without adjuvant induced higher antibodies and HI titers (i.e. Cambodia strain) compared with the 1‐μg rH5 dose without adjuvant. No differences between adjuvanted groups compared with antigen alone were apparent in the number of IFN‐γ‐producing cells induced; however, adjuvanted vaccines overall showed boosted numbers of IL‐5‐producing cells compared with antigen without adjuvant (Figure S5). Overall, results from this second experiment confirm the previous experimental results, showing good adjuvant activity from each squalene‐based emulsion and little difference between adjuvanted groups.
Figure 6.
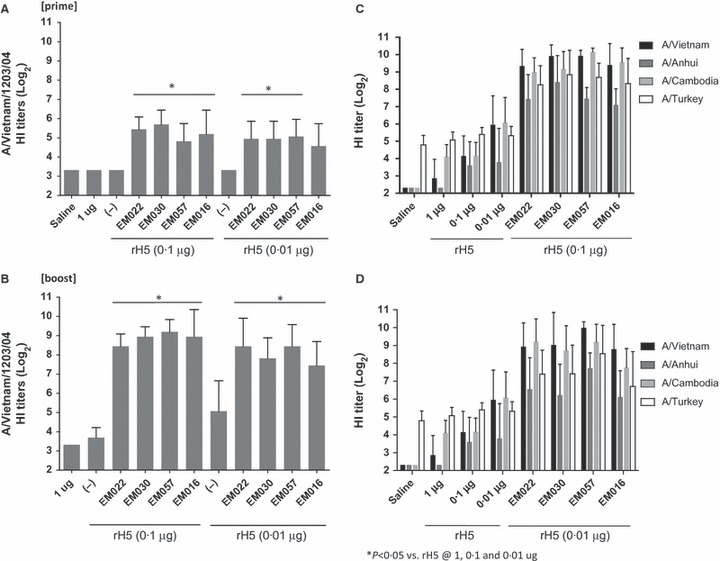
HI titers against the homologous vaccine strain (A) post‐prime and (B) post‐boost; and HI titers (post‐boost) against heterologous vaccine strains after immunization with rH5 vaccines at (C) 0·1 μg of rH5 with emulsions or (D) 0·01 μg of rH5 with emulsions. Error bars represent standard deviation of the mean. All emulsion‐containing vaccines induced significantly higher HI titers compared with antigen alone at any dose for each pathogen strain with the exception of the HI titers against the A/Turkey/turkey with the lowest dose of rH5, where only the EM057 group induced higher responses than any dose of rH5 alone.
Discussion
Oil‐in‐water emulsion adjuvants with influenza antigens have effectively increased breadth of immunity and decreased required antigen doses. To fully realize the potential of these adjuvants in a variety of settings, stability and alternative components that may be less costly or more readily available are important considerations. Storage of the emulsions at elevated temperatures while monitoring particle size over time provides a necessary accelerated stability tool that allows differences in stability to be detected more rapidly. It has been reported in the literature that cosurfactants tend to make emulsions more stable due to tighter interfacial packing; 12 therefore, it is unexpected that the most stable emulsions were found to be EM057 and EM016, both of which include only one surfactant. This particle size stability even at high temperatures is a promising result, especially for developing country applications, where local conditions may not allow for storage temperatures to be well controlled.
While protein structural changes in the presence of various emulsions as measured by intrinsic fluorescence are apparent, these differences do not appear to correlate to immunological activity. Thus, the dramatic difference in biological activity of the vaccine containing EM059 can be attributed to the immunogenicity effects of the oil component (substitution of squalene with the triglyceride oil) rather than any protein structural perturbations.
Despite the dramatically different structures among the various surfactants studied here, their biological activity in both antibody and cellular readouts appeared similar as long as the emulsion was squalene based, which confirms results of a related study where emulsions employing different Tween and Span emulsifiers (but not phospholipids) elicited similar antigen‐specific antibody responses, although T‐cell responses were not investigated. 13 In contrast, substitution of squalene with a MCT oil caused a dramatic loss in biological activity in virtually all assays conducted. This finding correlates well with related work where squalene was found to induce more adjuvant activity compared with multiple other biocompatible oils when formulated with a recombinant malaria antigen or a split‐inactivated influenza vaccine. 3 The mechanisms responsible for the enhanced adjuvant activity of squalene emulsions are not clear. It is possible that triglycerides are more rapidly biodegraded compared with squalene. For instance, following intravenous administration of an emulsion containing various oils, squalene was found to have a ∼4‐fold longer half‐life compared with triglycerides. 14 Moreover, intravenous injection of MCTs compared with long‐chain triglycerides (LCTs) as nutritional supplement emulsions showed that MCTs were metabolized and cleared from plasma faster than LCTs, which may be due to increased solubility and/or susceptibility to enzymatic hydrolysis of MCTs. 15 , 16 , 17 Likewise, squalene solubility is predicted to be lower than triglycerides of caprylic acid, the main fatty acid constituent of Miglyol 810. 18 , 19 Other studies indicate that the in vivo stability of an oil may be related to adjuvant activity. For example, intramuscular immunization of chickens with emulsions (water‐in‐oil or oil‐in‐water) based on MCTs compared with mineral oil showed that the mineral oil inoculum was present longer at the injection site compared with the MCT emulsion, and the mineral oil emulsion induced higher antibody titers. 20 , 21 In the present work, squalene appears to be critical for optimal adjuvant activity, whereas choice of surfactant in the squalene emulsions is not as crucial.
Additional common excipients such as a phosphate buffer, an isotonic agent, and an antioxidant had little or no effect on in vivo immune responses, although they may have slightly decreased particle size stability at elevated temperature (compare EM074 with EM001, EM058, and EM030 at 37°C in Figure 1). The excipient α‐tocopherol, an antioxidant, is of special interest due to its inclusion as a main component in AS03®, the adjuvant formulation in the H1N1 vaccine Pandemrix®. Recent work has highlighted the unique biological activity of the α‐tocopherol‐containing emulsion, inducing higher antibodies and a different cytokine profile compared with a squalene emulsion. 22 However, the α‐tocopherol content in AS03 is >100‐fold higher than that used in this study, where it is intended as an antioxidant, although it is interesting to note that post‐boost IgG1 and IgG2c levels were significantly lower (P value < 0·05) in the group containing α‐tocopherol (EM001) compared with the same formulation without α‐tocopherol (EM030). The effects of emulsion components on stability and biological activity are summarized qualitatively in Table 3.
Table 3.
Stability and biological activity effects of emulsion components
| Component | Structural classes evaluated | Effect on emulsion stability | Effect on vaccine adjuvant activity |
|---|---|---|---|
| Oil | Triterpene | − | ++ |
| Triglyceride | |||
| Emulsifier | Polysorbate | ++ | − |
| Poloxamer | |||
| Phospholipid | |||
| Excipients | Buffer | + | − |
| Isotonic agent | |||
| Antioxidant |
Qualitative rating of the component effects on stability or biological activity: large effect (++), some effect (+), little or no effect (−).
Another interesting question is how different antigen structures may be affected by adjuvant formulations such as emulsions. For instance, virus‐like particle antigens may interact with adjuvant formulations in very different ways compared with recombinant subunit proteins. Work along these lines is ongoing in our laboratory. Such work should take into account emulsion composition as well as interactions with the antigen as measured by analytical methods such as fluorescence spectroscopy and electron microscopy.
Supporting information
Data S1. This supplementary information contains particle size and SDS‐PAGE analysis from the various antigen‐adjuvant mixtures. In addition, this supplementary information contains data obtained from multiplex cytokine bead array as well as additional data regarding antibody endpoint titers, antibody‐secreting plasma cells, and IL‐5 cytokine production.
Figure S1. Particle size of antigen‐adjuvant mixtures at 0, 4, or 24 hours after mixing and storage at 5 °C or room temperature.
Figure S2. Gold‐stained blots of SDS‐PAGE of antigen‐adjuvant mixtures at 0, 4, or 24 hours after mixing and storage at 5 °C or room temperature.
Figure S3. Antigen‐specific cytokine levels determined from multiplex cytokine bead assay using rH5‐stimulated splenocyte supernatants.
Figure S4. Antibody responses to rH5 vaccines at different doses of rH5 with various emulsions as measured after prime and boost immunizations.
Figure S5. Antigen‐specific IL‐5 producing cells detected 4 weeks after boost immunization with rH5 vaccines at different doses of rH5 with various emulsions.
Supporting info item
Acknowledgements
The authors thank Alison Bernard, Susan Lin, Tim Dutill, Sandra Sivananthan, Traci Mikasa, Kristen Forseth, Tony Phan, and Quinton Dowling for excellent technical assistance, and NanoImaging Services for the cryoTEM images. We gratefully acknowledge Drs. Kathy Neuzil and Vadim Tsvetnitsky from PATH for helpful discussions. Support for this work was provided by PATH.
References
- 1. Fox CB. Squalene emulsions for parenteral vaccine and drug delivery. Molecules 2009; 14:3286–312. [DOI] [PMC free article] [PubMed] [Google Scholar]
- 2. Yang YW, Wu CA, Morrow WJW. Cell death induced by vaccine adjuvants containing surfactants. Vaccine 2004; 22:1524–36. [DOI] [PubMed] [Google Scholar]
- 3. Fox CB, Baldwin SL, Duthie MS, Reed SG, Vedvick TS. Immunomodulatory and physical effects of oil composition in vaccine adjuvant emulsions. Vaccine 2011; 29:9563–72. [DOI] [PMC free article] [PubMed] [Google Scholar]
- 4. Fox CB, Baldwin SL, Duthie MS, Reed SG, Vedvick TS. Immunomodulatory and physical effects of phospholipid composition in vaccine adjuvant emulsions. AAPS Pharm Sci Tech 2012; 13:498–506. [DOI] [PMC free article] [PubMed] [Google Scholar]
- 5. Frey A, Di Canzio J, Zurakowski D. A statistically defined endpoint titer determination method for immunoassays. J Immunol Methods 1998; 221:35–41. [DOI] [PubMed] [Google Scholar]
- 6. Hibbert DB, Gooding JJ. Data Analysis for Chemistry. New York: Oxford University Press, 2006. [Google Scholar]
- 7. Strickley RG. Solubilizing excipients in oral and injectable formulations. Pharm Res 2004; 21:201–30. [DOI] [PubMed] [Google Scholar]
- 8. U.S. Food and Drug Administration . Inactive Ingredient Search for Approved Drug Products [database on the Internet]. U.S. Food and Drug Administration; Available at http://www.accessdata.fda.gov/scripts/cder/iig/index.cfm (Accessed August 8, 2012). [Google Scholar]
- 9. Baldwin SL, Shaverdian N, Goto Y et al. Enhanced humoral and Type 1 cellular immune responses with Fluzone adjuvanted with a synthetic TLR4 agonist formulated in an emulsion. Vaccine 2009; 27:5956–63. [DOI] [PubMed] [Google Scholar]
- 10. Lousada‐Dietrich S, Jogdand PS, Jepsen S et al. A synthetic TLR4 agonist formulated in an emulsion enhances humoral and Type 1 cellular immune responses against GMZ2 ‐ a GLURP‐MSP3 fusion protein malaria vaccine candidate. Vaccine 2011; 29:3284–92. [DOI] [PubMed] [Google Scholar]
- 11. Massey JB, Pownall HJ. Interaction of α‐tocopherol with model human high‐density lipoproteins. Biophys J 1998; 75:2923–31. [DOI] [PMC free article] [PubMed] [Google Scholar]
- 12. Fox CB, Anderson RC, Dutill TS, Goto Y, Reed SG, Vedvick T. Monitoring the effects of component structure and source and formulation stability and adjuvant activity of oil‐in‐water emulsions. Coll Surf B: Bioint 2008; 65:98–105. [DOI] [PubMed] [Google Scholar]
- 13. Yang YW, Wei AC, Shen SS. The immunogenicity‐enhancing effect of emulsion vaccine adjuvants is independent of the dispersion type and antigen release rate‐‐a revisit of the role of the hydrophile‐lipophile balance (HLB) value. Vaccine 2005; 23:2665–75. [DOI] [PubMed] [Google Scholar]
- 14. Relas H, Gylling H, Miettinen TA. Fate of intravenously administered squalene and plant sterols in human subjects. J Lipid Res 2001; 42:988–94. [PubMed] [Google Scholar]
- 15. Ball MJ. Hematological and biochemical effects of parenteral nutrition with medium chain triglycerides: comparison with long‐chain triglycerides. Am J Clin Nutr 1991; 53:916–22. [DOI] [PubMed] [Google Scholar]
- 16. Rossi J, Leroux JC. Principles in the development of intravenous lipid emulsions; in Wasan KM. (ed.): Role of Lipid Excipients in Modifying Oral and Parenteral Drug Delivery. Hoboken, NJ: John Wiley & Sons Inc., 2006; 88–123. [Google Scholar]
- 17. Yeh SL, Chao CY, Lin MT, Chen WJ. Effects of parenteral infusion with medium‐chain triglycerides and safflower oil emulsions on hepatic lipids, plasma amino acids and inflammatory mediators in septic rats. Clin Nutr 2000; 19:115–20. [DOI] [PubMed] [Google Scholar]
- 18. Sasol . Miglyol Product Information. Available at http://www.sasoltechdata.com/tds/miglyols.pdf (Accessed 17 December 2007).
- 19. Available at http://www.chemspider.com (Accessed 8 August 2012).
- 20. Jansen T, Hofmans MPM, Theelen MJG, Manders F, Schijns VEJC. Structure‐ and oil type‐based efficacy of emulsion adjuvants. Vaccine 2006; 24:5400–5. [DOI] [PubMed] [Google Scholar]
- 21. Jansen T, Hofmans MPM, Theelen MJG, Schijns VEJC. Structure‐activity relations of water‐in‐oil vaccine formulations and induced antigen‐specific antibody responses. Vaccine 2005; 23:1053–60. [DOI] [PubMed] [Google Scholar]
- 22. Morel S, Diderlaurent A, Bourguignon P et al. Adjuvant System AS03 containing α‐tocopherol modulates innate immune response and leads to improved adaptive immunity. Vaccine 2011; 29:2461–73. [DOI] [PubMed] [Google Scholar]
Associated Data
This section collects any data citations, data availability statements, or supplementary materials included in this article.
Supplementary Materials
Data S1. This supplementary information contains particle size and SDS‐PAGE analysis from the various antigen‐adjuvant mixtures. In addition, this supplementary information contains data obtained from multiplex cytokine bead array as well as additional data regarding antibody endpoint titers, antibody‐secreting plasma cells, and IL‐5 cytokine production.
Figure S1. Particle size of antigen‐adjuvant mixtures at 0, 4, or 24 hours after mixing and storage at 5 °C or room temperature.
Figure S2. Gold‐stained blots of SDS‐PAGE of antigen‐adjuvant mixtures at 0, 4, or 24 hours after mixing and storage at 5 °C or room temperature.
Figure S3. Antigen‐specific cytokine levels determined from multiplex cytokine bead assay using rH5‐stimulated splenocyte supernatants.
Figure S4. Antibody responses to rH5 vaccines at different doses of rH5 with various emulsions as measured after prime and boost immunizations.
Figure S5. Antigen‐specific IL‐5 producing cells detected 4 weeks after boost immunization with rH5 vaccines at different doses of rH5 with various emulsions.
Supporting info item


