

Abstract
Background
Influenza virus A(H1N1)pdm09 first appeared in Israel in late April 2009, disappeared in mid‐March 2010, and reappeared in late October 2010. Symptoms were mostly mild without need for medical care.
Objectives
To provide targets for future pandemic preparedness and response by evaluating the dynamics and cumulative incidence of A(H1N1)pdm09 infection, the virus‐specific seroprevalence (HI antibody titer >1:40) at the height of the pandemic, during its decline and thereafter.
Methods
A cross‐sectional seroepidemiological study was conducted on 6911 serum samples collected before, during, and after the pandemic.
Results
Cumulative incidence of infection derived from the differences between post‐ and pre‐pandemic seroprevalence was 54·1%, 32·9%, 22·9%, 14·8%, and 6·3% in age‐groups 0–9, 10–19, 20–49, 50–79, and ≥80 years, respectively, and 28·5% for all age‐groups combined. Vaccination could have contributed at the most 4·6% to the post‐pandemic population seroprevalence. High pre‐pandemic immune response (47·4%) found in a cohort aged 15–18 year was strongly associated with birth years 1990–1993. Morbidity began to decline in mid‐November 2009 at 32·8% population seroprevalence (45% in ages 0–19 year) and stopped in March 2010 at 43·4% population seroprevalence in February 2010 (70% in ages 0–19 year). Between February and September 2010, seroprevalence declined by 12·2% allowing virus recirculation from October 2010.
Conclusions
Our study provides targets for controlling future influenza pandemics in Israel. Vaccination should focus on the younger age‐groups (0–19 year) which played a key role in transmission of the A(H1N1)pdm09 due to lack of background immunity (ages 0–9 year) and high exposure rates (ages 10–19 year).
Keywords: A(H1N1)pdm09, immunity, incidence, pandemic, seroprevalence
Introduction
The novelty of the pandemic influenza A(H1N1)pdm09 provided a rare opportunity to study the dynamics of influenza infection and immunity. Surveillance of clinical cases alone is limited in its ability to estimate the cumulative incidence of infection, especially when a large proportion of the infections are mild or asymptomatic, as was the case with the A(H1N1)pdm09 virus.1 Transmission, case‐fatality and hospitalization rates can only be evaluated when the true incidence of infection is assessed, based on sero‐epidemiological studies. A recent review concluded that exposure to the virus based on comparison between seroprevalence in samples collected before and after the pandemic was highest in children and teenagers reaching 16–43% globally.2 Pre‐pandemic seroprevalence was highest in age‐groups >60 years.1
A traveler returning from Mexico was the first diagnosed case in Israel in April 26th, 2009.3 Local circulation was monitored by an enhanced surveillance system based on records of visits to primary physicians due to influenza‐like illness (ILI) and on laboratory results of respiratory samples taken from ILI patients in sentinel clinics.4, 5
The pandemic in Israel was characterized by three waves of morbidity peaking in mid‐August, in mid‐September, and in November 2009.5 Vaccination of high‐risk groups began in mid‐October and covered 7% of the population. Vaccine was available for the general population from mid‐November, and an additional 4·6% of the population was vaccinated.
Our study was initiated to find the cumulative incidence of infection in different age‐groups, the level of population seroprevalence at which the epidemic virus disappeared, and the decay of the immunity after circulation was interrupted.
Methods
Clinical surveillance for influenza at community clinics
The Israel Center for Disease Control (ICDC), Ministry of Health, operates a seasonal influenza surveillance for clinical cases. This surveillance is based on patients who visited any of Maccabi Healthcare Services' (the second largest HMO in Israel, which covers about 25% of the population) community clinics and received the diagnosis of influenza‐like illness (ILI) based on their physician clinical judgment (=case). Weekly incidence is expressed as cases/10 000 population and is stratified by age.
Serum samples
Frozen serum samples were obtained from serum bank, which is a national project on anonymous samples run by the Israel Center for Disease Control and approved by the legal department of the Ministry of Health. The serum samples represented the Israeli population, countrywide, men and women of all ages.
The younger age‐groups (0–18 years) were residual sera from diagnostic laboratories, while healthy blood donors comprised the adult population (19–55 years). For age‐groups >55 years, samples were residuals from diagnostic laboratories and healthy blood donors. These sources excluded cases suspected of immunologic disorders. Information about age and gender was available on all samples.
Baseline seroprevalence to A(H1N1)pdm09 was based on 1500 serum samples collected from April to September 2008, approximately 30 randomly selected samples per month for each of the following age‐groups (years): 0–9, 10–19, 20–29, 30–39, 40–49, 50–59, 60–69, and 40 serum samples monthly for the age‐group ≥70‐year‐olds. Additional 136 samples collected between January and April 2009 were obtained for age‐group 80 years and older. For evaluation of immunity during the pandemic period, we used serum samples collected from June 2009 to September 2010. A minimum of 250 representative samples per month were obtained with a minimum of 30 for each of the following age‐groups (years): 0–9, 10–19, 20–29, 30–39, 40–49, 50–59, 60–69, and at least 40 monthly samples for the age‐group ≥70 years. All sera collected were stored frozen at −80°C until use.
Frozen sera collected during 1999 and 2006 and stratified by year of birth (n = 550) were used to assess the association between the year of birth and the baseline seroprevalence in specific cohorts born between 1984 and 1995.
Laboratory procedures
Haemagglutination inhibition (HI) assay
Antibodies against A(H1N1)pdm09 were detected by HI according to standard procedure.6, 7 The virus strain used was A/California/7/09 X‐179A (provided by NCIRD/CCID/CDC, Atlanta, GA, USA). The virus was propagated in embryonated chicken eggs, inactivated by formaldehyde, and calibrated to 4 HI units per test.8
Serum samples were tested in duplicates at an initial dilution of 1:20 and a final dilution of 1:2560. The cutoff value selected for a positive result was 1:40. HI antibody titers of ≥1:40 had been shown to correlate with reduction of 50% of the risk of contracting an influenza infection or disease9, 10, 11 and is frequently used as proxy for immunity. Thus, the term seroprevalence in this study refers to prevalence of antibody at titers of ≥1:40. For calculation of the geometric mean titer (GMT), samples negative by the HI assay were assigned a titer of 1:10.
Microneutralization assay
The microneutralization assay was performed as described previously.7 Human sera were heat inactivated for 30 min at 56°C, and twofold serial dilutions of 1:20–1:2560 were performed in a 50‐μl volume of Dulbecco's modified Eagle's medium containing 2% fetal bovine serum and antibiotic in immunoassay plates. The diluted sera were mixed with an equal volume of the same medium containing 102 TCID50/50 μl of A/California/2009 influenza virus. After 2 hour incubation at 37°C in a 5% CO2 humidified atmosphere, 100 μl of MDCK cells at 1·5 × 105/ml were added to each well. The plates were incubated for 20 hour at 37°C and 5% CO2. The supernatant was removed, and monolayers were washed with PBS and fixed in 80% cold acetone for 10 minutes. The presence of viral protein was detected by ELISA with a monoclonal antibody to the influenza A NP (clone A‐1 and A‐3, Millipore) as described previously.7 Sera‐negative at 1:20 dilution were assigned a titer of 1:10.
Statistical analysis
The cumulative incidence was calculated for each age‐group and time period with 95% confidence intervals according to the binomial distribution.
Spearman's correlation test was used to calculate correlation coefficients between cumulative incidence of infection and age and between the results of HI and microneutralization tests. Chi‐square tests were used to compare the difference between the seropositivity at the end of the pandemic period (February–March 2010) and the latest post‐pandemic value recorded in August–September 2010. Similarly, the T‐test was used to assess the difference in GMT between February–March and August–September 2010. The seropositivity percents of all population were calculated using age standardization by age distribution of Israeli population 2009. All statistical analyses were performed using sas version 9.1.3 (SAS Institute Inc., Cary, NC, USA).
Results
The pandemic period in Israel
The pandemic virus appeared in Israel in late April 2009, and the pandemic period lasted until the end of March 2010 when no more cases were detected. The virus was detected once again only in October 2010 and co‐circulated with other influenza viruses during the next winter season. During the pandemic period, morbidity rates based on visits to community clinics due to ILI were followed by the ICDC.5, 12 Figure 1 shows the age‐related dynamics of the morbidity which peaked in August, September, and November of 2009. The highest incidence rate was recorded in age‐group 2–18 years with the highest peak in mid‐November 2009 (45/10 000 cases; 0·45%). From mid‐November, morbidity declined in all age‐groups until the final arrest of virus circulation in March 2010.
Figure 1.
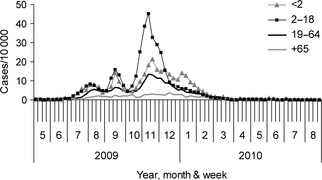
Rates of influenza ‐like illness in Israel. The rates (outpatients per 10 000 population) are presented by week in four age‐groups, from May 2009 to August 2010. The data were derived from the clinical surveillance operated by the Israel Center for Disease Control in Israel.
The seroprevalence study
A cross‐sectional, seroprevalence study was initiated to obtain information on cumulative incidence of infection and immunity with respect to the virus circulation and morbidity. It was carried out throughout the pandemic period (June 2009 to March 2010) to study the dynamics of the infection and continued during the following spring and summer seasons (April to September 2010) and to evaluate the persistence of the population immunity levels. All details of the study population and results are summarized in Table 1. The data shown in the table formed the basis for some of the analyses described below.
Table 1.
The number of samples and the seroprevalence obtained for each age‐group at each time point during and after the pandemic
| Age‐group | Months | |||||||
|---|---|---|---|---|---|---|---|---|
| 6–7/2009 | 8–9/2009 | 10–11/2009 | 12/09–1/10 | 2–3/2010 | 4–5/2010 | 6–7/2010 | 8–9/2010 | |
| 0–9 years | ||||||||
| n | 60 | 60 | 60 | 129 | 95 | 116 | 100 | 100 |
| % Positivea | 0 | 11·7 (3·5–19·8) | 16·7 (7·2–26·1) | 46·5 (37·9–55·1) | 54·7 (44·7–64·8) | 43·1 (34·1–52·1) | 45·0 (35·3–54·8) | 40·0 (30·4–49·6) |
| GMTb | 10·1 (9·9–10·3) | 13·3 (11·0–16·2) | 15·3 (11·9–19·6) | 32·1 (25·4–40·5) | 54·7 (38·7–77·5) | 31·3 (24·6–39·8) | 31·4 (24·2–40·6) | 27·7 (21·5–35·7) |
| 10–19 Years | ||||||||
| n | 60 | 60 | 60 | 168 | 110 | 141 | 100 | 108 |
| % Positivea | 15·0 (5·9–24·0) | 18·3 (8·5–28·1) | 33·3 (21·4–45·3) | 44·0 (36·5–51·6) | 60·9 (51·8–70·0) | 59·6 (51·5–67·7) | 65·0 (55·7–74·4) | 57·4 (48·1–66·7) |
| GMTb | 15·7 (12·1–20·3) | 14·5 (12·1–17·2) | 26·4 (18·8–37·0) | 37·4 (29·8–47·0) | 56·9 (42·3–76·6) | 54·5 (42·2–70·3) | 55·0 (42·1–71·9) | 50·7 (38·1–67·5) |
| 20–49 Years | ||||||||
| n | 178 | 177 | 169 | 200 | 186 | 243 | 296 | 292 |
| % Positivea | 7·9 (3·9–11·8) | 10·2 (5·7–14·6) | 14·2 (8·9–19·5) | 31·5 (25·1–37·9) | 30·1 (23·5–36·7) | 21·8 (16·6–27·0) | 28·4 (23·2–33·5) | 26·4 (21·3–31·4) |
| GMTb | 12·2 (11·1–13·5) | 13·5 (12·0–15·2) | 14·3 (12·8–16·1) | 22·2 (18·7–26·3) | 24·9 (20·5–30·3) | 18·7 (16·3–21·5) | 20·7 (18·1–23·7) | 18·7 (16·8–20·9) |
| 50–79 Years | ||||||||
| n | 174 | 179 | 176 | 195 | 216 | 257 | 256 | 248 |
| % Positivea | 4·0 (1·1–6·9) | 7·3 (3·5–11·1) | 8·5 (4·4–12·7) | 16·9 (11·7–22·2) | 20·8 (15·4–26·3) | 19·1 (14·3–23·9) | 15·6 (11·2–20·1) | 10·5 (6·7–14·3) |
| GMTb | 11·1 (10·6–11·7) | 12·1 (11·2–13·0) | 13·1 (12·0–14·3) | 15·8 (13·8–18·0) | 18·3 (15·7–21·2) | 16·3 (14·4–18·4) | 14·4 (13·2–15·9) | 13·6 (12·5–14·9) |
| 80 Years+ | ||||||||
| n | 28 | 24 | 35 | 35 | 41 | 43 | 48 | 52 |
| % Positivea | 21·4 (6·2–36·6) | 41·7 (21·9–61·4) | 42·9 (26·5–59·3) | 45·7 (29·2–62·2) | 46·3 (31·8–61·6) | 53·5 (38·6–68·4) | 39·6 (25·8–53·4) | 32·7 (19·9–45·4) |
| GMTb | 16·8 (12·3–22·9) | 22·2 (14·4–34·3) | 22·5 (16·6–30·5) | 28·6 (18·9–43·1) | 35·5 (25·0–50·5) | 36·3 (24·6–53·6) | 27·5 (19·8–38·2) | 21·7 (16·4–28·6) |
Data are % (95% confidence interval).
Geometric mean titer (95% confidence interval).
The dynamics of the infection
The dynamics of infection reflected by the increase in seroprevalence (% positive) with time was assessed in different age‐groups on a bimonthly basis between June 2009 and March 2010, as shown in Figure 2 (“during pandemic 2009–2010”). The highest rate of increase was observed in the youngest age‐group of 0–9 years from October to November 2009 (16·7%) to December 2009–Jan 2010 (46·5%), following the major morbidity peak and reached 54·7% in February–March 2010 at the end of the pandemic period. Immunity in age‐group 10–19 years increased markedly from August to September 2009 reaching 60·9% in February–March 2010. Seroprevalence in age‐groups 20–49 and 50–79 years increased moderately, reaching 30·1% and 20·8%, respectively, at the end of the pandemic period. The seroprevalence in age‐group 80 years and above rose to 41·7% in August–September 2009 then increased slowly reaching 46·3% in February–March 2010.
Figure 2.
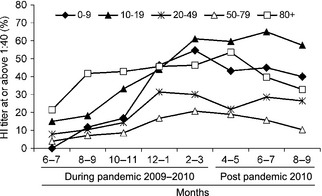
Cumulative rates (%) of sero‐positive samples (HI ≥ 1:40) in five age‐groups during and after the pandemic. The rates were calculated on a bimonthly basis during and after the pandemic period in Israel (June 2009–March 2010 and April–September 2010, respectively).
The cumulative incidence of infection during the entire pandemic period
The cumulative incidence of infection over the entire pandemic period was based on the difference in seroprevalence between post‐pandemic and pre‐pandemic (baseline) immunity. The 1500 pre‐pandemic samples were tested for antibodies to A(H1N1)pdm09 by HI. For post‐pandemic immunity, we combined the HI results of samples collected from February to March 2010. Table 2 shows the pre‐ and post‐pandemic immunity and the difference between them.
Table 2.
Comparison between seroprevalence rates (Percent with HI ≥ 1:40), before and at the end of the pandemic period, stratified by age‐group
| Age‐group (years) | Pre‐pandemic (April–September 2008) | End of pandemic (February–March 2010) | Difference | ||||
|---|---|---|---|---|---|---|---|
| n | % Positivea | GMTb | n | % Positivea | GMTb | % Positivea | |
| 0–9 | 180 | 0·6 (0·0–1·6) | 10·1 (9·9–10·3) | 95 | 54·7 (44·7–64·7) | 54·7 (38·7–77·5) | 54·1 (44·1–64·2) |
| 10–19 | 186 | 28·0 (21·5–34·4) | 20·3 (17·2–23·9) | 110 | 60·9 (51·8–70·0) | 56·9 (42·3–76·6) | 32·9 (21·8–44·1) |
| 20–49 | 512 | 7·2 (5·0–9·5) | 11·9 (11·4–12·5) | 186 | 30·1 (23·5–36·7) | 24·9 (20·5–30·3) | 22·9 (15·9–29·8) |
| 50–79 | 532 | 6·0 (4·0–8·0) | 11·9 (11·4–12·4) | 216 | 20·8 (15·4–26·2) | 18·3 (15·7–21·2) | 14·8 (9·0–20·6) |
| 80+ | 90 | 40·0 (29·9–50·1) | 25·2 (20·8–30·4) | 41 | 46·3 (31·1–61·6) | 35·5 (25·0–50·5) | 6·3 (0–24·7) |
| All ages | 1500 | 9·9 (8·5–11·5) | 13·1 (12·6–13·5) | 648 | 38·4 (34·6–42·2) | 29·7 (26·5–33·2) | 28·5 (24·4–32·5) |
Data are % (95% confidence interval).
Geometric mean titer (95% confidence interval).
Baseline seroprevalence was highest in age‐group 80 years and older as published previously.13, 14 The lowest baseline seroprevalence was in the youngest age‐group (0–9 years), while in age‐groups 20–49 and 50–79, the baseline seroprevalence was intermediate. Surprisingly, the baseline seroprevalence in age‐group 10–19 years was higher than for the older age‐groups (20–79). This has not been noticed in previous studies1 and was further investigated as described below.
The post‐pandemic seroprevalence was highest in age‐group 10–19 followed by age‐groups 0–9, >80, 20–49, and 50–79 (Table 2). Seroprevalence rates shown in Table 2 are slightly different from the rates shown in Table 1 at the start of the pandemic period (June–July 2009) because they represent different sets of samples by size and collection period, but both show the same picture.
The difference between post‐ and pre‐pandemic seroprevalence reflecting the cumulative incidence of infection over the entire pandemic period was negatively correlated with age: the highest (54·1%) was in age‐group 0–9 years, and the lowest (6·3%) was in age‐group ≥80 years. In age‐groups 10–19, 20–49, and 50–79, the rates were 32·9%, 22·9%, and 14·8%, respectively (Spearman correlation test r = −0·9, P = 0·0374) (Table 2). Interestingly, age‐group 10–19 was not protected from infection in spite of the high baseline seroprevalence. The cumulative incidence of infection for the entire population was 28·5% (CI: 24·4–32·5).
Potential bias due to differences between the two serum sources (blood donors and residual sera from diagnostic laboratories) was examined in age‐group 55–69 years by comparing the percent of positive in 65 pre‐pandemic and 28 post‐pandemic sera from healthy blood donors to 279 pre‐pandemic and 118 post‐pandemic sera from diagnostic laboratories. The pre‐pandemic seroprevalence was 4·6% (0–9·7%) for healthy blood donor and 5·4% (2·7–8%) for sera from diagnostic laboratories. The post‐pandemic seroprevalence was 17·9% (3·7–32%) for healthy blood donor and 17·8% (10·9–24·7%) for sera from diagnostic laboratories. The differences between the two serum sources in age‐group 55–69 years were non‐significant by chi‐square test (P = 0·8 for pre‐pandemic seroprevalence and 0·99 for post‐pandemic seroprevalence, 95% confidence interval).
Baseline seroprevalence in age‐group 10–19 years
The high baseline seroprevalence (28·0%) in age‐group 10–19 (Table 2) was further investigated. False‐positive results were excluded by retesting, and additional age‐stratification analysis showed that the high seroprevalence was observed primarily in those aged 15–18 years (47·4%, CI 31·5–63·2). Similarly, the GMT values were above 20 in age‐group 15–18 and below 20 for all other age‐groups in sera collected in 2008 (data not shown).
Our results were further confirmed by the highly specific microneutralization (MN) assay. Table 3 shows the results of the HI and MN assays in representative serum samples of 2008 from age‐group 10 to 19. HI and MN results for age‐group 15–18 were 47·4% and 55·3%, respectively, while for age‐group 10–19 excluding 15–18, they were 8·8% and 10·5%, respectively. Age‐groups 0–9 and 70 years and older were used as controls for lack of background and high background immunity, respectively. Spearman's rank correlation between the HI and MN titers was 0·9 (P < 0·001), indicating a significantly positive correlation.
Table 3.
Comparative evaluation by Haemagglutination inhibition and microneutralization assays of pre‐pandemic immunity in different age‐groups
| Age‐group (years) | Percent with titer at or above 1:40a | GMTb | ||
|---|---|---|---|---|
| Haemagglutination inhibition | Microneutralization | Haemagglutination inhibition | Microneutralization | |
| 10–19 (n = 95) | 24·2 (15·6–32·8) | 28·4 (19·3–37·5) | 19·6 (15·5–24·7) | 26·2 (19·2–35·8) |
| 15–18 (n = 38) | 47·4 (31·5–63·2) | 55·3 (39·4–71·1) | 35·9 (23·0–56·0) | 60·9 (34·5–107·3) |
| 10–19 excluding 15–18 (n = 57) | 8·8 (1·4–16·1) | 10·5 (2·6–18·5) | 13·1 (10·8–15·8) | 14·9 (11·4–19·6) |
| 0–9 (n = 24) | 0·0 | 0·0 | 10·0 | 10·0 |
| 70 + (n = 36) | 47·2 (30·9–63·5) | 41·7 (25·6–57·8) | 30 (21·3–42·1) | 34·3 (22·0–53·4) |
Data shown are: % (95% confidence interval).
Data shown are: Geometric Mean Titer (95% confidence interval).
The members of this cohort were born between 1990 and 1993 and were not exposed to the 1918 pandemic virus or its direct descendents. The association with the year of birth was then assessed in serum collections from previous years which represent cohorts born between 1984 and 1995. Samples collected in 2006 included age‐groups 11–22 years (18–25 samples for each year), and samples collected in 1999 included age‐groups 4–15 years (24–26 samples for each year). Table 4 shows the seroprevalence in those born in 1990–1993 compared with all others in the serum collections from 1999, 2006, and 2008. The values were significantly higher (P < 0·0001, chi‐square test) in those born in 1990–1993 for all three serum collections. Lower values in sera from 2006 and 1999 compared with 2008 are most likely due to the long storage periods.
Table 4.
Association of birth year with pre‐pandemic seroprevalence in sera collected in 1999, 2006, and 2008 from individuals born in 1984–1995
| Sample collection (year) | Birth year | Number of samples | % positive (95% CI) | P a(Chi‐square test) |
|---|---|---|---|---|
| 1999 | 1990–1993 | 100 | 32 (22·8–41·1) | <0·0001 |
| 1984–1995 without 1990–1993 | 201 | 7·9 (4·2–11·7) | ||
| 2006 | 1990–1993 | 98 | 38·7 (29·1–48·4) | <0·0001 |
| 1984–1995 without 1990–1993 | 151 | 14·5 (8·9–20·2) | ||
| 2008 | 1990–1993 | 78 | 51·2 (40·1–62·3) | <0·0001 |
| 1984–1995 without 1990–1993 | 157 | 15·2 (9·6–20·9) |
Chi‐square test compare between those born in 1990–1993 and those born in 1984–1995 without 1990–1993, in the serum collections from 1999, 2006, and 2008.
Persistence of population immunity after the pandemic period
The end of the pandemic period was evidenced in March 2010 by the absence of new cases, in spite of extensive surveillance. The subsequent decay in seroprevalence was followed in sera collected until September 2010, less than a month before A(H1N1)pdm09 reappeared. Data in Table 1 and Figure 3 show the increase and persistence of the entire population's seroprevalence before, during, and after the pandemic period. The highest seroprevalence was observed in February 2010, 3 months after the last and highest peak of morbidity, followed by a gradual decline. By September 2010, it dropped significantly (P = 0·0116), from 43·4% at the peak to 31·2% (12·2% lower). Stratification by age‐groups (Table 1) showed a significant decline by 14·7% (from 54·7% to 40%) in the youngest age‐group (0–9 year, P = 0·0394), a highly significant decline (P = 0·0020) of 10·3% (from 20·8% to 10·5%) in age‐group 50–79, a non‐significant decline (P = 0·1797) of 13·6% (from 46·3% to 32·7%) in the oldest age‐group (>80 year), and very modest decline in age‐groups 10–19 (3·5%, from 60·9% to 57·4%; P = 0·5989) and 20–49 (3·7%, from 30·1% to 26·4%; P = 0·3740). For geometric mean titer (GMT), significant decline was found in all age‐groups except 10–19.
Figure 3.
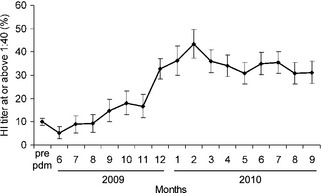
Accumulation of immunity to pandemic (H1N1) 2009 in the entire Israeli population. Percent of sero‐positive samples (HI ≥ 1:40) found in sera collected before the pandemic period (pre‐pandemic), during the pandemic period (June 2009–March 2010), and after the pandemic period (April–September 2010). Error bars represent 95% CIs.
Discussion
Our study describes the dynamics of the infection with the pandemic virus A(H1N1)pdm09 between June 2009 and March 2010 as reflected by the increase in seroprevalence in the population and tracks its decline during the post‐pandemic period between March and September 2010.
The cumulative incidence of infection over the entire pandemic period (from June 2009 to March 2010) was 28·5% for the entire population, decreased with age, was particularly high in children age 0–9 years (54·1%) and very low in elderly age 80 years and over (6·3%). The clinical survey shown in Figure 1 is in agreement with these results.
Conversely, pre‐pandemic seroprevalence and GMT increased with age and was highest in the oldest age‐group which was protected from infection, apparently due to their exposure to the 1918 H1N1 pandemic virus.15, 16, 17
The contribution of vaccination to the population seroprevalence is considered to have been small. In Israel, the vaccination campaign started late in October, and at first, the vaccine was available only to health‐care workers and to people at high risk of complications and covered 7% of the population, primarily from high‐risk groups. Vaccination of the general public began in mid‐November and by March 2010, at the end of the pandemic, 11·6% of the population was eventually vaccinated, most of them after the main peak of morbidity in mid‐November. Thus, it was estimated that the impact of the vaccination on the seroprevalence was at the maximum by 4·6%, representing vaccinees who could have been included among the serum donors. Unfortunately, due to the lack of data regarding vaccination rates in each age‐group, we could not provide more accurate estimations.
Most of the results discussed earlier correlate well with previous publications describing the dynamics of the pandemic virus infections in different countries and age distribution.1, 11, 18, 19, 20, 21, 22
It is noteworthy that a recently published study,2 which compared many sero‐epidemiological surveys published after the 2009 pandemic, suggests that CI calculations based on the binomial distribution led to underestimation of the uncertainty associated with estimates of the cumulative incidence of infection. However, the overall conclusions remain the same. Of particular interest is our finding of an association between years of birth 1990 and 1993 (age‐group 15–18 in 2008) and high baseline seroprevalence is novel. Unexplained peaks in baseline seroprevalence in cohorts which include this age‐group were also reported by others but were not investigated.18, 22 In a British study,22 age‐group 15–24 had baseline seroprevalence of 17·5%. Further analysis of this group revealed 31% (CI: 17·3 −49·2), 19·4% (CI: 9·8–35·0), and 9·1% (CI: 3·9–19·6) seroprevalence in age‐groups 15, 16–18, and 19–24, respectively, which is similar to our results (E. Miller, personal communication). Similarly, detailed analysis in New Zealand18 revealed baseline seroprevalence of 32·1% (95% CI: 14·4–49·9) in 104 individuals born between 1990 and 1993 (age‐group 16–19 in 2009), while in 28 individuals born between 1987 and 2001, excluding those born between 1990 and 1993, the baseline seroprevalence was 4·8% (95% CI: 0·6–9·0) (Timothy Wood, personal communication, provisional data). We were not able to find the source of this baseline seroprevalence. The H1N1 influenza viruses which had circulated in Israel in 1990–1994 were A/Victoria/36/1988 and A/Taiwan/1/1986, none of which is known to be antigenically related to the A(H1N1)pdm09 strain. One can speculate that either there is a specific cross‐reactivity which has not been identified before or that a yet unidentified influenza virus which is antigenically related to the 2009 pandemic virus had circulated silently and induced this immunity. Further investigation is required to explore such possibility or find other possible causes.
Interestingly, in spite of their high background seroprevalence, age‐group 10–19 y had a very high cumulative incidence of infection (32·9%) which could be attributed to the high level of exposure in educational institutions or in the military. Indeed, at the very early phases of the pandemic (April 26–July 7), age‐group 18–24 was the most affected group in Israel with most of the cases occurring in summer camps and army units.3 Later, after the re‐opening of schools in September, younger age‐groups were also exposed.
The long‐term follow‐up of the decline in the population seroprevalence after the pandemic period and up to 1 month before the reappearance of A(H1N1)pdm09 in Israel in October 2010 is exceptional. It shows more moderate decline than was previously reported in smaller and more specific cohorts.23, 24, 25 The highest and most significant decline by 14·7% (P = 0·0394, χ2) observed in age‐group 0–9 is typical of primary response with generally low cross‐reacting antibodies. The highly significant decline (P = 0·0020, χ2) observed in age‐group 50–79 is probably attributed to the weakening of the immune system with age. Conversely, the non‐significant (P = 0·1797, χ2) decline in the oldest age‐group (≥80 year), in spite of their weak immune system, is apparently related to the high baseline cross‐reactive antibodies. Of particular interest is age‐group 10–19 in which the post‐pandemic decline in seroprevalence was very modest (3·5%) and non‐significant (P = 0·5989, χ2). This is more typical of a booster response rather than a primary response, and it further supports the speculation that many individuals in this age‐group had been previously exposed to an influenza virus antigenically related to A(H1N1)pdm09. However, repeated exposure to the pandemic virus throughout the pandemic period in this age‐group is also a possible explanation.
The turning point of the pandemic in Israel was in mid‐November when the seroprevalence reached about 45% in the younger age‐groups (0–19) and 32·8% in all age‐groups combined. By this time, vaccination of the general population has just begun and thus had small impact on our survey. From this point on morbidity declined sharply, although the seroprevalence continued to rise, partially due to vaccination. Virus circulation stopped completely when seroprevalence of the entire population was 43·4%, in February 2010 which is the midst of a regular influenza season. Therefore, the end of the pandemic is not likely to have been influenced by climatic circumstances, but rather by the acquired herd immunity.
Our study shows the seroprevalence required in specific age‐groups in order to reduce the effective reproductive number (Re) to below one and to slow influenza virus circulation down to a stop. Children are of particular importance due to the high attack rate among them and their known role in dispersing of the disease. This was indeed proven for the A(H1N1)pdm09 virus by Glass et al.26 These thresholds are important for policy makers to set minimum targets for vaccination coverage for novel influenza strain, as well as seasonal viruses. They have implications on both the minimal vaccine stockpile needed, and the logistics and persuasive efforts required to slow the pandemic by vaccination. In particular, vaccination efforts should focus on the youngest age‐groups (0–25y) in addition to the high‐risk groups.
Our study shows the correlation between the reappearance of the pandemic virus and the decline in seroprevalence in the population, which dropped to 31·2% in September 2010. Thus, it emphasizes the importance of revaccinating the population each year before the influenza season begins.
Acknowledgements
This study was supported by funds obtained from the Public Health Services, Central Virology Laboratory, and the Israel Center for Disease Control, Israel Ministry of Health.
We wish to thank: Adam Jaber, Irena Jornist, and Hilda Sherbany who carried out HI and microneutralization tests, to Nadia Pekurovski, Kamila Regimov, and Anna Bott who collected the serum samples, to Hanna Sefty who was responsible for ILI influenza surveillance network, and to Yaniv Ovadia who helped to analyze this data. We also thank Maccabi Health‐Care Services for providing anonymous data regarding outpatient visits for ILI.
Weil et al (2012) The dynamics of infection and the persistence of immunity to A(H1N1)pdm09 virus in Israel. Influenza and Other Respiratory Viruses 7(5), 838–846
References
- 1. Broberg E, Nicoll A, Amato‐Gauci A. Seroprevalence to influenza A(H1N1) 2009 Virus–Where Are We? Clin Vaccine Immunol 2011; 18:1205–1212. [DOI] [PMC free article] [PubMed] [Google Scholar]
- 2. Kelly H, Peck HA, Laurie KL, Wu P, Nishiura H, Cowling BJ. The age‐specific cumulative incidence of infection with pandemic influenza H1N1 2009 was similar in various countries prior to vaccination. PLoS ONE 2011; 6:e21828. [DOI] [PMC free article] [PubMed] [Google Scholar]
- 3. Roll U, Yaari R, Katriel G et al Onset of a pandemic: characterizing the initial phase of the swine flu (H1N1) epidemic in Israel. BMC Infect Dis 2011; 11:92. [DOI] [PMC free article] [PubMed] [Google Scholar]
- 4. Bromberg M, Kaufman Z, Mandelboim M et al Clinical and virological surveillance of influenza in Israel‐implementation during pandemic influenza. Harefuah 2009; 148:577–582, 659. [PubMed] [Google Scholar]
- 5. Engelhard D, Bromberg M, Averbuch D et al Increased extent of and risk factors for pandemic (H1N1) 2009 and seasonal influenza among children, Israel. Emerg Infect Dis 2011; 17:1740–1743. [DOI] [PMC free article] [PubMed] [Google Scholar]
- 6. Kendal AP, Pereira MS, Skehel JJ. Concepts and Procedures for Laboratory‐Based Influenza Surveillance. Atlanta, GA: US Department of Health and Human Services, CDC, 1982. [Google Scholar]
- 7. Rowe T, Abernathy RA, Hu‐Primmer J et al Detection of antibody to avian influenza A (H5N1) virus in human serum by using a combination of serologic assays. J Clin Microbiol 1999; 37:937–943. [DOI] [PMC free article] [PubMed] [Google Scholar]
- 8. Zhu FC, Wang H, Fang HH et al A novel influenza A (H1N1) vaccine in various age groups. N Engl J Med 2009; 361:2414–2423. [DOI] [PubMed] [Google Scholar]
- 9. Hobson D, Curry RL, Bear AS, Ward‐Gardner A. The role of serum haemagglutination‐inhibiting antibody in protection against challenge infection with influenza A2 and B viruses. J Hyg (Lond) 1972; 70:767–777. [DOI] [PMC free article] [PubMed] [Google Scholar]
- 10. de Jong JC, Palache AM, Beyer WE, Rimmelzwaan GF, Boon AC, Osterhaus AD. Haemagglutination‐inhibiting antibody to influenza virus. Dev Biol (Basal) 2003; 115:63–73. [PubMed] [Google Scholar]
- 11. Cox CM, Goodin K, Fisher E et al Prevalence of 2009 pandemic influenza A (H1N1) virus antibodies, Tampa Bay Florida–November‐December, 2009. PLoS ONE 2011; 6:e29301. [DOI] [PMC free article] [PubMed] [Google Scholar]
- 12. Israel Center for Disease control . Influenza activity weekly reports 2009–2010 in Israel. Available at http://www.old.health.gov.il/english/Pages_E/default.asp?maincat=15&catId=24&PageId=105, via internet (Accessed 6 February 2012).
- 13. Hancock K, Veguilla V, Lu X et al Cross‐reactive antibody responses to the 2009 pandemic H1N1 influenza virus. N Engl J Med 2009; 361:1945–1952. [DOI] [PubMed] [Google Scholar]
- 14. Ikonen N, Strengell M, Kinnunen L et al High frequency of cross‐reacting antibodies against 2009 pandemic influenza A(H1N1) virus among the elderly in Finland. Euro Surveill 2010; 15:pii:19478. [PubMed] [Google Scholar]
- 15. Garten RJ, Davis CT, Russell CA et al Antigenic and genetic characteristics of swine‐origin 2009 A(H1N1) influenza viruses circulating in humans. Science 2009; 325:197–201. [DOI] [PMC free article] [PubMed] [Google Scholar]
- 16. Itoh Y, Shinya K, Kiso M et al In vitro and in vivo characterization of new swine‐origin H1N1 influenza viruses. Nature 2009; 460:1021–1025. [DOI] [PMC free article] [PubMed] [Google Scholar]
- 17. Xu R, Ekiert DC, Krause JC, Hai R, Crowe JE Jr, Wilson IA. Structural basis of preexisting immunity to the 2009 H1N1 pandemic influenza virus. Science 2010; 328:357–360. [DOI] [PMC free article] [PubMed] [Google Scholar]
- 18. Bandaranayake D, Huang QS, Bissielo A et al Risk factors and immunity in a nationally representative population following the 2009 influenza A(H1N1) pandemic. PLoS ONE 2010; 5:e13211. [DOI] [PMC free article] [PubMed] [Google Scholar]
- 19. Burmaa A, Tsatsral S, Odagiri T, Suzuki A, Oshitani H, Nymadawa P. Cumulative incidence of pandemic influenza A (H1N1) 2009 by a community‐based serological cohort study in Selenghe Province, Mongolia. Influenza Other Respi Viruses 2012; 6:e97–e104. [DOI] [PMC free article] [PubMed] [Google Scholar]
- 20. Gilbert GL, Cretikos MA, Hueston L, Doukas G, O'Toole B, Dwyer DE. Influenza A (H1N1) 2009 antibodies in residents of New South Wales, Australia, after the first pandemic wave in the 2009 southern hemisphere winter. PLoS ONE 2010; 5:e12562. [DOI] [PMC free article] [PubMed] [Google Scholar]
- 21. Hardelid P, Andrews NJ, Hoschler K et al Assessment of baseline age‐specific antibody prevalence and incidence of infection to novel influenza A/H1N1 2009. Health Technol Assess 2010; 14:115–192. [DOI] [PubMed] [Google Scholar]
- 22. Miller E, Hoschler K, Hardelid P, Stanford E, Andrews N, Zambon M. Incidence of 2009 pandemic influenza A H1N1 infection in England: a cross‐sectional serological study. Lancet 2010; 375:1100–1108. [DOI] [PubMed] [Google Scholar]
- 23. Dellagi K, Rollot O, Temmam S et al Pandemic influenza due to pH1N1/2009 virus: estimation of infection burden in Reunion Island through a prospective serosurvey, austral winter 2009. PLoS ONE 2011; 6:e25738. [DOI] [PMC free article] [PubMed] [Google Scholar]
- 24. Huo X, Qi X, Tang F et al Seroprevalence of pandemic (H1N1) 2009 in pregnant women in China: an observational study. PLoS ONE 2011; 6:e17995. [DOI] [PMC free article] [PubMed] [Google Scholar]
- 25. Wang M, Yuan J, Li T et al Antibody dynamics of 2009 influenza A (H1N1) virus in infected patients and vaccinated people in China. PLoS ONE 2011; 6:e16809. [DOI] [PMC free article] [PubMed] [Google Scholar]
- 26. Glass K, Kelly H, Mercer GN. Pandemic Influenza H1N1: reconciling serosurvey data with estimates of the reproduction number. Epidemiology 2012; 23:86–94. [DOI] [PubMed] [Google Scholar]