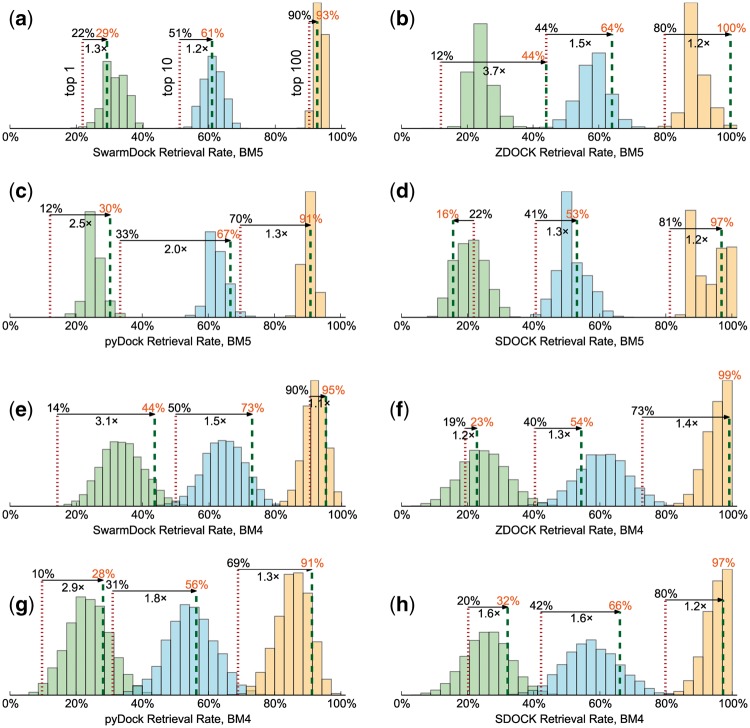
Fig. 3.
Each panel shows the top 1 (left), top 10 (centre) and top 100 (right) retrieval rates for the original (red dots) and consensus (green dashes) rankings, as well as the distributions for the ensembles of support vector machines when applied to the new complex in the benchmark 5 as external test set (a–d), and using multiple leave-many-out cross-validation of the benchmark 4 (e–h) (Color version of this figure is available at Bioinformatics online.)

