Abstract
The aims of the present study were to examine the potential role of microRNA-233-3p (miR)-223-3p in the tumorigenesis of hepatocellular carcinoma (HCC), and to investigate its diagnostic accuracy and potential molecular mechanisms. The expression data of miR-223-3p in HCC were obtained from the Gene Expression Omnibus (GEO). Data for the precursor miR-223 were obtained from The Cancer Genome Atlas (TCGA). The diagnostic role of miR-223-3p was identified by the receiver operating curve (ROC), and the diagnostic value of miR-223-3p in HCC was calculated from qualified reports in the literature. In addition, associated data from the GEO, TCGA and qualified experiments were pooled for comprehensive meta-analysis. Genes, which intersected between online prediction databases, natural language processing and differentially expressed genes from TCGA were regarded as potential targets of miR-223-3p in HCC. The Gene Ontology enrichment analysis and the Kyoto Encyclopedia of Genes and Genomes pathways of potential targets were performed using the Database for Annotation, Visualization and Integrated Discovery. The protein-protein interactions were mapped using the Search Tool for the Retrieval of Interacting Genes. Among 15 qualified microarray data sets from GEO, seven showed that a significantly lower level of miR-223-3p was present in the HCC tissues, compared with that in non-cancerous tissues (P<0.05). In addition, five GEO data sets revealed diagnostic values of miR-223-3p, with an area under the curve (AUC) of >0.80 (P<0.05). The diagnostic accuracy of the precursor miR-223 in TCGA was also calculated (AUC=0.78, P<0.05). Similarly, the precursor miR-223 showed a higher level of downregulation in HCC tissues, compared with that in healthy controls in TCGA (P<0.001). A summary ROC was also calculated as 0.89 (95% CI, 0.85–0.91) in the meta-analysis. A total of 72 potential targets were extracted, mainly involved in the terms ‘microRNAs in cancer’, ‘ATP binding’ and ‘prostate cancer’. Five potential target genes were considered the hub genes of miR-223-3p in HCC, including checkpoint kinase 1, DNA methyltransferase 1, baculoviral IAP repeat containing 5, kinesin family member 23, and collagen, type I, α1. Based on TCGA, the hub genes were significantly upregulated in HCC (P<0.05). Collectively, these results showed that miR-223-3p may be crucial in HCC carcinogenesis showing high diagnostic accuracy, and may be mediated by several hub genes.
Keywords: microRNA-223-3p, hepatocellular carcinoma, carcinogenesis, diagnosis accuracy, bioinformatics
Introduction
Hepatocellular carcinoma (HCC) is the fifth most common malignancy and the second most common contributing factor to cancer mortality rates worldwide (1–4). Although progress has been made in diagnostic and therapeutic strategies, the prognosis of patients with advanced HCC remains unsatisfactory, primarily due to its frequent recurrence and metastases (5–9). The 5-year survival rate has been previously reported to be 25–39% following resection (10–13). Therefore, it is necessary to investigate the underlying molecular mechanisms in the development of HCC to identify novel diagnostic markers and innovative therapeutic targets for patients with HCC.
MicroRNAs (miRNAs), a class of small, endogenous, single-stranded, non-coding RNAs, are 18–25 nucleotides in length and can alter gene expression. The aberrant expression of miRNAs can directly induce multiple diseases, including cancer. miRNAs have been used as non-invasive tumor biomarkers as they are involved in differentiation, proliferation and apoptosis in various malignancies (14–17). In HCC, the abnormal expression of miRNAs is essential during the progression of HCC (18–21). As reported, several miRNAs with lower expression levels can act as tumor suppressors in HCC tumorigenesis and growth (22–27), whereas certain upregulated miRNAs may function as HCC activators (28–31).
miR-223-3p is an miRNA, which has been identified in human diseases in previous studies. In penile carcinoma, the overexpression of miR-223-3p was considered a molecular classifier to differentiate tumors from non-cancerous tissues (32). The upregulation of miR-223-3p may be a potential diagnostic biomarker in esophageal squamous cell carcinoma (33). In addition, downregulated levels of miR-223-3p are closely associated with poor prognosis in bladder cancer (34). In HCC, cell proliferation is enhanced by low expression levels of miR-223-3p (35). A number of studies have also reported that downregulated miR-223-3p is a potentially favorable biomarker for early-stage diagnosis of HCC (36–38). However, certain studies have revealed that miR-223-3p is preferentially expressed in HCC, compared with healthy controls (39,40). Although it is maintained that circulating miR-223-3p can provide a certain degree of diagnostic accuracy in patients with HCC (41,42), reports on the diagnostic value for HCC in serum and tissues remain limited. Therefore, the present study aimed to perform a more comprehensive meta-analysis of the diagnostic value of miR-223-3p and precursor miR-223, based on data extracted from the Gene Expression Omnibus (GEO), The Cancer Genome Atlas (TCGA) and qualified literature.
miR-223-3p can directly target different genes and signaling pathways in a diverse set of diseases. For example, in non-small-cell lung cancer (NSCLC), an increased level of miR-223-3p induces the downregulation of insulin-like growth factor 1 receptor (IGF1R), which may indicate a potential therapeutic strategy for tyrosine kinase inhibitor-resistant NSCLC (43). The invasiveness of bladder carcinoma can be suppressed by targeting nuclear receptor coactivator 1 (NCOA1) by miR-223-3p (34). In addition, miR-223-3p can target stathmin 1 (STMN1) and IGF1R in gastric carcinoma to inhibit tumor progression (44). A previous study also reported that miR-223-3p accelerated the development of HCC through mediating the G2/M transition by targeting STMN1 (45), and miR-223-3p inhibits the onset and progression of HCC by repressing the gene expression of c-Myc (46). However, the potential mechanisms underlying the activity of miR-223-3p in HCC remain to be fully elucidated. Therefore, the specific molecular mechanisms by which miR-223-3p is involved in the occurrence and development of HCC requires investigation. The present study aimed to clarify the role of miR-223-3p in HCC tumorigenesis. The use of high-throughput data, including microarray and RNA-sequencing, and bioinformatics may provide novel insights into how miR-223-3p functions in HCC, and to provide a theoretical foundation for the diagnosis and personalized therapy of patients with HCC.
Materials and methods
Clinical significance: GEO database
Mining expression profiles from microarrays
The HCC microarray profiles were obtained from the National Center for Biotechnology Information GEO (http://www.ncbi.nlm.nih.gov/geo/) based on the following search strategy: ‘(miR or microRNA or miRNA) and (malignan* or cancer or tumor or tumour or neoplas* or carcinoma) and (hepatocellular or liver or hepatic OR HCC)’. The search included all terms that begin with a word by entering the word followed by an asterisk (*), the wildcard character. Data including the expression level of miR-223-3p in human HCC and in non-cancerous controls were collected.
Manufacturing receiver operating curve (ROC) and scatter plots of the expression of miR-223-3p
Based on the expression level of miR-223-3p, ROC and scatter plots were separately produced in GraphPad Prism 6.0 (GraphPad Software, Inc., La Jolla, CA, USA). The sensitivity and specificity of miR-223-3p in HCC were also evaluated for meta-analysis.
Statistical analysis
SPSS software (version 22.0; IBM Corp., Armonk, NY, USA) was used to conduct statistical analysis. The expression profiles from the GEO were normalized by log2-transformation. The expression of miR-223-3p was calculated as the mean ± standard deviation. An independent Student's t-test was performed to calculate the difference between HCC cases and non-cancerous tissues. P<0.05 was considered to indicate a statistically significant difference.
Clinical significance: TCGA database
TCGA data
To further clarify the correlations between the precursor miR-223 and HCC, the reads per million (RPM) miRNA mapped data of miR-223 in 375 HCC and 50 non-cancerous liver tissues were scanned and extracted from the TCGA database (http://cancergenome.nih.gov). Additionally, the raw mRNA count (level 3) and the corresponding clinical information of the 375 patients with HCC were obtained.
Analyzing the clinical features of miR-223
For determining the miR-223-expressing conditions in the different clinicopathological features of HCC, scatter plots were constructed. The Kaplan-Meier curve was used to examine the prognostic value of miR-223 in HCC.
Statistical analysis
The mRNA expression level values were normalized by conversion to a log2 scale using the edgeR package of R software (version 3.5; http://www.bioconductor.org/packages/release/bioc/html/edgeR.html), in addition to the RPM data. The mRNAs with an absolute log2-fold change >2 were identified as differentially expressed. The differences in the levels of miR-223 between various clinical features were assessed using an independent Student's t-test. P<0.05 was considered to indicate a statistically significant difference.
Identification of diagnostic accuracy from eligible studies
A literature search (up to 09/05/2017) was performed using the following databases: PubMed (https://www.ncbi.nlm.nih.gov/pubmed), EBSCO (https://www.ebsco.com), Wiley Online Library (http://onlinelibrary.wiley.com), Web of Science (http://isiknowledge.com), Science Direct (http://www.sciencedirect.com), Cochrane Central Register of Controlled Trials (http://www.cochranelibrary.com), Google Scholar (https://scholar.google.com), EMBASE (https://www.embase.com), Ovid (http://ovidsp.ovid.com) and LILACS (http://lilacs.bvsalud.org), in addition to the following Chinese databases: Chinese CNKI (http://www.cnki.net), Chinese Chong Qing VIP (http://lib.cqvip.com), Chinese Wan Fang (http://www.wanfangdata.com.cn) and China Biology Medicine disc (http://www.sinomed.ac.cn). The search strategy was as follows ‘(miR-223 or miRNA-223 or microRNA-223 or miR223 or miRNA223 or microRNA223 or miR 223 or miRNA 223 or microRNA 223 or miR-223 or miRNA-223-3p or microRNA-223-3p) and (malignan* or cancer or tumor or tumour or neoplasm*, or carcinoma) and (hepatocellular or liver or hepatic or HCC). The inclusion criteria were as follows: i) Studies evaluating the diagnostic value of downregulated miR-223-3p (or miR-223) in serum, plasma or HCC tissues; ii) studies providing sufficient information for calculating the sensitivity and specificity of miR-223-3p (or miR-223) for diagnosing HCC; and iii) studies published in English or Chinese. For eligible studies with data published more than once, those with the largest patient sample size were included. In addition, the following exclusion criteria were used: i) Studies detecting miR-223-3p (or miR-223) in cell lines or animals; ii) results published as an abstract, summary, case report, comment letter, review or editorial; and iii) studies without sufficient data for evaluating the diagnostic value of miR-223-3p (or miR-223) in human HCC.
The quality assessment of literature was performed independently by two authors (Ms. Li-jie Zhang and Ms. Mei-Ling Yang) using the Quality Assessment of Diagnostic Accuracy Studies (QUADAS)-2 Tool (www.bris.ac.uk/quadas). A discussion of consistency was applied when divergence appeared. QUADAS-2 was used to judge bias and applicability between ‘high’ and ‘low’ risks, which consisted of patient selection, index test, reference standard, and flow and timing (47).
Meta-analysis
Stata (version 12.0; StataCorp, College Station, TX, USA) to conduct the meta-analysis. The ‘midas’ module of Stata 12.0 (StataCorp LP, College Station, TX, USA) was used to combine the diagnostic data from GEO, TCGA and the literature. The heterogeneity was calculated using a χ2 test and I2, and I2>50% or/and P<0.05 for the Q test were considered to be statistically significant in heterogeneity. The fixed-effect model was used if there was significant heterogeneity. Otherwise, the random effect model was used (48). The summarized indices included sensitivity, specificity, likelihood ratio and diagnostic odds ratio with a 95% confidence interval (CI). Based on the sensitivity and specificity, a summary receiver operating characteristic curve (SROC) was used for evaluation. Publication bias was measured by plotting Deek's funnel plot (49). P<0.05 (two-sided) was considered to indicate a statistically significant difference
Bioinformatics evaluation
Selection of potential target genes. The targets of miR-223-3p were selected from the intersection of 13 prediction tools, natural language processing (NLP) of HCC, and differentially expressed genes from TCGA. A total of 12 online tools were used for predicting potential targets: miRWalk (http://zmf.umm.uni-heidelberg.de/apps/zmf/mirwalk2), Micro T4 (http://diana.imis.athena-innovation.gr/DianaTools/index.php?r=microtv4/index), miRanda (http://www.microrna.org/microrna/getDownloads.do), miRBridge (https://www.ncbi.nlm.nih.gov/pubmed/?term=20385095), miRDB (http://mirdb.org/miRDB/download.html), miRMap (http://mirmap.ezlab.org/downloads/mirmap201301e/), miRNAMap (ftp://mirnamap.mbc.nctu.edu.tw/miRNAMap2), PICTAR2 (http://dorina.mdc-berlin.de/rbp_browser/download_hg19.html), PITA (https://genie.weizmann.ac.il/pubs/mir07/mir07_exe.html), RNA22 (https://cm.jefferson.edu/rna22/), RNAhybrid (https://bibiserv.cebitec.uni-bielefeld.de/rnahybrid/dl_pre-page.html), and TargetScan (http://www.targetscan.org/cgi-bin/targetscan/data_download.cgi?db=vert_61). The genes found to overlap on at least three prediction programs were identified as targets. The predicted targets of miR-223-3p in the miTarBase program were confirmed using western blot analysis and quantitative polymerase chain reaction reporter assays. Genes expressed aberrantly in HCC in studies published between 01/01/1980 and 05/25/2015 were gathered with NLP techniques, as described in our previous study (50). Additionally, the extracted genes were added to a list using ABNER (http://pages.cs.wisc.edu/~bsettles/abner/) (51). The correlations between hub genes and miR-223-3p were assessed using Spearman's correlation.
Prospective mechanisms and functions
The molecular mechanisms and biological functions of potential miR-223-3p targets in HCC were identified by enrichment analysis and pathway annotations. Gene Ontology (GO) analysis and the Kyoto Encyclopedia of Genes and Genomes (KEGG) pathways analysis were performed using the Database for Annotation, Visualization and Integrated Discovery (DAVID; https://david.ncifcrf.gov/). P<0.05 was considered to indicate a significant pathway. GO associations were also visualized in Cytoscape (version 3.4.0; http://www.cytoscape.org/).
Protein-protein interaction (PPI) network construction
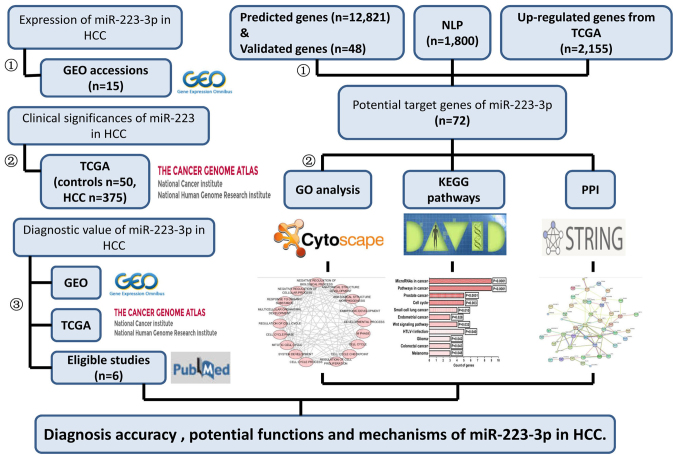
The potential targets were mapped to the Search Tool for the Retrieval of Interacting Genes database (http://www.string-db.org/) (52) to evaluate significant correlations between different protein pairs. The overall design of the present study is shown in the flow chart in Fig. 1.
Figure 1.
Flow chart of the method used in the present study. HCC, hepatocellular carcinoma; GEO, Gene Expression Omnibus; miR, microRNA; TCGA, The Cancer Geneome Atlas; GO, Gene Ontology; NLP, natural language processing; KEGG, Kyoto Encyclopedia of Genes and Genomes; PPI, protein-protein interaction.
Results
Expression of miR-223-3p in HCC in GEO
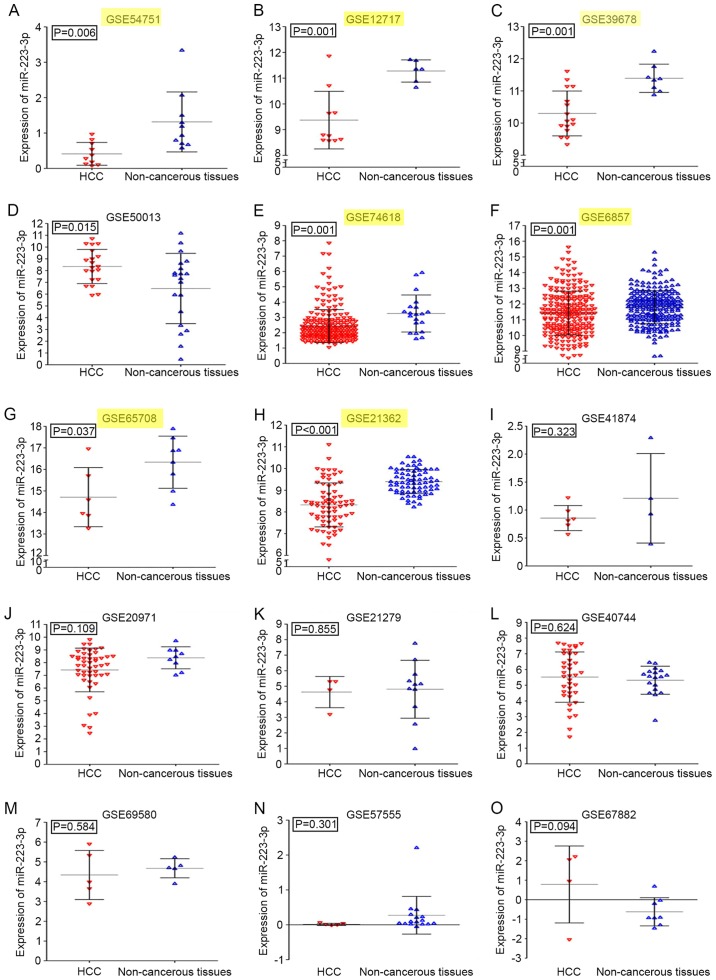
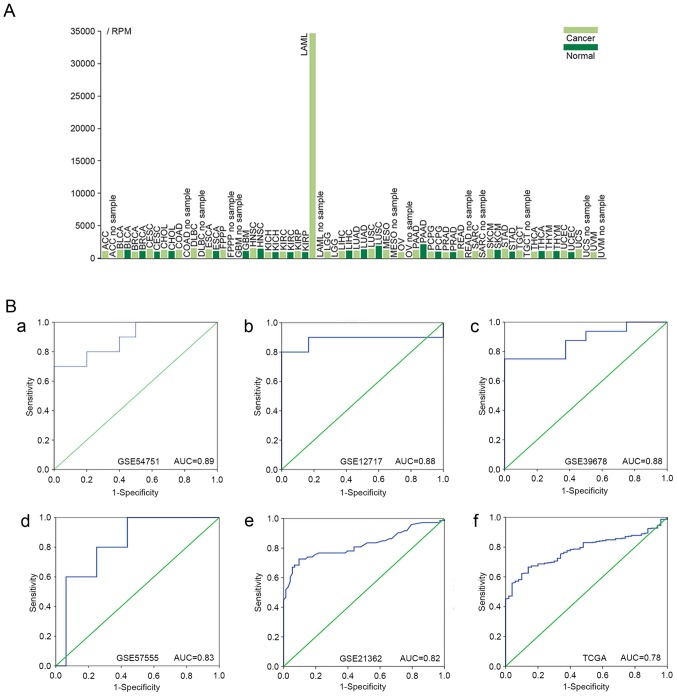
A total of 15 series (GSE) in the GEO database were extracted for the present study, which consisted of 706 HCC samples and 457 normal controls. In addition to GSE21279, detecting the expression level of the precursor miR-223, the other 14 GEO accessions were all identified as miR-223-3p expression profiles. Detailed information regarding each GEO accession is shown in Table I. The expression level of miR-223-3p was significantly downregulated in patients with HCC in seven of the 15 GEO datasets (Fig. 2A-O). Compared with the non-cancerous controls, the miR-223-3p HCC expression profiles were significantly downregulated in GSE54751, GSE12717, GSE39678, GSE74618, GSE6857, GSE65708 and GSE21362 (P<0.05). By contrast, the expression level of miR-223-3p in GSE50013 was upregulated in HCC groups (P=0.015). The levels of miR-223-3p were also obtained based on TCGA expression profiles. In liver HCC, the levels of miR-223-3p in cancer tissues were also lower, compared with those in the normal controls (Fig. 3A).
Table I.
Fifteen gene expression omnibus series datasets of HCC.
| HCC | Non-cancerous | ||||
|---|---|---|---|---|---|
| ID | n | Mean ± SD | n | Mean ± SD | P-value |
| GSE57555 | 5 | 0.013±0.032 | 16 | 0.275±0.540 | 0.300 |
| GSE69580 | 5 | 4.337±1.241 | 5 | 4.677±0.483 | 0.951 |
| GSE54751 | 10 | 0.412±0.323 | 10 | 1.314±0.848 | 0.006 |
| GSE41874 | 6 | 0.855±0.224 | 4 | 1.209±0.800 | 0.323 |
| GSE50013 | 20 | 8.342±1.452 | 20 | 6.460±2.979 | 0.017 |
| GSE40744 | 39 | 5.518±1.600 | 18 | 5.318±0.891 | 0.549 |
| GSE20971 | 49 | 7.424±1.716 | 9 | 8.383±0.866 | 0.108 |
| GSE21362 | 73 | 8.324±1.013 | 73 | 9.396±0.553 | <0.001 |
| GSE12717 | 10 | 9.370±1.118 | 6 | 11.279±0.432 | 0.001 |
| GSE6857 | 241 | 11.417±1.396 | 241 | 11.802±1.054 | 0.006 |
| GSE67882 | 4 | 0.783±1.976 | 8 | −0.621±0.724 | 0.094 |
| GSE65708 | 6 | 14.711±1.372 | 8 | 16.335±1.210 | 0.037 |
| GSE74618 | 218 | 2.434±1.074 | 20 | 3.254±1.211 | 0.001 |
| GSE39678 | 16 | 10.300±0.697 | 8 | 11.393±0.440 | 0.001 |
| GSE21279 | 4 | 4.624±1.001 | 11 | 4.809±1.862 | 0.855 |
SD, standard deviation.
Figure 2.
Expression levels of miR-223-3p in HCC tumor samples from the GEO. Labels in yellow represent significant downregulation of miR-223-3p in HCC tissues in seven cohorts. (A) GSE54751; (B) GSE12717; (C) GSE39678; (D) GSE50013; (E) GSE74618; (F) GSE6857; (G) GSE65708; (H) GSE21362; (I) GSE41874; (J) GSE20971; (K) GSE21279; (L) GSE40744; (M) GSE69580; (N) GSE57555; (O) GSE67882. GEO, Gene Expression Omnibus; HCC, hepatocellular carcinoma; miR, microRNA.
Figure 3.
Expression profiles. (A) TCGA expression profiles of miR-223-3p in different diseases. The light green bars represent cancer tissues. The dark green bars represent normal tissues. ACC, adenoid cystic carcinoma; BLCA, bladder urothelial carcinoma; BRCA, breast invasive carcinoma; CESC, cervical squamous cell carcinoma and endocervical adenocarcinoma; CHOL, cholangiocarcinoma; COAD, colon adenocarcinoma; DLBC, diffuse large B-cell lymphoma; ESCA, esophageal carcinoma; FPPP, Formalin-fixed Paraffin Pilot Project; GBM, glioblastoma multiforme; HNSC, head and neck squamous cell carcinoma; KICH, chromophobe renal cell carcinoma; KIRC, kidney renal clear cell carcinoma; KIRP, kidney renal papillary cell carcinoma; LAML, acute myeloid leukemia; LGG, brain lower grade glioma; LIHC, liver hepatocellular carcinoma; LUAD, lung adenocarcinoma; LUSC, lung squamous cell carcinoma; MESO, mesothelioma; OV, ovarian serous cystadenocarcinoma; PAAD, pancreatic adenocarcinoma; PCPG, pheochromocytoma and paraganglioma; PRAD, prostate adenocarcinoma; READ, rectum adenocarcinoma; SARC, sarcoma; SKCM, skin cutaneous melanoma; STAD, stomach adenocarcinoma; TGCT, testicular germ cell cancer; THCA, papillary thyroid carcinoma; THYM, thymoma; UCEC, uterine corpus endometrial carcinoma; UCS, uterine carcinosarcoma; UVM, uveal melanoma; TCGA, The Cancer Genome Atlas; RPM, reads per million. (B) miR-223-3p ROC curves in GEO and TCGA datasets. (a) ROC of GSE54751; (b) ROC of GSE12717; (c) ROC of GSE39678; (d) ROC of GSE57555; (e) ROC of GSE21362; (f) ROC of TCGA dataset. ROC, receiver operating characteristic; GEO, Gene Expression Omnibus; TCGA, The Cancer Genome Atlas.
The ROC analysis revealed a significant diagnostic value of miR-223-3p for HCC. Of the 15 GEO profiles, five with an AUC >0.80 are shown in Fig. 3B-a-e (P<0.05).
Expression of miR-223 in HCC in TCGA
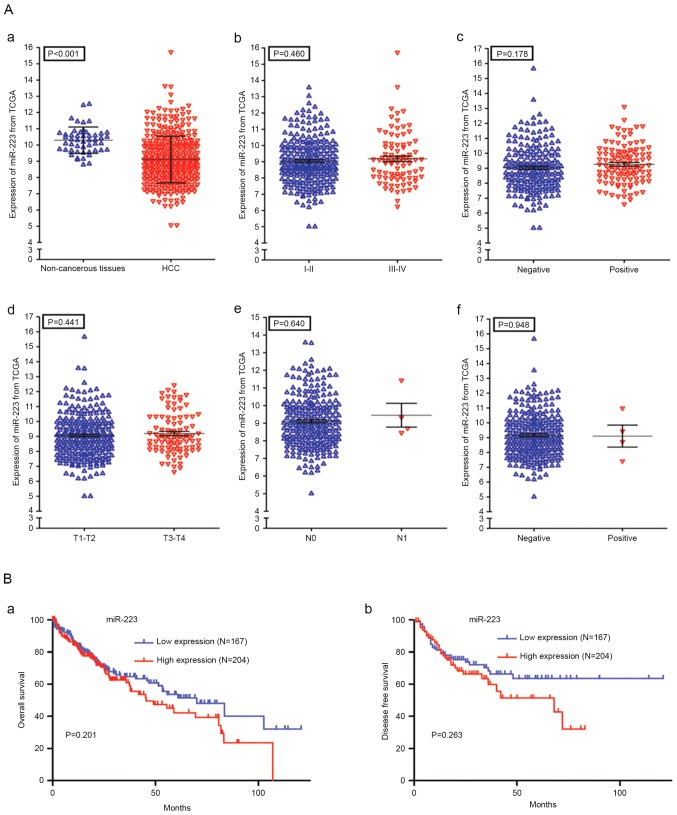
A total of 371 patients with HCC (252 men and 119 women) and 50 normal controls were derived from the TCGA dataset. The results from the ROC analysis for TCGA RNA-seq data are shown in Fig. 3B-f (AUC, 0.78; 95% CI, 0.74–0.83; P<0.001). Additionally, the present study analyzed the associations between the level of miR-223 and the clinical features of patients with HCC. As is shown in Fig. 4A-a, there was a significant difference in the expression of miR-223 between the HCC tissues (9.112±1.436) and healthy controls (10.300±0.811; P<0.001). However, no statistically significant correlations were found between the level of miR-223 and various clinicopathological features of the patients with HCC (Fig. 4A-b-f; Table II). The effect of the expression of miR-223 on survival outcomes in HCC was also insignificant (P=0.201 for overall survival, P=0.263 for disease free survival; Fig. 4B).
Figure 4.
Expression level of miR-223 is not significantly correlated with various clinicopathological features of patients with HCC. (A) Expression level of miR-233 in different (a) tissue types in TCGA dataset, (b) stages of HCC, (c) vaso-invasion, (d) size or direct extent of the primary tumor, (e) degree of spread to regional lymph nodes, and (f) presence of distant metastasis. (B) Kaplan-Meier plots of (a) overall survival (months) and (b) disease free survival (months). HCC, hepatocellular carcinoma; miR, microRNA; TCGA, The Cancer Genome Atlas.
Table II.
Association between levels of microRNA-223 and clinicopathological variables in patients with HCC from The Cancer Genome Atlas database.
| Parameter | n | Mean ± SD | T-value | P-value |
|---|---|---|---|---|
| Group | <0.001 | |||
| HCC | 371 | 9.112±1.436 | 8.659 | |
| Normal | 50 | 10.300±0.811 | ||
| Sex | 0.736 | |||
| Male | 252 | 9.095±1.426 | 0.337 | |
| Female | 119 | 9.149±1.462 | ||
| Tumor status | 0.625 | |||
| Tumor present | 111 | 9.116±1.531 | 0.489 | |
| Tumor-free | 233 | 9.037±1.327 | ||
| Family history | 0.174 | |||
| + | 110 | 9.284±1.479 | 1.361 | |
| − | 210 | 9.053±1.427 | ||
| Risk factors | 0.734 | |||
| + | 251 | 9.092±1.435 | 0.339 | |
| − | 101 | 9.149±1.435 | ||
| Other malignancy | 0.485 | |||
| + | 36 | 9.271±1.446 | 0.700 | |
| − | 335 | 9.095±1.436 | ||
| Inflammation | 0.749 | |||
| + | 117 | 9.060±1.418 | 0.321 | |
| − | 118 | 9.000±1.483 | ||
| Ethnicity | 0.650 | |||
| Hispanic or Latino | 18 | 9.297±1.844 | 0.461 | |
| Non-Hispanic or Latino | 334 | 9.094±1.418 | ||
| T stage | 0.981 | |||
| G I–II | 275 | 9.105±1.295 | 0.024 | |
| G III–IV | 93 | 9.109±1.812 | ||
| N stage | 0.894 | |||
| N1 | 4 | 9.190±1.300 | 0.133 | |
| NX-N0 | 254 | 9.093±1.446 | ||
| M stage | 0.286 | |||
| M1 | 4 | 8.324±0.844 | 1.069 | |
| MX-M0 | 269 | 9.087±1.423 | ||
| Pathologic stage | 0.913 | |||
| Stage I–II | 260 | 9.084±1.296 | 0.110 | |
| Stage III–IV | 87 | 9.108±1.875 | ||
| Vascular invasion | 0.214 | |||
| + | 110 | 9.227±1.635 | 1.247 | |
| − | 206 | 9.002±1.298 |
HCC, hepatocellular carcinoma; T stage, size or direct extent of the primary tumor; N stage, degree of spread to regional lymph nodes; M stage, presence of distant metastasis; SD, standard deviation.
Inclusion of previous literature and quality assessment
A total of 295 relevant studies were identified in the literature search, and 100 were excluded due to duplicated publications. In total, three publications, comprising six studies with sufficient data, were eventually considered to be eligible for analysis in the present study. The detailed characteristics are shown in Table III. The results of the quality assessment of the literature are shown in Table IV.
Table III.
Characteristics of included studies.
| Author/source, year | Country | Male/female | Sample type | Type of control | Detecting method | (Refs.) |
|---|---|---|---|---|---|---|
| Khairy et al, 2016 | Egypt | 59/19 | Serum | CLD | RT-PCR | (53) |
| Bhattacharya et al, 2016 | USA | 42/14 | Serum | CLD | RT-PCR | (37) |
| Bhattacharya et al, 2016 | USA | 39/14 | Serum | Normal | RT-PCR | (37) |
| Duo et al, 2015 | China | 80/40 | Serum | Normal | RT-PCR | (54) |
| Duo et al, 2015 | China | 82/38 | Serum | CLD | RT-PCR | (54) |
| Duo et al, 2015 | China | 93/57 | Serum | Unclear | RT-PCR | (54) |
| GSE12717, 2008 | USA | NA | Tissue | Unclear | SO | – |
| GSE20971, 2011 | France | NA | Tissue | Normal | SO | – |
| GSE21279, 2010 | China | NA | Tissue | CLD | HTS | – |
| GSE21362, 2011 | Japan | NA | Tissue | Unclear | SO | – |
| GSE39678, 2012 | South Korea | NA | Tissue | Normal | SO | – |
| GSE41874, 2013 | Japan | NA | Tissue | Unclear | SO | – |
| GSE54751, 2014 | USA | NA | Tissue | Unclear | RT-PCR | – |
| GSE57555, 2015 | Japan | NA | Tissue | Unclear | ISO | – |
| GSE65708, 2016 | China | NA | Serum | CLD | RT-PCR | – |
| GSE6857, 2008 | USA | NA | Tissue | Unclear | SO | – |
| GSE69580, 2015 | Taiwan | NA | Tissue | CLD | ISO | – |
| GSE74618, 2016 | Spain | NA | Tissue | Unclear | ISO | – |
| TCGA, 2016 | NR | NA | Tissue | Normal | HTS | – |
RT-PCR, reverse transcription-polymerase chain reaction; CLD, chronic liver disease; ISO, in situ oligonucleotide; SO, spotted oligonucleotide; HTS, high throughput sequencing; TCHA, The Cancer Genome Atlas; NA, not applicable.
Table IV.
Quality assessment of diagnostic accuracy studies.
| Risk of bias | Applicability concerns | |||||||
|---|---|---|---|---|---|---|---|---|
| Author, year | Patient | Index | Reference | Flow and timing | Patient | Index | Reference | (Refs.) |
| Khairy et al, 2016 | Unclear | High | Low | Unclear | Unclear | Low | Unclear | (53) |
| Bhattacharya et al, 2016 | Unclear | Unclear | Low | Low | Unclear | Low | High | (37) |
| Duo et al, 2015 | Unclear | Unclear | Low | Unclear | Unclear | Low | High | (54) |
Meta-analysis for diagnostic value of miR-223-3p in HCC
Pooled diagnostic performance
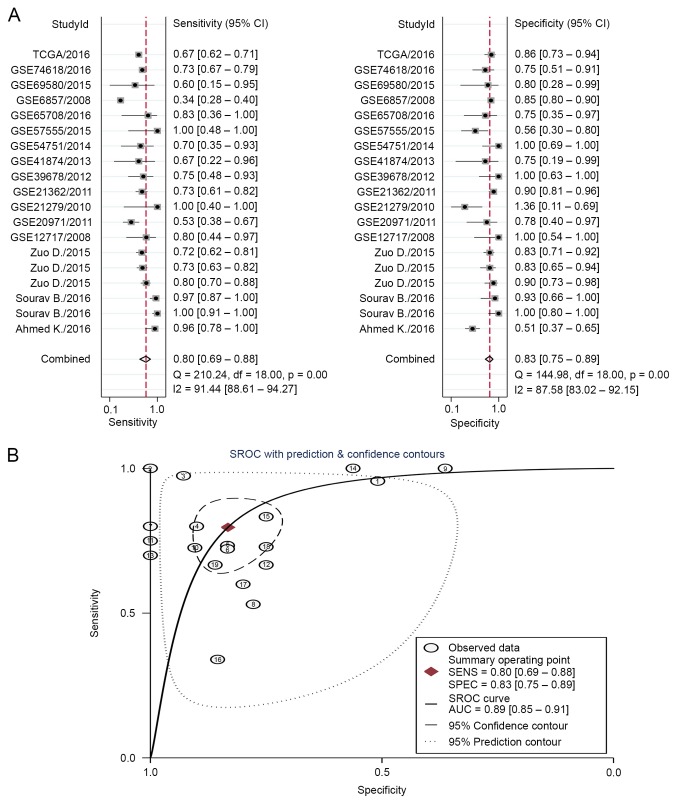
The diagnostic accuracy of miR-223-3p and miR-223 for HCC was pooled from 19 studies (Table V). The I2 value for the AUC was 0.97 (95% CI, 0.95–0.99), therefore, a random model was used in the following analysis. The overall pooled sensitivity was 0.80 with a 95% CI between 0.69 and 0.88, whereas the specificity was 0.83 with a 95% CI between 0.75 and 0.89 (Fig. 5A). The positive and negative likelihood ratios were 4.8 (95% CI, 3.1–7.2) and 0.24 (95% CI, 0.15–0.39), respectively. Overall, the diagnostic odds ratio was 19 (95% CI, 10.0–39.0). The diagnostic accuracy was further evaluated by plotting the SROC, and by calculating the AUC, which was 0.89 (95% CI, 0.85–0.91), indicating a high diagnostic accuracy in distinguishing patients with HCC from healthy controls (Fig. 5B).
Table V.
Diagnostic value of mcroiRNA-223 in 19 individual studies.
| ID | Author/source, year | HCC (n) | Controls (n) | AUC | Sensitivity | Specificity | TP (n) | FP (n) | FN (n) | TN (n) | (Refs.) |
|---|---|---|---|---|---|---|---|---|---|---|---|
| 1 | Khairy et al, 2016 | 23 | 55 | 0.680 | 0.960 | 0.509 | 22 | 27 | 1 | 28 | (53) |
| 2 | Bhattacharya et al, 2016 | 39 | 17 | 0.997 | 0.972 | 0.941 | 39 | 0 | 0 | 17 | (37) |
| 3 | Bhattacharya et al, 2016 | 39 | 14 | 1.000 | 1.000 | 1.000 | 38 | 1 | 1 | 13 | (37) |
| 4 | Duo et al, 2015 | 90 | 30 | NA | 0.800 | 0.900 | 72 | 3 | 18 | 27 | (54) |
| 5 | Duo et al, 2015 | 90 | 30 | NA | 0.730 | 0.833 | 66 | 5 | 24 | 25 | (54) |
| 6 | Duo et al, 2015 | 90 | 60 | NA | 0.719 | 0.833 | 65 | 10 | 25 | 50 | (54) |
| 7 | GSE12717, 2008 | 10 | 6 | 0.883 | 0.800 | 1.000 | 8 | 0 | 2 | 6 | – |
| 8 | GSE20971, 2011 | 49 | 9 | 0.673 | 0.531 | 0.778 | 26 | 2 | 23 | 7 | – |
| 9 | GSE21279, 2010 | 4 | 11 | 0.568 | 1.000 | 0.364 | 4 | 7 | 0 | 4 | – |
| 10 | GSE21362, 2011 | 73 | 73 | 0.824 | 0.726 | 0.904 | 53 | 7 | 20 | 66 | – |
| 11 | GSE39678, 2012 | 16 | 8 | 0.875 | 0.750 | 1.000 | 12 | 0 | 4 | 8 | – |
| 12 | GSE41874, 2013 | 6 | 4 | 0.625 | 0.667 | 0.750 | 4 | 1 | 2 | 3 | – |
| 13 | GSE54751, 2014 | 10 | 10 | 0.890 | 0.700 | 1.000 | 7 | 0 | 3 | 10 | – |
| 14 | GSE57555, 2015 | 5 | 16 | 0.825 | 1.000 | 0.562 | 5 | 7 | 0 | 9 | – |
| 15 | GSE65708, 2016 | 6 | 8 | 0.813 | 0.833 | 0.750 | 5 | 2 | 1 | 6 | – |
| 16 | GSE6857, 2008 | 241 | 241 | 0.597 | 0.340 | 0.855 | 82 | 35 | 159 | 206 | – |
| 17 | GSE69580, 2015 | 5 | 5 | 0.560 | 0.600 | 0.800 | 3 | 1 | 2 | 4 | – |
| 18 | GSE74618, 2016 | 218 | 20 | 0.731 | 0.729 | 0.750 | 159 | 5 | 59 | 15 | – |
| 19 | TCGA, 2016 | 375 | 50 | 0.782 | 0.667 | 0.860 | 250 | 7 | 125 | 43 | – |
HCC, hepatocellular carcinoma; AUC, area under the curve; TP, true positive; FP, false positive; TN, true negative; FN, false negative; NA, not applicable.
Figure 5.
(A) Forest plot of sensitivities and specificities from the test accuracy of circulating miR-223-3p in the diagnosis of HCC; (B) SROC curves for miR-223-3p in the diagnosis of HCC. The identity of cases shown in correspond to those listed in Table V in order. HCC, hepatocellular carcinoma; miR, microRNA; SROC, summary receiver operating characteristic; AUC, area under the curve; SENS, sensitivity; SPEC, specificity.
Univariate regression and subgroup analysis
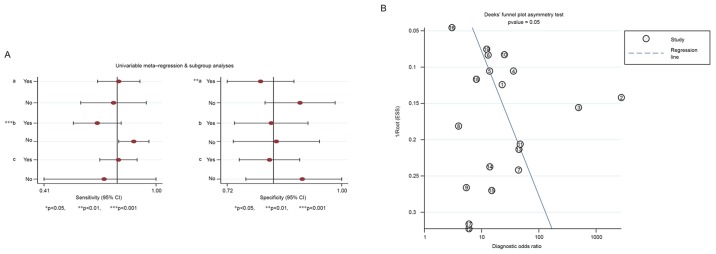
As the threshold effect accounted for only 5% of the heterogeneity across a total of 19 studies, univariate regression and subgroup analysis was used to further investigate the sources of heterogeneity. The sample type (serum or tissues) and histological type for the controls may contribute to heterogeneity. The sample type was ultimately revealed to be a statistically significant source of heterogeneity (P<0.001; Fig. 6A).
Figure 6.
(A) Forest plots for univariable meta-regression and subgroup analyses for sensitivity and specificity. (B) Funnel plot for the assessment of potential publication bias in miR-223-3p assays. The cases shown correspond to those listed in Table V in order. miR, microRNA.
Publication bias
Publication bias in the present study was determined using Deek's funnel plot, and the P-value (P=0.054), indicated no statistical significance in publication bias (Fig. 6B).
Potential mechanisms and functions of miR-223-3p in HCC
Potential target genes of miR-223-3p
Based on the 12 online predictive tools mentioned above, a total of 12,821 genes, which appeared on three or more platforms, were screened, and 48 validated genes were obtained from miTarBase. In addition, 1,800 genes associated with HCC were identified from 64,577 studies in the processing of NLP, and 2,155 upregulated genes in HCC were identified from TCGA in the present study. Finally, 72 genes, which intersected in the three aforementioned methods, were included in further analysis.
Pathway annotation of KEGG
From the KEGG pathway annotation, a total of 11 pathways were identified (listed in Table VI). The pathways with significantly different gene counts are shown in Fig. 7 (P<0.05). The highest degree of significance was in ‘microRNAs in cancer’ (P<0.001). The genes DNA methyltransferase 1 (DNMT1), kinesin family member 23 (KIF23), STMN1 and others are involved in this pathway. Additionally, several potential target genes were closely associated with KEGG pathways, including the terms ‘pathways in cancer’ (P<0.001), ‘prostate cancer’ (P<0.001) and ‘cell cycle’ (P=0.003).
Table VI.
Biological pathways enriched in KEGG of HCC.
| KEGG pathway | Genes | P-value | FDR-value |
|---|---|---|---|
| MicroRNAs in cancer | KIF23, E2F1, CCNE2, DNMT3A, PDGFRB, IGF2BP1, DNMT1, STMN1, HMGA2 | <0.001 | 0.037 |
| Pathways in cancer | E2F1, CCNE2, CDKN2B, ITGA6, PDGFRB, LEF1, BIRC5, EGF, AXIN2 | <0.001 | 0.634 |
| Prostate cancer | E2F1, CCNE2, PDGFRB, LEF1, EGF | <0.001 | 1.031 |
| Cell cycle | E2F1, CCNE2, CDKN2B, CHEK1, MCM6 | 0.003 | 3.661 |
| Small cell lung cancer | E2F1, CCNE2, CDKN2B, ITGA6 | 0.010 | 10.687 |
| Endometrial cancer | LEF1, EGF, AXIN2 | 0.028 | 26.228 |
| Wnt signaling pathway | DKK1, SFRP4, LEF1, AXIN2 | 0.032 | 29.532 |
| HTLV–I infection | E2F1, CDKN2B, PDGFRB, CHEK1, TCF3 | 0.040 | 35.953 |
| Glioma | E2F1, PDGFRB, EGF | 0.042 | 36.973 |
| Colorectal cancer | LEF1, BIRC5, AXIN2 | 0.043 | 37.802 |
| Melanoma | E2F1, PDGFRB, EGF | 0.048 | 41.102 |
KEGG, Kyoto Encyclopedia of Genes and Genomes; FDR, false discovery rate.
Figure 7.
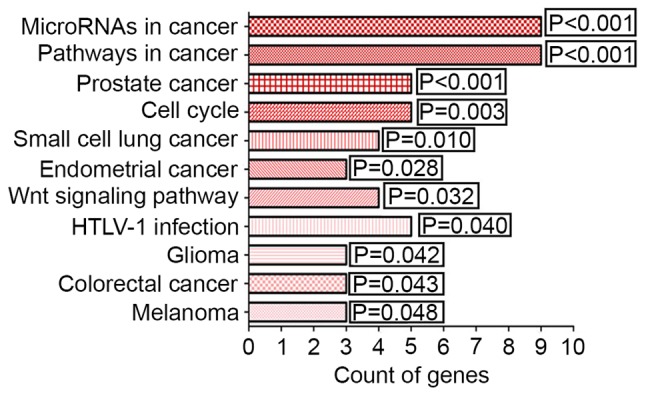
Eleven significant KEGG pathways for miR-223-3p targets in hepatocellular carcinoma. miR, microRNA; KEGG, Kyoto Encyclopedia of Genes and Genomes.
Biological functional analysis of GO
A total of 43 significant GO categories were screened out using DAVID, including 29 biological processes (BPs), nine cellular components (CCs) and five molecular functions (MFs). The top 10 significant analyses of BPs are shown in Table VII, in addition to the nine CCs and five MFs (P<0.05). The results showed that, in the BP category, potential targets of miR-223-3p were concentrated predominantly on the terms ‘mitotic cytokinesis’ (P<0.001), ‘positive regulation of cytokinesis’ (P<0.001) and ‘negative regulation of transcription from RNA polymerase II promoter’ (P=0.003; Fig. 8). For the CCs, the target genes were predominantly enriched in the terms ‘centralspindlin complex’ (P<0.001), ‘microtubule’ (P=0.001) and ‘midbody’ (P=0.006; Fig. 9). In the MF category ATP binding’ was the most enriched term (P=0.003), followed by ‘chromatin binding’ (P=0.008) and ‘armadillo repeat domain binding’ (P=0.02; Fig. 10).
Table VII.
Top GO terms significantly enriched with high potential target gene count.
| Category | Term | Genes | P-value | FDR-value |
|---|---|---|---|---|
| GOTERM_BP_DIRECT | GO:0000281-mitotic cytokinesis | KIF23, CKAP2, STMN1, RACGAP1 | <0.001 | 0.303 |
| GOTERM_BP_DIRECT | GO:0032467-positive regulation of cytokinesis | KIF23, KIF14, RACGAP1, ECT2 | <0.001 | 0.537 |
| GOTERM_BP_DIRECT | GO:0000122-negative regulation of transcription from RNA polymerase II promoter | SHOX2, E2F1, DNMT3A, DKK1, SIX1, LEF1, WHSC1, SOX9 | 0.003 | 3.933 |
| GOTERM_BP_DIRECT | GO:0034504-protein localization to nucleus | SIX1, COL1A1, SOX9 | 0.007 | 9.137 |
| GOTERM_BP_DIRECT | GO:0060325-face morphogenesis | DKK1, LEF1, COL1A1 | 0.007 | 9.833 |
| GOTERM_BP_DIRECT | GO:0030326-embryonic limb morphogenesis | FRAS1, DKK1, LEF1 | 0.008 | 11.281 |
| GOTERM_BP_DIRECT | GO:0030199-collagen fibril organization | COL1A1, LOX, MMP11 | 0.008 | 11.281 |
| GOTERM_BP_DIRECT | GO:0010718-positive regulation of epithelial to mesenchymal transition | LEF1, COL1A1, AXIN2 | 0.008 | 11.281 |
| GOTERM_BP_DIRECT | GO:0001942-hair follicle development | DKK1, SOX9, LGR5 | 0.009 | 12.801 |
| GOTERM_BP_DIRECT | GO:0000915-actomyosin contractile ring assembly | KIF23, RACGAP1 | 0.010 | 13.331 |
| GOTERM_CC_DIRECT | GO:0097149-centralspindlin complex | KIF23, RACGAP1, ECT2 | <0.001 | 0.060 |
| GOTERM_CC_DIRECT | GO:0005874-microtubule | KIF23, KIF14, ARHGEF2, NDRG1, CCT3 | 0.001 | 1.397 |
| GOTERM_CC_DIRECT | GO:0030496-midbody | KIF23, KIF14, RACGAP1, ECT2 | 0.006 | 6.867 |
| GOTERM_CC_DIRECT | GO:0005813-centrosome | KIF23, CKAP2, DTL, CHEK1, NDRG1, AXIN2 | 0.010 | 10.162 |
| GOTERM_CC_DIRECT | GO:0005886-plasma membrane | KIF14, CCT3, MMP14, CDH12, DKK1, CNR1, SULF1, RGS5, SORT1, PDGFRB, NDRG1, EGF, AXIN2 | 0.019 | 19.542 |
| GOTERM_CC_DIRECT | GO:0005667-transcription factor complex | E2F1, SIX1, LEF1, TCF3 | 0.031 | 29.825 |
| GOTERM_CC_DIRECT | GO:0048471-perinuclear region of cytoplasm | NOX4, XRCC3, STC2, SORT1, NDRG1 | 0.044 | 39.035 |
| GOTERM_CC_DIRECT | GO:0005634-nucleus | E2F1, NOX4, CCNF, ATAD2, WHSC1, PBK, HMGA2, SOX9, ECT2, MCM6, CCNE2, SHOX2, GLUL, HEY1, SIX1, TXNRD1, NDRG1, TCF3 | 0.044 | 39.179 |
| GOTERM_CC_DIRECT | GO:0005654-nucleoplasm | KIF23, DNMT3A, XRCC3, CDKN2B, DTL, ATAD2, CHEK1, RACGAP1, AXIN2, SOX9, MCM6 | 0.044 | 39.550 |
| GOTERM_MF_DIRECT | GO:0005524-ATP binding | KIF23, KIF14, GLUL, XRCC3, MSH2, PFKFB2, ABCC4, PDGFRB, ATAD2, CHEK1, PBK, CCT3, MCM6 | 0.003 | 3.662 |
| GOTERM_MF_DIRECT | GO:0003682-chromatin binding | DNMT3A, SIX1, LEF1, ATAD2, WHSC1, SOX9 | 0.008 | 8.509 |
| GOTERM_MF_DIRECT | GO:0070016-armadillo repeat domain binding | LEF1, AXIN2 | 0.021 | 21.262 |
| GOTERM_MF_DIRECT | GO:0035326-enhancer binding | LEF1, SOX9 | 0.030 | 28.444 |
| GOTERM_MF_DIRECT | GO:0005096-GTPase activator activity | RGS5, RACGAP1, AXIN2, ECT2 | 0.039 | 35.353 |
FDR, false discovery rate; GO, Gene Ontology; BP, biological process; CC, cellular component; MF, molecular function.
Figure 8.
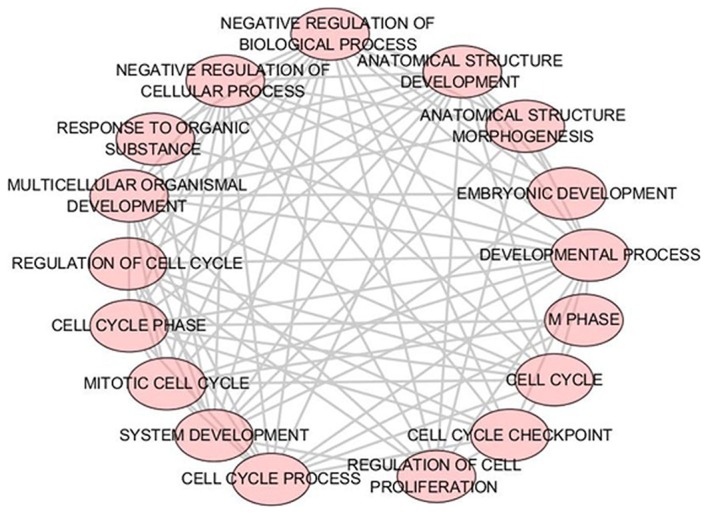
BP category enrichment analysis of potential targets of miR-223-3p. P<0.005 was selected as the significance threshold to ascertain the reliability of the results. Each node denotes a different BP. The lines represent interactions between several different BPs. miR, microRNA; BP, biological process.
Figure 9.
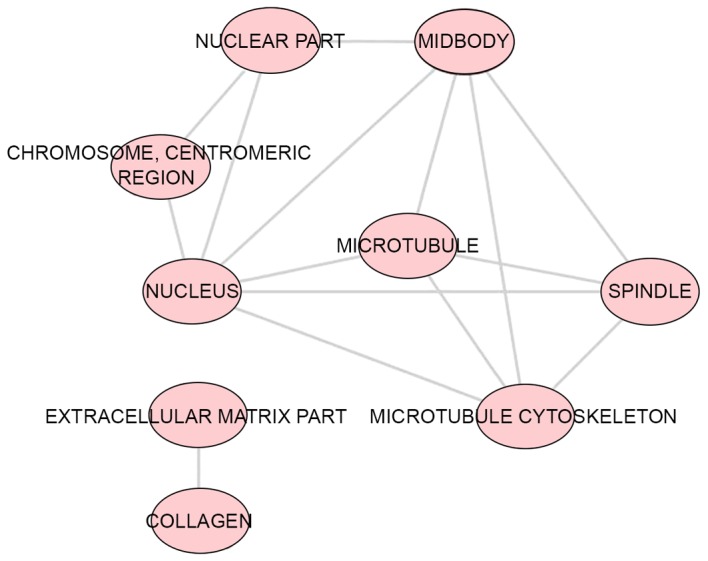
CC category enrichment analysis of potential targets of miR-223-3p. P<0.005 was selected as the significance threshold to ascertain the reliability of the results. Each node represents a different CC. The lines show interrelations between different CCs. miR, microRNA; CC, cellular component.
Figure 10.
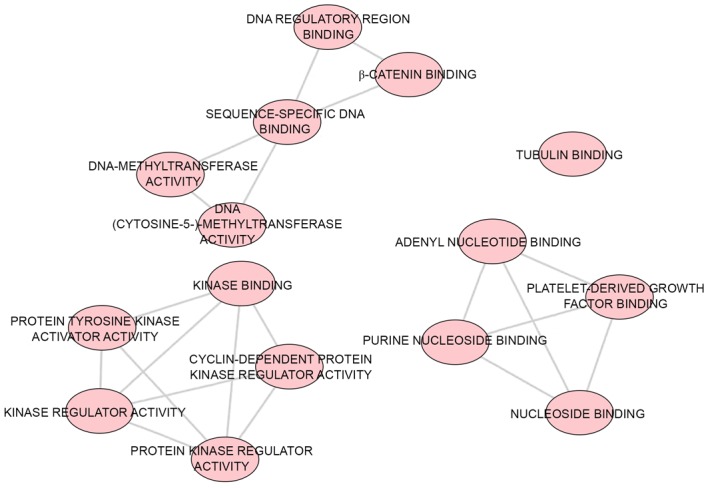
MF category enrichment analysis of potential targets of miR-223-3p. P<0.005 was selected as the significance threshold to ascertain the reliability of the results. Each node indicates a different MF. The lines reveal multiple associations between various MFs. miR, microRNA; MF, molecular function.
PPI network construction
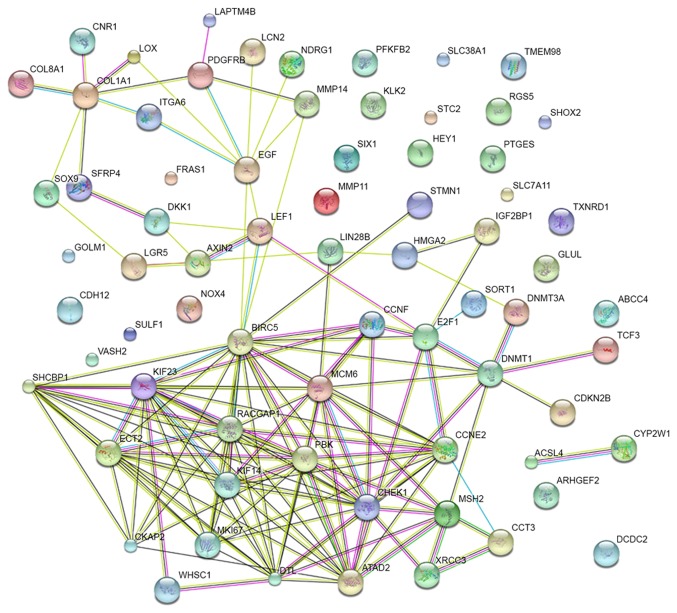
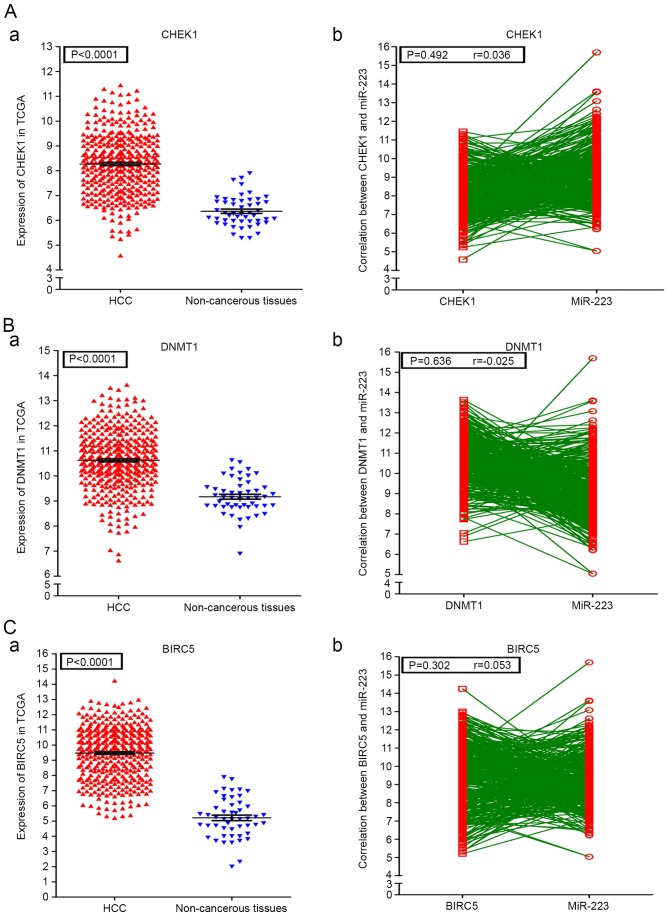
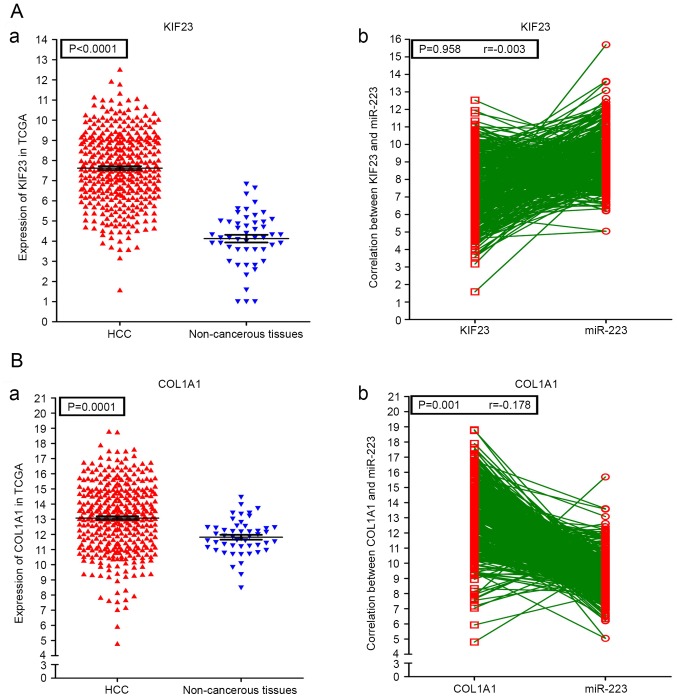
A PPI network of the 72 potential targets of miR-223-3p was mapped (Fig. 11). The 10 protein pairs with the highest combined scores are listed in Table VIII. The five genes, which interacted >5 times between different protein pairs were identified as the hub genes of miR-223-3p, including checkpoint kinase 1 (CHEK1), DNA methyltransferase 1 (DNMT1), baculoviral IAP repeat containing 5 (BIRC5), KIF23 and collagen, type I, α1 (COL1A1). In TCGA, compared with the normal controls, all five of these targets were significantly upregulated in HCC (P<0.05). Additionally, correlations of the hub genes and miR-223 were also shown in Figs. 12 and 13. High expression levels of the gene COL1A1 were significantly correlated with a lower level of miR-223 in HCC (P=0.001; Fig. 13B-b).
Figure 11.
Protein-protein interaction network of potential target genes of microRNA-223-3p. The nodes represent various predicted genes. The lines are interactions between nodes.
Table VIII.
Ten prominent protein-protein interaction nodes according to the Search Tool for the Retrieval of Interacting Genes.
| Node 1 | Node 2 | Co-expression | Experimentally determined interaction | Database annotated | Automated textmining | Combined score |
|---|---|---|---|---|---|---|
| DNMT1 | DNMT3A | 0 | 0.798 | 0.9 | 0.987 | 0.999 |
| RACGAP1 | ECT2 | 0.288 | 0.914 | 0.9 | 0.907 | 0.999 |
| RACGAP1 | KIF23 | 0.578 | 0.996 | 0.9 | 0.979 | 0.999 |
| KIF23 | ECT2 | 0.245 | 0.564 | 0.9 | 0.966 | 0.998 |
| E2F1 | CCNE2 | 0 | 0.363 | 0.9 | 0.735 | 0.981 |
| BIRC5 | KIF23 | 0.161 | 0 | 0.9 | 0.738 | 0.976 |
| AXIN2 | LEF1 | 0 | 0.110 | 0.9 | 0.751 | 0.976 |
| RACGAP1 | BIRC5 | 0.173 | 0 | 0.9 | 0.714 | 0.974 |
| CHEK1 | MCM6 | 0.093 | 0.207 | 0.9 | 0.562 | 0.964 |
| DNMT1 | E2F1 | 0.070 | 0.564 | 0.9 | 0.116 | 0.959 |
DNMT, DNA methyltransferase; RACGAP1, Rac GTPase-activating protein 1; KIF23, kinesin family member 23; BIRC5, baculoviral IAP repeat containing 5; CHEK1, checkpoint kinase 1; CCNE2, cyclin E2; LEF1, lymphoid enhancer-binding factor 1; MCM6, minichromosome maintenance complex component 6.
Figure 12.
Expression conditions of the 3 miR-223-3p hub genes in HCC and their correlations with miR-223. (A-a) Levels of CHEK1 in HCC tissues and healthy controls and (b) correlations between CHEK1 and miR-223. (B-a) Levels of DNMT1 in HCC tissues and non-cancerous controls and (b) correlations between DNMT1 and miR-223. (C-a) Levels of BIRC5 in HCC tissues and non-cancerous controls and (b) correlations between BIRC5 and miR-223. HCC, hepatocellular carcinoma; miR, microRNA; CHEK1, checkpoint kinase 1; DNMT1, DNA methyltransferase 1; BIRC5, baculoviral IAP repeat containing 5.
Fugure 13.
Expression conditions of the 2 miR-223-3p hub genes in HCC and their correlations with miR-223. (A-a) Levels of KIF23 in HCC tissues and non-cancerous controls and (b) correlations between KIF23 and miR-223. (B-a) Levels of COL1A1 in HCC tissues and non-cancerous controls and (b) correlations between COL1A1 and miR-223. HCC, hepatocellular carcinoma; miR, microRNA; KIF34, kinesin family member 23; COL1A1, collagen, type I, α1.
Discussion
The results of the present study indicated that miR-223-3p may be a tumor suppressor and a preferable diagnostic biomarker for HCC. A decreased frequency of miR-223-3p was shown in HCC samples in the GEO datasets, and the precursor miR-223 was downregulated in HCC samples in the TCGA database. The AUC of the SROC for miR-223-3p in diagnosing HCC was 0.89 (95% CI 0.85–0.91). From the PPI network, five potential targets were identified as the hub genes of miR-223-3p, including CHEK1, DNMT1, BIRC5, KIF23 and COL1A1.
Previous studies have found that miR-223-3p can act as an important novel biomarker for cancer screening in peripheral circulating blood and tissues. However, whether the miR-223-3p is downregulated in tumorigenesis or not remains controversial. The reduced expression of miR-223-3p in plasma may be a novel non-invasive detector in esophageal squamous cell carcinoma (33), and abnormalities in the expression of miR-223-3p in patients with HCC have enabled discrimination from normal controls. Compared with normal controls, the marked decrease in circulating miR-223-3p in HCC may serve as a biomarker (36,38,55,56). By contrast, in ovarian cancer tissues, miR-233-3p is expressed at high levels, particularly in recurrent cancer tissues (57). In gingival squamous cell carcinoma, significantly upregulated plasma levels of miR-223-3p have been identified as a diagnostic biomarker (58). miR-223-3p was also found to be at a higher level in the serum of patients with chronic hepatitis-related HCC (39). As reports on the expression of miR-223-3p in HCC have been controversial, the present study used GEO and TCGA datasets to perform a detailed analysis of the expression profiles of miR-223-3p or its processor miR-223 in HCC samples, compared with non-cancerous controls. A significant downregulation of miR-223-3p in HCC was reported in the majority of the studies included. With a total of 1,170 HCC samples in the present study, further large-sample analyses are required.
As miRNAs exist stably in the circulation, including the serum, plasma and urine, miR-223-3p may also be used as a blood-based tumor marker for diagnosing HCC in its early stages. In the present study, a comprehensive diagnostic meta-analysis was performed, which focused on circulating miR-223-3p and on miR-223-3p expression profiles in HCC tissues. The AUC of SROC was 0.89, which represents moderate accuracy for a diagnosis of HCC (59). In accordance with the present study, Li et al found that circulating miR-223-3p in HCC was an informative biomarker, with the AUC of SROC being 0.8597 (41). The limitation of the study by Li et al was that only one study with only 101 HCC serum samples had been included, whereas 19 studies comprising 1,170 HCC samples were used in the present study. The levels of miR-223-3p were closely correlated with HCC in fresh tissues and formalin-fixed paraffin-embedded (FFPE) samples. The expression of miR-223-3p was deregulated in FFPE HCC samples, with a sensitivity of 78.6% and a specificity of 72.7%. Additionally, downregulated miR-223-3p may act as a biomarker for HCC prognosis following orthotopic liver transplantation (60). Therefore, it may be possible to diagnose HCC by detecting miR-223-3p in tissue biopsies. Additional large-sample clinical studies are required to clarify the clinical significance of the association between miR-223-3p and HCC.
Previous studies have revealed that miR-223-3p is associated with different diseases. In prostate cancer, miR-223-3p targeted septin 6 to promote cell proliferation, cell apoptosis, cell invasion and other processes (61). NCOA1 and zinc finger E-box-binding homeobox 1 protein translation may be mediated by miR-223-3p to inhibit the migration and invasion of human bladder cancer cells (34,62). miR-223-3p may reflect changes in inflammation, vascular calcification and pathophysiology of bones (63). As a tumor suppressor, enhanced levels of miR-223-3p inhibited tumorigenesis and metastasis in HCC. miR-223-3p can promote HCC cell apoptosis through the mammalian target of rapamycin pathway (64,65). miR-223-3p may also be key in cell proliferation and exert tumor-suppressive effects on hepatitis B virus-related HCC (35). In addition, the overexpression of miR-223-3p can increase HCC cell sensitivity to anticancer drugs by repressing ATP-binding cassette sub-family B member 1 at the mRNA and protein levels (66). These results demonstrate the multiple functions of miR-223-3p in HCC.
The five hub genes of miR-223-3p identified in the present stud were further analyzed by investigating potential molecular mechanisms and the tumorigenesis of HCC. The hub genes CHEK1, DNMT1, BIRC5, KIF23 and COL1A1 were all significantly upregulated in HCC tissues, compared with non-cancerous controls. By contrast, miR-223-3p was present at a decreased level in HCC tissues. The AUC of SROC for miR-223-3p in diagnosing HCC was 0.89. Therefore, the lower level of miR-223-3p may target these important hub genes in certain pathways. For example, the CHEK1 gene was involved in the cell cycle pathway, KIF23 and DNMT1 were enriched at microRNA levels in cancer pathways, BIRC5 was identified in cancer pathways and COL1A1 was identified in the collagen fibril organization pathway. These five hub genes may be pivotal in HCC.
As a novel tumor suppressor, CHEK1 is involved in tumor prevention and therapeutics (67). However, the upregulation of CHEK1 in HCC may have a tumorigenic function, and the overexpression of CHEK1 may be a reliable diagnostic indicator in patients with HCC. Therefore, targeting the CHEK1/SYK(L) pathway may be a promising therapeutic strategy for treating HCC (68,69). DNMT1 is involved in tumorigenesis and cancer progression (70). A high expression level of DNMT1 has been associated with HCC-related growth factors. This high level of expression indirectly mediates the progression of HCC caused by hepatitis B virus infection (71,72). In addition, the upregulation of DNMT1 has been associated with recurrence and poor outcome of HCC cases (73). The KIF23 gene acts an important regulator in cytokinesis (74). The upregulation of KIF23 leads to the earlier recurrence of HCC (75). Therefore, DNMT1 and KIF23 may provide valuable information on the prognosis of patients with HCC. BIRC5 is known as an apoptosis inhibitor protein in malignancies; therefore BIRC5 may be a valuable diagnostic factor for HCC. The co-suppression of OCT4/BIRC5 is beneficial for treating patients with HCC (76,77), and COL1A1 is an important the target in hepatic fibrosis, having been confirmed as a potential prognostic biomarker in HCC (78–80). Of note, in the present study, the upregulation of COL1A1 was significantly correlated with the downregulation of miR-223 (r=−0.178; P=0.001), which indicated that COL1A1 may also be a potential diagnostic biomarker in HCC.
In conclusion, increasing evidence has revealed that the hub genes of miR-223-3p can directly or indirectly regulate the occurrence, progression, diagnosis, prognosis and treatment of HCC. However, the present study did not experimentally validate the correlations between miR-223-3p and its hub genes. A number of these hub genes had limited reports with miR-223-3p in HCC. In the future, the predicted hub genes, which were identified from the PPI analysis, require validation in in vivo and in vitro experiments.
In the present study, a decreased level of miR-223-3p in HCC was markedly associated with its diagnostic value, possibly by targeting potential genes in different biological pathways. Therefore, the present study revealed that miR-223-3p merits attention as a significant biomarker in the diagnostic setting and tumorigenesis of HCC. Additional experiments and analyses are required to confirm the potential molecular mechanisms and the prognostic role of miR-223-3p in HCC.
Acknowledgements
This study was supported by the fund of the National Natural Science Foundation of China (grant no. NSFC81560386).
Glossary
Abbreviations
- miR-223-3p
microRNA-223-3p
- HCC
hepatocellular carcinoma
- GEO
Gene Expression Omnibus
- TCGA
The Cancer Genome Atlas
- ROC
receiver operating curve
- AUC
area under the curve
- NLP
natural language processing
- GO
Gene Ontology
- KEGG
Kyoto Encyclopedia of Genes and Genomes
- PPI
protein-protein interaction
References
- 1.Mo Z, Zheng S, Lv Z, Zhuang Y, Lan X, Wang F, Lu X, Zhao Y, Zhou S. Senescence marker protein 30 (SMP30) serves as a potential prognostic indicator in hepatocellular carcinoma. Sci Rep. 2016;6:39376. doi: 10.1038/srep39376. [DOI] [PMC free article] [PubMed] [Google Scholar]
- 2.Lafaro KJ, Demirjian AN, Pawlik TM. Epidemiology of hepatocellular carcinoma. Surg Oncol Clin N Am. 2015;24:1–17. doi: 10.1016/j.soc.2014.09.001. [DOI] [PubMed] [Google Scholar]
- 3.Zheng W, Yao M, Qian Q, Sai W, Qiu L, Yang J, Wu W, Dong Z, Yao D. Oncogenic secretory clusterin in hepatocellular carcinoma: Expression at early staging and emerging molecular target. Oncotarget. 2016;8:52321–52332. doi: 10.18632/oncotarget.13674. [DOI] [PMC free article] [PubMed] [Google Scholar]
- 4.Huang W, Cui X, Chen Y, Shao M, Shao X, Shen Y, Liu Q, Wu M, Liu J, Ni W, et al. High VRK1 expression contributes to cell proliferation and survival in hepatocellular carcinoma. Pathol Res Pract. 2016;212:171–178. doi: 10.1016/j.prp.2015.11.015. [DOI] [PubMed] [Google Scholar]
- 5.Yu C, Cao Q, Chen P, Yang S, Gong X, Deng M, Ruan B, Li L. Tissue transglutaminase 2 exerts a tumor-promoting role in hepatitis B virus-related hepatocellular carcinoma. Tumour Biol. 2016 doi: 10.1007/s13277-016-5425-z. (Epub ahead of print) [DOI] [PubMed] [Google Scholar]
- 6.Mazzola A, Costantino A, Petta S, Bartolotta TV, Raineri M, Sacco R, Brancatelli G, Cammà C, Cabibbo G. Recurrence of hepatocellular carcinoma after liver transplantation: An update. Future Oncol. 2015;11:2923–2936. doi: 10.2217/fon.15.239. [DOI] [PubMed] [Google Scholar]
- 7.Jiang H, Zhang X, Tao Y, Shan L, Jiang Q, Yu Y, Cai F, Ma L. Prognostic and clinicopathologic significance of SIRT1 expression in hepatocellular carcinoma. Oncotarget. 2016;8:52357–52365. doi: 10.18632/oncotarget.14096. [DOI] [PMC free article] [PubMed] [Google Scholar]
- 8.Zhang T, Zhang X, Shi W, Xu J, Fan H, Zhang S, Ni R. The DNA damage repair protein Ku70 regulates tumor cell and hepatic carcinogenesis by interacting with FOXO4. Pathol Res Pract. 2016;212:153–161. doi: 10.1016/j.prp.2015.12.012. [DOI] [PubMed] [Google Scholar]
- 9.Forner A, Llovet JM, Bruix J. Hepatocellular carcinoma. Lancet. 2012;379:1245–1255. doi: 10.1016/S0140-6736(11)61347-0. [DOI] [PubMed] [Google Scholar]
- 10.Ke M, Xu T, Li N, Ren Y, Shi A, Lv Y, He H. Prognostic nutritional index predicts short-term outcomes after liver resection for hepatocellular carcinoma within the Milan criteria. Oncotarget. 2016;7:81611–81620. doi: 10.18632/oncotarget.13151. [DOI] [PMC free article] [PubMed] [Google Scholar]
- 11.Xu Y, Rong J, Duan S, Chen C, Li Y, Peng B, Yi B, Zheng Z, Gao Y, Wang K, et al. High expression of GNA13 is associated with poor prognosis in hepatocellular carcinoma. Sci Rep. 2016;6:35948. doi: 10.1038/srep35948. [DOI] [PMC free article] [PubMed] [Google Scholar]
- 12.Li J, Gao JZ, Du JL, Wei LX. Prognostic and clinicopathological significance of glypican-3 overexpression in hepatocellular carcinoma: A meta-analysis. World J Gastroenterol. 2014;20:6336–6344. doi: 10.3748/wjg.v20.i20.6336. [DOI] [PMC free article] [PubMed] [Google Scholar]
- 13.Zhang N, Gu J, Yin L, Wu J, Du MY, Ding K, Huang T, He X. Incorporation of alpha-fetoprotein (AFP) into subclassification of BCLC C stage hepatocellular carcinoma according to a 5-year survival analysis based on the SEER database. Oncotarget. 2016;7:81389–81401. doi: 10.18632/oncotarget.13232. [DOI] [PMC free article] [PubMed] [Google Scholar]
- 14.Chen J, Wu FX, Luo HL, Liu JJ, Luo T, Bai T, Li LQ, Fan XH. Berberine upregulates miR-22-3p to suppress hepatocellular carcinoma cell proliferation by targeting Sp1. Am J Transl Res. 2016;8:4932–4941. [PMC free article] [PubMed] [Google Scholar]
- 15.Yates LA, Norbury CJ, Gilbert RJ. The long and short of microRNA. Cell. 2013;153:516–519. doi: 10.1016/j.cell.2013.04.003. [DOI] [PubMed] [Google Scholar]
- 16.Liu Z, Wang C, Jiao X, Zhao S, Liu X, Wang Y, Zhang J. miR-221 promotes growth and invasion of hepatocellular carcinoma cells by constitutive activation of NFκB. Am J Transl Res. 2016;8:4764–4777. [PMC free article] [PubMed] [Google Scholar]
- 17.Blanco-Calvo M, Calvo L, Figueroa A, Haz-Conde M, Antón-Aparicio L, Valladares-Ayerbes M. Circulating microRNAs: Molecular microsensors in gastrointestinal cancer. Sensors. 2012;12:9349–9362. doi: 10.3390/s120709349. [DOI] [PMC free article] [PubMed] [Google Scholar]
- 18.Cao L, Xie B, Yang X, Liang H, Jiang X, Zhang D, Xue P, Chen D, Shao Z. miR-324-5p suppresses hepatocellular carcinoma cell invasion by counteracting ECM degradation through post-transcriptionally downregulating ETS1 and SP1. PLoS One. 2015;10:e0133074. doi: 10.1371/journal.pone.0133074. [DOI] [PMC free article] [PubMed] [Google Scholar]
- 19.Zekri AN, Youssef AS, El-Desouky ED, Ahmed OS, Lotfy MM, Nassar AA, Bahnassey AA. Serum microRNA panels as potential biomarkers for early detection of hepatocellular carcinoma on top of HCV infection. Tumour Biol. 2016;37:12273–12286. doi: 10.1007/s13277-016-5097-8. [DOI] [PubMed] [Google Scholar]
- 20.Xue HY, Liu Y, Liao JZ, Lin JS, Li B, Yuan WG, Lee RJ, Li L, Xu CR, He XX. Gold nanoparticles delivered miR-375 for treatment of hepatocellular carcinoma. Oncotarget. 2016;7:86675–86686. doi: 10.18632/oncotarget.13431. [DOI] [PMC free article] [PubMed] [Google Scholar]
- 21.Shen S, Lin Y, Yuan X, Shen L, Chen J, Chen L, Qin L, Shen B. Biomarker microRNAs for diagnosis, prognosis and treatment of hepatocellular carcinoma: A functional survey and comparison. Sci Rep. 2016;6:38311. doi: 10.1038/srep38311. [DOI] [PMC free article] [PubMed] [Google Scholar]
- 22.Zhao L, Wang W. miR-125b suppresses the proliferation of hepatocellular carcinoma cells by targeting Sirtuin7. Int J Clin Exp Med. 2015;8:18469–18475. [PMC free article] [PubMed] [Google Scholar]
- 23.Liu B, Sun T, Wu G, Shang-Guan H, Jiang ZJ, Zhang JR, Zheng YF. miR-15a suppresses hepatocarcinoma cell migration and invasion by directly targeting cMyb. Am J Transl Res. 2017;9:520–532. [PMC free article] [PubMed] [Google Scholar]
- 24.He R, Yang L, Lin X, Chen X, Lin X, Wei F, Liang X, Luo Y, Wu Y, Gan T, et al. miR-30a-5p suppresses cell growth and enhances apoptosis of hepatocellular carcinoma cells via targeting AEG-1. Int J Clin Exp Pathol. 2015;8:15632–15641. [PMC free article] [PubMed] [Google Scholar]
- 25.Liu S, Liu K, Zhang W, Wang Y, Jin Z, Jia B, Liu Y. miR-449a inhibits proliferation and invasion by regulating ADAM10 in hepatocellular carcinoma. Am J Transl Res. 2016;8:2609–2619. [PMC free article] [PubMed] [Google Scholar] [Retracted]
- 26.Liu Y, Zhang W, Liu K, Liu S, Ji B, Wang Y. miR-138 suppresses cell proliferation and invasion by inhibiting SOX9 in hepatocellular carcinoma. Am J Transl Res. 2016;8:2159–2168. [PMC free article] [PubMed] [Google Scholar] [Retracted]
- 27.Yao H, Liu X, Chen S, Xia W, Chen X. Decreased expression of serum miR-424 correlates with poor prognosis of patients with hepatocellular carcinoma. Int J Clin Exp Pathol. 2015;8:14830–14835. [PMC free article] [PubMed] [Google Scholar]
- 28.Sun J, Fang K, Shen H, Qian Y. MicroRNA-9 is a ponderable index for the prognosis of human hepatocellular carcinoma. Int J Clin Exp Med. 2015;8:17748–17756. [PMC free article] [PubMed] [Google Scholar]
- 29.Huang CS, Yu W, Cui H, Wang YJ, Zhang L, Han F, Huang T. Increased expression of miR-21 predicts poor prognosis in patients with hepatocellular carcinoma. Int J Clin Exp Pathol. 2015;8:7234–7238. [PMC free article] [PubMed] [Google Scholar]
- 30.Gan TQ, Tang RX, He RQ, Dang YW, Xie Y, Chen G. Upregulated miR-1269 in hepatocellular carcinoma and its clinical significance. Int J Clin Exp Med. 2015;8:714–721. [PMC free article] [PubMed] [Google Scholar]
- 31.Sun XF, Sun JP, Hou HT, Li K, Liu X, Ge QX. MicroRNA-27b exerts an oncogenic function by targeting Fbxw7 in human hepatocellular carcinoma. Tumour Biol. 2016;37:15325–15332. doi: 10.1007/s13277-016-5444-9. [DOI] [PubMed] [Google Scholar]
- 32.Kuasne H, Barros-Filho MC, Busso-Lopes A, Marchi FA, Pinheiro M, Muñoz JJ, Scapulatempo-Neto C, Faria EF, Guimarães GC, Lopes A, et al. Integrative miRNA and mRNA analysis in penile carcinomas reveals markers and pathways with potential clinical impact. Oncotarget. 2017;8:15294–15306. doi: 10.18632/oncotarget.14783. [DOI] [PMC free article] [PubMed] [Google Scholar]
- 33.Zhou X, Wen W, Zhu J, Huang Z, Zhang L, Zhang H, Qi LW, Shan X, Wang T, Cheng W, et al. A six-microRNA signature in plasma was identified as a potential biomarker in diagnosis of esophageal squamous cell carcinoma. Oncotarget. 2017;8:34468–34480. doi: 10.18632/oncotarget.16519. [DOI] [PMC free article] [PubMed] [Google Scholar]
- 34.Guo J, Cao R, Yu X, Xiao Z, Chen Z. MicroRNA-223-3p inhibits human bladder cancer cell migration and invasion. Tumour Biol. 2017;39:1010428317691678. doi: 10.1177/1010428317691678. [DOI] [PubMed] [Google Scholar]
- 35.Yu G, Chen X, Chen S, Ye W, Hou K, Liang M. miR-19a, miR-122 and miR-223 are differentially regulated by hepatitis B virus X protein and involve in cell proliferation in hepatoma cells. J Transl Med. 2016;14:122. doi: 10.1186/s12967-016-0888-7. [DOI] [PMC free article] [PubMed] [Google Scholar]
- 36.Giray BG, Emekdas G, Tezcan S, Ulger M, Serin MS, Sezgin O, Altintas E, Tiftik EN. Profiles of serum microRNAs; miR-125b-5p and miR223-3p serve as novel biomarkers for HBV-positive hepatocellular carcinoma. Mol Biol Rep. 2014;41:4513–4519. doi: 10.1007/s11033-014-3322-3. [DOI] [PubMed] [Google Scholar]
- 37.Bhattacharya S, Steele R, Shrivastava S, Chakraborty S, Di Bisceglie AM, Ray RB. Serum miR-30e and miR-223 as novel noninvasive biomarkers for hepatocellular carcinoma. Am J Pathol. 2016;186:242–247. doi: 10.1016/j.ajpath.2015.10.003. [DOI] [PMC free article] [PubMed] [Google Scholar]
- 38.Zhou J, Yu L, Gao X, Hu J, Wang J, Dai Z, Wang JF, Zhang Z, Lu S, Huang X, et al. Plasma microRNA panel to diagnose hepatitis B virus-related hepatocellular carcinoma. J Clin Oncol. 2011;29:4781–4788. doi: 10.1200/JCO.2011.38.2697. [DOI] [PubMed] [Google Scholar]
- 39.Xu J, Wu C, Che X, Wang L, Yu D, Zhang T, Huang L, Li H, Tan W, Wang C, Lin D. Circulating microRNAs, miR-21, miR-122, and miR-223, in patients with hepatocellular carcinoma or chronic hepatitis. Mol Carcinog. 2011;50:136–142. doi: 10.1002/mc.20712. [DOI] [PubMed] [Google Scholar]
- 40.Ji J, Zheng X, Forgues M, Yamashita T, Wauthier EL, Reid LM, Wen X, Song Y, Wei JS, Khan J, et al. Identification of microRNAs specific for epithelial cell adhesion molecule-positive tumor cells in hepatocellular carcinoma. Hepatology. 2015;62:829–840. doi: 10.1002/hep.27886. [DOI] [PMC free article] [PubMed] [Google Scholar]
- 41.Li G, Shen Q, Li C, Li D, Chen J, He M. Identification of circulating microRNAs as novel potential biomarkers for hepatocellular carcinoma detection: A systematic review and meta-analysis. Clin Transl Oncol. 2015;17:684–693. doi: 10.1007/s12094-015-1294-y. [DOI] [PubMed] [Google Scholar]
- 42.Fiorino S, Bacchi-Reggiani ML, Visani M, Acquaviva G, Fornelli A, Masetti M, Tura A, Grizzi F, Zanello M, Mastrangelo L, et al. MicroRNAs as possible biomarkers for diagnosis and prognosis of hepatitis B- and C-related-hepatocellular-carcinoma. World J Gastroenterol. 2016;22:3907–3936. doi: 10.3748/wjg.v22.i15.3907. [DOI] [PMC free article] [PubMed] [Google Scholar]
- 43.Zhao FY, Han J, Chen XW, Wang J, Wang XD, Sun JG, Chen ZT. miR-223 enhances the sensitivity of non-small cell lung cancer cells to erlotinib by targeting the insulin-like growth factor-1 receptor. Int J Mol Med. 2016;38:183–191. doi: 10.3892/ijmm.2016.2588. [DOI] [PMC free article] [PubMed] [Google Scholar]
- 44.Juzėnas S, Saltenienė V, Kupcinskas J, Link A, Kiudelis G, Jonaitis L, Jarmalaite S, Kupcinskas L, Malfertheiner P, Skieceviciene J. Analysis of deregulated microRNAs and their target genes in gastric cancer. PLoS One. 2015;10:e0132327. doi: 10.1371/journal.pone.0132327. [DOI] [PMC free article] [PubMed] [Google Scholar]
- 45.Wong QW, Lung RW, Law PT, Lai PB, Chan KY, To KF, Wong N. MicroRNA-223 is commonly repressed in hepatocellular carcinoma and potentiates expression of stathmin1. Gastroenterology. 2008;135:257–269. doi: 10.1053/j.gastro.2008.04.003. [DOI] [PubMed] [Google Scholar]
- 46.Zhao WY, Wang DD, Song MQ, Yang L, Ye J, Chen LB. Role of microRNA-223 and its target gene oncogene c-myc in hepatocellular carcinoma pathogenesis. Zhonghua Gan Zang Bing Za Zhi. 2011;19:114–117. doi: 10.3760/cma.j.issn.1007-3418.2011.02.010. (In Chinese) [DOI] [PubMed] [Google Scholar]
- 47.Whiting PF, Rutjes AW, Westwood ME, Mallett S, Deeks JJ, Reitsma JB, Leeflang MM, Sterne JA, Bossuyt PM, QUADAS-2 Group QUADAS-2: A revised tool for the quality assessment of diagnostic accuracy studies. Ann Intern Med. 2011;155:529–536. doi: 10.7326/0003-4819-155-8-201110180-00009. [DOI] [PubMed] [Google Scholar]
- 48.Zintzaras E, Ioannidis JP. Heterogeneity testing in meta-analysis of genome searches. Genet Epidemiol. 2005;28:123–137. doi: 10.1002/gepi.20048. [DOI] [PubMed] [Google Scholar]
- 49.Deeks JJ, Macaskill P, Irwig L. The performance of tests of publication bias and other sample size effects in systematic reviews of diagnostic test accuracy was assessed. J Clin Epidemiol. 2005;58:882–893. doi: 10.1016/j.jclinepi.2005.01.016. [DOI] [PubMed] [Google Scholar]
- 50.Huang WT, Wang HL, Yang H, Ren FH, Luo YH, Huang CQ, Liang YY, Liang HW, Chen G, Dang YW. Lower expressed miR-198 and its potential targets in hepatocellular carcinoma: A clinicopathological and in silico study. Onco Targets Ther. 2016;9:5163–5180. doi: 10.2147/OTT.S108828. [DOI] [PMC free article] [PubMed] [Google Scholar]
- 51.Settles B. ABNER: An open source tool for automatically tagging genes, proteins and other entity names in text. Bioinformatics. 2005;21:3191–3192. doi: 10.1093/bioinformatics/bti475. [DOI] [PubMed] [Google Scholar]
- 52.Szklarczyk D, Franceschini A, Wyder S, Forslund K, Heller D, Huerta-Cepas J, Simonovic M, Roth A, Santos A, Tsafou KP, et al. STRING v10: Protein-protein interaction networks, integrated over the tree of life. Nucleic Acids Res. 2015;43(Database issue):D447–D452. doi: 10.1093/nar/gku1003. [DOI] [PMC free article] [PubMed] [Google Scholar]
- 53.Khairy A, Hamza I, Shaker O, Yosry A. Serum miRNA panel in egyptian patients with chronic hepatitis C related hepatocellular carcinoma. Asian Pac J Cancer Prev. 2016;17:2699–2703. [PubMed] [Google Scholar]
- 54.Zuo D, Chen L, Liu X, et al. Combination of miR-125b and miR-27a enhances sensitivity and specificity of AFP-based diagnosis of hepatocellular carcinoma. Tumour Biol. 2016;37:6539–6549. doi: 10.1007/s13277-015-4545-1. [DOI] [PubMed] [Google Scholar]
- 55.Oksuz Z, Serin MS, Kaplan E, Dogen A, Tezcan S, Aslan G, Emekdas G, Sezgin O, Altintas E, Tiftik EN. Serum microRNAs; miR-30c-5p, miR-223-3p, miR-302c-3p and miR-17-5p could be used as novel non-invasive biomarkers for HCV-positive cirrhosis and hepatocellular carcinoma. Mol Biol Rep. 2015;42:713–720. doi: 10.1007/s11033-014-3819-9. [DOI] [PubMed] [Google Scholar]
- 56.Li LM, Hu ZB, Zhou ZX, Chen X, Liu FY, Zhang JF, Shen HB, Zhang CY, Zen K. Serum microRNA profiles serve as novel biomarkers for HBV infection and diagnosis of HBV-positive hepatocarcinoma. Cancer Res. 2010;70:9798–9807. doi: 10.1158/0008-5472.CAN-10-1001. [DOI] [PubMed] [Google Scholar]
- 57.Laios A, O'Toole S, Flavin R, Martin C, Kelly L, Ring M, Finn SP, Barrett C, Loda M, Gleeson N, et al. Potential role of miR-9 and miR-223 in recurrent ovarian cancer. Mol Cancer. 2008;7:35. doi: 10.1186/1476-4598-7-35. [DOI] [PMC free article] [PubMed] [Google Scholar]
- 58.Tachibana H, Sho R, Takeda Y, Zhang X, Yoshida Y, Narimatsu H, Otani K, Ishikawa S, Fukao A, Asao H, Iino M. Circulating miR-223 in oral cancer: Its potential as a novel diagnostic biomarker and therapeutic target. PLoS One. 2016;11:e0159693. doi: 10.1371/journal.pone.0159693. [DOI] [PMC free article] [PubMed] [Google Scholar]
- 59.Swets JA. Measuring the accuracy of diagnostic systems. Science. 1988;240:1285–1293. doi: 10.1126/science.3287615. [DOI] [PubMed] [Google Scholar]
- 60.Han ZB, Zhong L, Teng MJ, Fan JW, Tang HM, Wu JY, Chen HY, Wang ZW, Qiu GQ, Peng ZH. Identification of recurrence-related microRNAs in hepatocellular carcinoma following liver transplantation. Mol Oncol. 2012;6:445–457. doi: 10.1016/j.molonc.2012.04.001. [DOI] [PMC free article] [PubMed] [Google Scholar]
- 61.Wei Y, Yang J, Yi L, Wang Y, Dong Z, Liu Z, Ou-yang S, Wu H, Zhong Z, Yin Z, et al. miR-223-3p targeting SEPT6 promotes the biological behavior of prostate cancer. Sci Rep. 2014;4:7546. doi: 10.1038/srep07546. [DOI] [PMC free article] [PubMed] [Google Scholar]
- 62.Zhi Y, Pan J, Shen W, He P, Zheng J, Zhou X, Lu G, Chen Z, Zhou Z. Ginkgolide B inhibits human bladder cancer cell migration and invasion through microRNA-223-3p. Cell Physiol Biochem. 2016;39:1787–1794. doi: 10.1159/000447878. [DOI] [PubMed] [Google Scholar]
- 63.Ulbing M, Kirsch AH, Leber B, Lemesch S, Münzker J, Schweighofer N, Hofer D, Trummer O, Rosenkranz AR, Müller H, et al. MicroRNAs 223–3p and 93-5p in patients with chronic kidney disease before and after renal transplantation. Bone. 2017;95:115–123. doi: 10.1016/j.bone.2016.11.016. [DOI] [PMC free article] [PubMed] [Google Scholar]
- 64.Dong Z, Qi R, Guo X, Zhao X, Li Y, Zeng Z, Bai W, Chang X, Hao L, Chen Y, et al. miR-223 modulates hepatocellular carcinoma cell proliferation through promoting apoptosis via the Rab1-mediated mTOR activation. Biochem Biophys Res Commun. 2017;483:630–637. doi: 10.1016/j.bbrc.2016.12.091. [DOI] [PubMed] [Google Scholar]
- 65.Dong YW, Wang R, Cai QQ, Qi B, Wu W, Zhang YH, Wu XZ. Sulfatide epigenetically regulates miR-223 and promotes the migration of human hepatocellular carcinoma cells. J Hepatol. 2014;60:792–801. doi: 10.1016/j.jhep.2013.12.004. [DOI] [PubMed] [Google Scholar]
- 66.Yang T, Zheng ZM, Li XN, Li ZF, Wang Y, Geng YF, Bai L, Zhang XB. miR-223 modulates multidrug resistance via downregulation of ABCB1 in hepatocellular carcinoma cells. Exp Biol Med (Maywood) 2013;238:1024–1032. doi: 10.1177/1535370213497321. [DOI] [PubMed] [Google Scholar]
- 67.Wang XM, Li J, Feng XC, Wang Q, Guan DY, Shen ZH. Involvement of the role of Chk1 in lithium-induced G2/M phase cell cycle arrest in hepatocellular carcinoma cells. J Cell Biochem. 2008;104:1181–1191. doi: 10.1002/jcb.21693. [DOI] [PubMed] [Google Scholar]
- 68.Xie Y, Wei RR, Huang GL, Zhang MY, Yuan YF, Wang HY. Checkpoint kinase 1 is negatively regulated by miR-497 in hepatocellular carcinoma. Med Oncol. 2014;31:844. doi: 10.1007/s12032-014-0844-4. [DOI] [PubMed] [Google Scholar]
- 69.Hong J, Hu K, Yuan Y, Sang Y, Bu Q, Chen G, Yang L, Li B, Huang P, Chen D, et al. CHK1 targets spleen tyrosine kinase (L) for proteolysis in hepatocellular carcinoma. J Clin Invest. 2012;122:2165–2175. doi: 10.1172/JCI61380. [DOI] [PMC free article] [PubMed] [Google Scholar]
- 70.Yan L, Yang X, Davidson NE. Role of DNA methylation and histone acetylation in steroid receptor expression in breast cancer. J Mammary Gland Biol Neoplasia. 2001;6:183–192. doi: 10.1023/A:1011308707512. [DOI] [PubMed] [Google Scholar]
- 71.Fang QL, Yin YR, Xie CR, Zhang S, Zhao WX, Pan C, Wang XM, Yin ZY. Mechanistic and biological significance of DNA methyltransferase 1 upregulated by growth factors in human hepatocellular carcinoma. Int J Oncol. 2015;46:782–790. doi: 10.3892/ijo.2014.2776. [DOI] [PubMed] [Google Scholar]
- 72.Li H, Yang F, Gao B, Yu Z, Liu X, Xie F, Zhang J. Hepatitis B virus infection in hepatocellular carcinoma tissues upregulates expression of DNA methyltransferases. Int J Clin Exp Med. 2015;8:4175–4185. [PMC free article] [PubMed] [Google Scholar]
- 73.Saito Y, Kanai Y, Nakagawa T, Sakamoto M, Saito H, Ishii H, Hirohashi S. Increased protein expression of DNA methyltransferase (DNMT) 1 is significantly correlated with the malignant potential and poor prognosis of human hepatocellular carcinomas. Int J Cancer. 2003;105:527–532. doi: 10.1002/ijc.11127. [DOI] [PubMed] [Google Scholar]
- 74.Neef R, Klein UR, Kopajtich R, Barr FA. Cooperation between mitotic kinesins controls the late stages of cytokinesis. Curr Biol. 2006;16:301–307. doi: 10.1016/j.cub.2005.12.030. [DOI] [PubMed] [Google Scholar]
- 75.Wang SM, Ooi LL, Hui KM. Upregulation of Rac GTPase-activating protein 1 is significantly associated with the early recurrence of human hepatocellular carcinoma. Clin Cancer Res. 2011;17:6040–6051. doi: 10.1158/1078-0432.CCR-11-0557. [DOI] [PubMed] [Google Scholar]
- 76.Cao L, Li C, Shen S, Yan Y, Ji W, Wang J, Qian H, Jiang X, Li Z, Wu M. OCT4 increases BIRC5 and CCND1 expression and promotes cancer progression in hepatocellular carcinoma. BMC Cancer. 2013;13:82. doi: 10.1186/1471-2407-13-82. [DOI] [PMC free article] [PubMed] [Google Scholar]
- 77.Jin B, Wang W, Du G, Huang GZ, Han LT, Tang ZY, Fan DG, Li J, Zhang SZ. Identifying hub genes and dysregulated pathways in hepatocellular carcinoma. Eur Rev Med Pharmacol Sci. 2015;19:592–601. [PubMed] [Google Scholar]
- 78.Koilan S, Hamilton D, Baburyan N, Padala MK, Weber KT, Guntaka RV. Prevention of liver fibrosis by triple helix-forming oligodeoxyribonucleotides targeted to the promoter region of type I collagen gene. Oligonucleotides. 2010;20:231–237. doi: 10.1089/oli.2010.0244. [DOI] [PMC free article] [PubMed] [Google Scholar]
- 79.Yang MR, Zhang Y, Wu XX, Chen W. Critical genes of hepatocellular carcinoma revealed by network and module analysis of RNA-seq data. Eur Rev Med Pharmacol Sci. 2016;20:4248–4256. [PubMed] [Google Scholar]
- 80.Hayashi M, Nomoto S, Hishida M, Inokawa Y, Kanda M, Okamura Y, Nishikawa Y, Tanaka C, Kobayashi D, Yamada S, et al. Identification of the collagen type 1 α 1 gene (COL1A1) as a candidate survival-related factor associated with hepatocellular carcinoma. BMC Cancer. 2014;14:108. doi: 10.1186/1471-2407-14-108. [DOI] [PMC free article] [PubMed] [Google Scholar]


