

Abstract
Mutations in SCO2 are among the most common causes of COX deficiency, resulting in reduced mitochondrial oxidative ATP production capacity, often leading to hypertrophic cardiomyopathy (HCM). To date, none of the recent pertaining reports provide deep understanding of the SCO2 disease pathophysiology. To investigate the cardiac pathology of the disease, we were the first to generate induced pluripotent stem cell (iPSC)‐derived cardiomyocytes (iPSC‐CMs) from SCO2‐mutated patients. For iPSC generation, we reprogrammed skin fibroblasts from two SCO2 patients and healthy controls. The first patient was a compound heterozygote to the common E140K mutation, and the second was homozygote for the less common G193S mutation. iPSC were differentiated into cardiomyocytes through embryoid body (EB) formation. To test the hypothesis that the SCO2 mutation is associated with mitochondrial abnormalities, and intracellular Ca2+‐overload resulting in functional derangements and arrhythmias, we investigated in SCO2‐mutated iPSC‐CMs (compared to control cardiomyocytes): (i) the ultrastructural changes; (ii) the inotropic responsiveness to β‐adrenergic stimulation, increased [Ca2+]o and angiotensin‐II (AT‐II); and (iii) the Beat Rate Variability (BRV) characteristics. In support of the hypothesis, we found in the mutated iPSC‐CMs major ultrastructural abnormalities and markedly attenuated response to the inotropic interventions and caffeine, as well as delayed afterdepolarizations (DADs) and increased BRV, suggesting impaired SR Ca2+ handling due to attenuated SERCA activity caused by ATP shortage. Our novel results show that iPSC‐CMs are useful for investigating the pathophysiological mechanisms underlying the SCO2 mutation syndrome.
Keywords: SCO2 mutation, HCM, cardiomyocytes, iPSC, [Ca2+]i transients and contractions, action potentials, arrhythmias
Introduction
Derangements in the mitochondrial respiratory chain and specifically in cytochrome c oxidase (COX) are associated with deleterious effects in organs with high energy demands, such as the heart. Consequently, cardiac pathologies are a prevalent outcome of mitochondrial‐related disorders 1. The human SCO2 gene encodes a 266‐amino‐acid metallochaperone that participates in copper delivery to COX 2, and thus mutations in SCO2 are among the most common causes of COX deficiency 3. These disorders are characterized by encephalopathy and HCM, collectively leading to death in infancy or early childhood 4. Based on the COX deficiency caused by SCO2 mutations (resulting in ATP shortage), we hypothesized that the SCO2 mutation is associated with mitochondrial abnormalities, and intracellular Ca2+‐overload resulting in functional derangements and arrhythmias. To test this hypothesis, we investigated in SCO2‐mutated iPSC‐CMs generated from two babies (who died at 3–4 months) carrying different SCO2 mutations: (i) the ultrastructural changes; (ii) the inotropic responsiveness to β‐adrenergic stimulation, increased [Ca2+]o and AT‐II; and (iii) the Beat Rate Variability (BRV) characteristics. In support of our hypothesis, the diseased cardiomyocytes demonstrated abnormal mitochondrial ultrastructure, functional derangements including arrhythmias, suggesting disturbed intracellular Ca2+ homoeostasis, likely due to ATP deficiency.
Materials and methods
iPSC generation and characterization
Dermal biopsies were obtained from two SCO2‐mutated patients (babies) and two healthy donors (adults): (i) an Israeli male baby treated at the Rambam Health Care Campus in Haifa; (ii) an Estonian male baby treated at Tartu University Hospital in Estonia; (iii) a healthy adult Israeli female; (iv) a healthy adult Israeli male. Additionally, hair follicles were collected from a healthy adult Israeli female. iPSC were generated from the donors dermal fibroblasts (clones 5.2, 17.2, 24.5 and 27.10) or hair keratinocytes (clone N3) previously described 5. Following reprogramming, we used iPSC clones 17.2 and 27.10 generated from the Israeli and Estonian babies, accordingly. As control, we used clone 24.5 generated from a healthy 42‐year‐old female 5, 6. Additional control clones (5.2 and N3) were generated from healthy 25‐ and 23‐year‐old male and female, respectively. Clone FSE‐5 m was generated from an infant male and was used for β‐adrenergic responsiveness experiments. Unless stated otherwise, the control clone referred to in the article and Supporting information is 24.5 (HDF). Functional iPSC‐CMs were generated as previously described 7, 8, 9. Karyotyping, genotyping and pluripotency assay using teratoma formation assay are detailed in the Supporting information.
Immunofluorescence staining
See details in the Supporting information.
Measurements of intracellular [Ca2+]i transients, contractions, extracellular electrograms, transmembrane action potentials and BRV
All methods and protocols are detailed in the Supporting information. In brief, [Ca2+]i transients and contractions were measured from iPSC‐CMs composing embryoid bodies (EBs), using the IonOptix Calcium and Contractility system (Westwood, MA, USA), as previously described 5, 10. Transmembrane action potentials and extracellular electrograms were recorded by means of the whole cell patch clamp and microelectrode array (MEA), respectively 11, 12.
Transmission electron microscopy of the skeletal muscle biopsy and iPSC‐CMs
The Israeli patient underwent a muscle (gastrocnemius) biopsy as part of the studies performed in patients with suspected mitochondrial disorder (see Supporting information for details). Transmission electron microscopy (TEM) analysis was performed on 15‐, 30‐ and 45‐day‐old (post‐plating) EBs from SCO2G193S clone 17.2, SCO2E140K clone 27.10 and control clone 24.5 as previously reported 13. See details in the Supporting information.
Statistical analysis
Results are presented as mean ± S.E.M. See details in the Supporting information.
Results
The SCO2‐mutated patients
The Israeli patient was homozygote for a less common c.577G>A mutation in the SCO2 gene, termed SCO2G193S. This patient, hospitalized at the age of 3 months, had congenital stridor, encephalopathy, skeletal myopathy and lactic acidosis. Echocardiography and electrocardiography (ECG) performed at 4 months demonstrated major left ventricle hypertrophy (Fig. S1A and B). Electron microscopy of a muscle biopsy demonstrated glycogen accumulation and abnormal mitochondria (Fig. S1C and D). Enzyme assay indicated COX deficiency (1.2 K/mg) compared to normal values (16.81 ± 6.51 K/mg). The patient died at the age of 4 months due to cardiorespiratory failure. The Estonian patient had a compound heterozygote mutation c.418G>A in exon 2, termed SCO2E140K and a heterozygote c.17INS19 bp mutation in the coding region. As previously described, the patient was diagnosed with fatal infantile cardioencephalomyopathy and died at the age of 13 weeks due to respiratory insufficiency. Abnormalities in mitochondria size and structure and low COX activity levels were found in fibroblasts and muscle biopsies 14.
iPSC generation, characterization and differentiation into cardiomyocytes
The SCO2 iPSC clones from both patients expressed the pluripotent markers SSEA4, Oct4, TRA1‐60, Nanog, TRA1‐81 and Sox2, had normal karyotype, and demonstrated pluripotency by in vivo differentiation into derivatives of all three germ layers (Figs [Link], [Link], [Link]). In addition, we confirmed the homozygote switch of G to A at nucleotide 577 in the SCO2G193S gene, the heterozygote switch of G to A at nucleotide 418 in one allele and the insertion c.17INS19 bp in the second allele of the SCO2E140K gene (Figs S3 and 4). The healthy control clones 24.5 (HDF), 5.2 (HDF) and N3 (KT) were fully characterized previously (Fig. S7).
Transmission electron microscopy analysis
First, TEM analysis in 30‐day‐old control (Fig. 1A and B) and SCO2G193S iPSC‐CMs (Fig. 1C and D) showed enlarged mitochondria, disarrayed mitochondrial cristae, intra‐mitochondrial vacuoles, large masses of glycogen, lipid droplets and doubled nuclei in the mutated cardiomyocytes. In contrast, SCO2E140K iPSC‐CMs displayed only high quantities of glycogen and lipid droplets with minor mitochondrial ultrastructural changes (Fig. 1E and F; Fig. S5). While normal mitochondria had diameter of 0.30 ± 0.06 μm (n = 50), in SCO2G193S iPSC‐CMs mitochondria were much larger—0.50 ± 0.37 μm (n = 50, P < 0.001 versus control) (Table S1). Next, we found that ageing (15, 30 and 45 days) of SCO2G193S iPSC‐CMs was associated with progression of the ultrastructural mitochondrial abnormalities compared with mitochondria from control and SCO2E104K iPSC‐CMs. While 15‐day‐old cardiomyocytes showed mild mitochondrial abnormalities (Fig. 2D), 30‐day‐old cardiomyocytes demonstrated abnormally large mitochondria with few tightly packed cristae and intra‐mitochondrial glycogen accumulation (Fig. 2E). Accordingly, 45‐day‐old cardiomyocytes displayed oversized mitochondria, with disarrayed and highly increased number of curled cristae (Fig. 2F).
Figure 1.

TEM images of control and SCO2‐mutated iPSC‐CMs. (A) Normal ultrastructure of 30‐day‐old control iPSC‐CMs with organized myofibrils (mf), grouped normal mitochondria (nm) and glycogen masses (gly). NC‐nucleus. (B) Higher magnification of the square marked area in (A) shows normal mitochondria (nm) from control iPSC‐CMs, containing parallel cristae (arrowheads). (C) 30‐day‐old SCO2G193S iPSC‐CMs contain higher glycogen (gly) content, lipid droplets (L), poor organized myofibrils (mf) and oversized mitochondria (M). The intercellular space is enlarged compared with control. NC‐nucleus. (D) Enlarged mitochondrion (M) from 30‐day‐old SCO2G193S iPSC‐CMs (square marked area in C) shows increased number of disarrayed cristae, vacuolated cristae (red arrow) and glycogen inclusions (gly). A normal mitochondrion (nm) is visible nearby. (E) 30‐day‐old SCO2E140K cardiomyocytes show organized myofibrils (mf), large masses of glycogen (gly), lipid droplets (L) and clusters of mitochondria (nm). NC‐nucleus. (F) Higher magnification of the square marked area in E shows normal structured mitochondria (nm) and slightly enlarged, doughnut‐shaped mitochondria (M). gly: glycogen.
Figure 2.
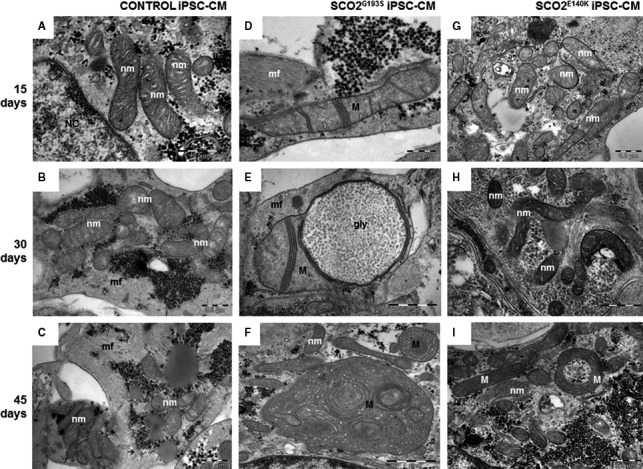
TEM images showing mitochondria from 15‐, 30‐ and 45‐day‐old control (A–C), SCO2G193S (D–F) and SCO2E140K (G–I) iPSC‐CMs. Normal mitochondria show few parallel cristae (nm). The mitochondria abnormalities (M) progress with the age of SCO2G193S iPSC‐CMs: disarray and decreased number of mitochondrial cristae (D); few tightly packed cristae and glycogen accumulation inside the mitochondrion (E); mitochondria are enlarged and contain disarrayed and highly increased number of cristae (F). SCO2E140KiPSC‐CMs present mostly mitochondria with normal ultrastructure (nm) (G‐I) and rare doughnut‐like mitochondria (M) at 45 days (I), mf: myofibrils; NC: nuclei.
Functional characteristics and responsiveness to positive inotropic interventions
The first step in this series of experiments was to determine whether the mutated cardiomyocytes have different [Ca2+]i transient and contraction characteristics than control cardiomyocytes. As seen in Figure S6, all the functional characteristics were similar in the three experimental groups, suggesting that the mutation did not affect the basal excitation–contraction coupling machinery. Next, to test our working hypothesis, we investigated the inotropic effects of β‐adrenergic stimulation (with isoproterenol), increased [Ca2+]o and AT‐II.
β‐adrenergic stimulation
A fundamental cardiac feature is β‐adrenergic‐mediated positive inotropy caused by increased SR Ca2+ release, which relies on the ATP‐dependent SERCA activity 15. As shown in Figure 3, isoproterenol caused marked dose‐dependent positive inotropic and lusitropic effects in control iPSC‐CMs (n = 18, P < 0.05). Importantly, similar effects were observed in other control clones including 5.2 (HDF) and N3 (KT) (Fig. S8). In contrast, SCO2G193S (n = 19) and SCO2E140K (n = 11) iPSC‐CMs were completely unresponsive to isoproterenol (P < 0.05 compared to control).
Figure 3.
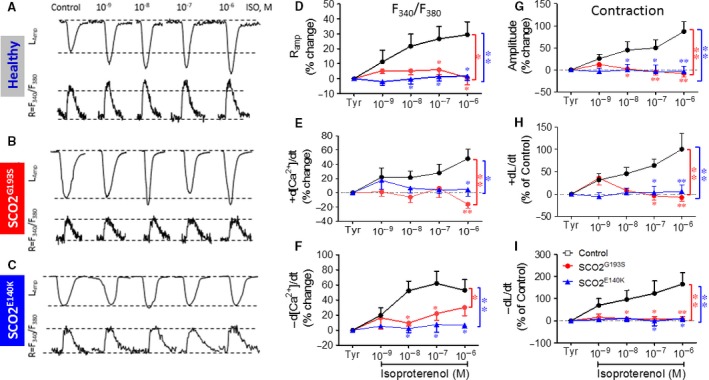
The effects of isoproterenol on [Ca2+]i transients and contractions in control, SCO2G193S and SCO2E140K iPSC‐CMs. (A–C) [Ca2+]i transients (R = F340/F380) and contractions (L amp) from control, SCO2G193S and SCO2E140K iPSC‐CMs, respectively. (D) [Ca2+]i transient amplitude (R amp); (E) maximal rate of [Ca2+]i rise (+d[Ca2+]/dt); (F) maximal rate of [Ca2+]i decay (‐d[Ca2+]/dt); (G) maximal amplitude (L amp); (H) maximal contraction rate (+dL/dt); (I) maximal relaxation rate (−dL/dt). The effect of isoproterenol on contraction characteristics of SCO2G193S (n = 13), SCO2E140K (n = 6) and control (n = 8) was expressed as per cent change. The effect of isoproterenol on the [Ca2+]i transients was expressed as the per cent change in the fluorescence ratio, F340/F380 (n = 6, n = 5 and n = 10, for SCO2G193S, SCO2E140K and control respectively); Tyr: Tyrode's solution; *P < 0.05, **P < 0.001 (versus control).
Effects of increased [Ca2+]o
To decipher whether the attenuated response to isoproterenol was due to dysfunctional β‐adrenergic cascade or alternatively—impaired downstream element mediating any positive inotropic intervention, we investigated the effect of elevating [Ca2+]o; this intervention augments L‐type Ca2+ current (ICa,L), which in turn increases SR Ca2+ release thereby increasing contractile force 16. Indeed, as shown in Figure 4A–C, in control cardiomyocytes (n = 12), elevating [Ca2+]o caused positive inotropic and lusitropic effects (P < 0.001), although the [Ca2+]i transients were affected to a lesser extent than contractions (Fig. 4D–F). In contrast, in agreement with their depressed response to isoproterenol, both SCO2G193S and SCO2E140K iPSC‐CMs were completely unresponsive (P < 0.05 versus control) to increased [Ca2+]o.
Figure 4.
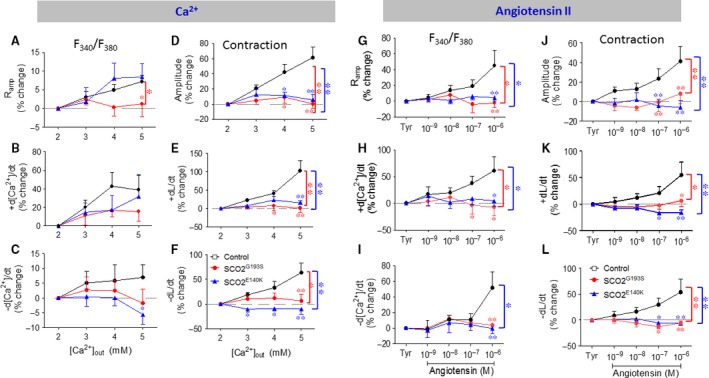
The effects of increased [Ca2+]o on the [Ca2+]i transients and contractions. (A) Ramp; (B) +d[Ca2+]/dt; (C) −d[Ca2+]/dt; (D) Lamp; (E) +dL/dt; (F) −dL/dt. The effect of [Ca2+]o on contraction characteristics of SCO2G193S (n = 6), SCO2E140K (n = 7) and control (n = 12) was expressed as per cent change. The effects of AT‐II on the [Ca2+]i transients and contractions. (G) Ramp; (H) +d[Ca2+]/dt; (I) ‐d[Ca2+]/dt; (J) Lamp; (K) +dL/dt; (L) −dL/dt. The effect of AT‐II on contraction characteristics of SCO2G193S (n = 7), SCO2E140K (n = 8) and control (n = 10) was expressed as percent change. The effect on the [Ca2+]i transients was expressed as the percent change in the fluorescence ratio, F340/F380 (n = 6, n = 6 and n = 7, for SCO2G193S, SCO2E140K and control respectively); Tyr: Tyrode's solution; *P < 0.05, **P < 0.001 (versus control).
Effects of AT‐II
Based on the above findings, our interim conclusion was that the common downstream denominator of these positive inotropic interventions is a defective SR in the mutated iPSC‐CMs. To support this notion, we investigated whether AT‐II, also inducing its positive inotropy via SR‐Ca2+ 17, is equally ineffective in the mutated cardiomyocytes. Indeed, whereas in control iPSC‐CMs AT‐II caused prominent dose‐dependent positive inotropic and lusitropic effects (n = 17, P < 0.05), SCO2G193S (n = 13) and SCO2E140K (n = 14) iPSC‐CMs were unresponsive (Fig. 4G–L). Hence, except for the maximal rate of [Ca2+]i decay which was not different between control and SCO2G193S iPSC‐CMs (significant only at 10−6M, P < 0.001), all control dose‐response relations were significantly (P < 0.05) different from the mutated cardiomyocytes.
Responsiveness to caffeine
Because the SR is the common denominator of all three positive inotropic interventions, we tested its functionality using a brief application of caffeine (10 mM) which opens RyR2 channels and releases SR Ca2+. In agreement with our previous report 5, in control cardiomyocytes, caffeine caused an abrupt increase in [Ca2+]i concomitant with contraction cessation, followed by a gradual decline in [Ca2+]i along with resumption (within ~13 sec.) of contractions (Fig. 5A). In contrast, in SCO2E140K cardiomyocytes (Fig. 5B and C), the response to caffeine was different, and included two major types, with equal proportions. In 45% of the experiments (total of 22), the response (termed ‘fast recovery’, FR) was smaller and shorter than control, and contractions resumed within ~0.8–5 sec. after caffeine application (Fig. 5B and F). In 45% of cardiomyocytes, the response amplitude was similar to control but recovery was much slower, within 21–89 sec. (Fig. 5C and F); this group was termed ‘slow recovery’ (SR). The remaining 10% of the SCO2E140K mutated iPSC‐CMs displayed a healthy‐like behaviour. Similarly (Fig. 5D and E), 31% of the SCO2G193S cardiomyocytes (total of 13) had FR, 54% SR and 15% control‐like response. To quantify the response to caffeine, we calculated three parameters: (i) recovery time—the time from the peak of caffeine‐induced [Ca2+]i rise to the first transient; (ii) the per cent change in caffeine‐induced [Ca2+]i signal amplitude, compared to pre‐caffeine amplitude; and (iii) the per cent change in caffeine‐induced Ca2+ signal area, compared to the pre‐caffeine value. In the SR group of both SCO2‐mutated cardiomyocytes, the recovery time was longer (P < 0.05), and the area and amplitude were similar to control cells (Fig. 5F–H). In the FR group, the SCO2G193 cells showed similar recovery time to control, whereas SCO2E140K displayed shorter recovery time (P < 0.05; Fig. 5F). In both mutations, the area and amplitude were smaller than control (P < 0.05; Fig. 5G–H). In summary, the depressed SR Ca2+ release capacity of the SCO2‐mutated iPSC‐CMs is likely to underlie the attenuated positive inotropic responsiveness to increased isoproterenol, [Ca2+]o and AT‐II.
Figure 5.
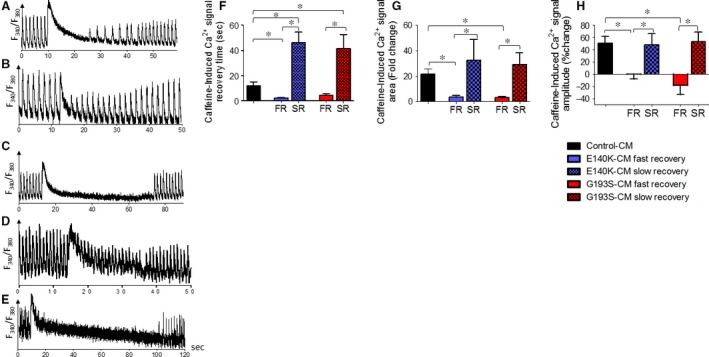
The effects of caffeine on control, SCO2 E140K and SCO2G193S iPSC‐CMs. [Ca2+]i transients from (A) control (B–C) SCO2E140K and (D–E) SCO2G193S iPSC‐CMs, demonstrating the effect of caffeine. (F) The mean recovery time, calculated as the time from the peak of caffeine‐induced [Ca2+]i rise to the first measurable [Ca2+]i transient; (G) per cent change in area of the caffeine‐induced Ca2+ signal compared to the pre‐caffeine area; (H) per cent change in caffeine‐induced Ca2+ signal amplitude compared to the pre‐caffeine amplitude. Control iPSC‐CMs (n = 7), SCO2G193S iPSC‐CMs (n = 11), SCO2E140K iPSC‐CMs (n = 20), *P < 0.05. Asterisk above bars connecting columns represents significant difference between groups. Each SCO2‐mutated group was divided into subgroups FR and SR according to type of reaction.
Arrhythmias in the SCO2‐mutated cardiomyocytes
Transmembrane action potentials
The results obtained thus far suggest that in the mutated cardiomyocytes, the SR is at least partially depleted of Ca2+, implying that the cytoplasm is Ca2+ overloaded, which can thus give rise to delayed afterdepolarizations (DADs) and triggered arrhythmias 10. To determine whether the mutated cardiomyocytes exhibit arrhythmias typical of Ca2+ overload, transmembrane action potentials were recorded from small clusters of cardiomyocytes in the absence and presence of increasing isoproterenol concentrations. As depicted in Figure 6A, in control cardiomyocytes, isoproterenol caused a typical dose‐dependent positive chronotropic effect. In contrast (in agreement with the Ca2+ overload concept), in SCO2E140K and SCO2G193S cardiomyocytes (Fig. 6B and C), DADs began to appear under baseline conditions (two of three experiments) or in the presence of low (10−8 M) (2/3) isoproterenol concentration, respectively. In addition to DADs, in mutated cardiomyocytes, increasing isoproterenol concentrations led to decreased firing rate (from 10−8 M) and oscillatory pre‐potentials (starting from 10−8 M and 10−7 M in SCO2G193S and SCO2E140K cardiomyocytes, respectively) (4/6). Interestingly, in one of the experiments with SCO2E140K cardiomyocytes, 10−9 M isoproterenol markedly increased the firing rate and eliminated the DADs, but then starting from 10−8 M prominent DADs appeared along with a decline in the firing rate (Fig. 6C).
Figure 6.
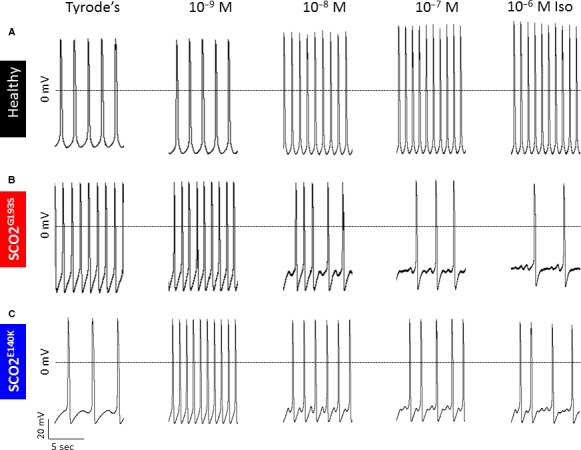
Transmembrane action potential recordings from control, SCO2G193S and SCO2E140K iPSC‐CMs in response to increasing concentrations of isoproterenol. (A) Representative recordings from control iPSC‐CMs in the presence of Tyrode's solution and isoproterenol concentrations of 10−9 M, 10−8 M, 10−7 M and 10−6 M. Control iPSC‐CMs displayed a positive chronotropic response to increasing concentrations of isoproterenol, represented by firing rate. (B) Recordings from SCO2G193S and (C) from SCO2E140K iPSC‐CMs in the presence of Tyrode's solution and increasing isoproterenol concentrations. SCO2G193S iPSC‐CMs show generation of DADs with isoproterenol. SCO2E140K iPSC‐CMs display DADs under baseline conditions and in the presence of different isoproterenol concentrations.
Extracellular electrograms recorded from contracting cardiomyocyte networks
To support the arrhythmogenic findings at the single cell level, we confirmed the presence of isoproterenol‐induced arrhythmias in a network of contracting cardiomyocytes, by recording extracellular electrograms using the MEA system, in the absence and presence of isoproterenol. In the absence of isoproterenol, the spontaneous beat rate was similar in the three experimental groups (Fig. 7A), suggesting the basic pacemaker machinery was not affected by the SCO2 mutations. In agreement with the reduced inotropic and chronotropic responsiveness to isoproterenol (Figs. 3 and 6), the mutated cardiomyocytes from both patients exhibited an attenuated positive chronotropic response (Fig. 7B) compared to control cardiomyocytes. In these experiments, the cells were initially perfused for 30 min. with serum‐free DMEM solution at 37°C, followed by 10 min. of perfusion with increasing concentrations of isoproterenol (10−9 M–10−6M). Concomitant with the smaller chronotropic response, isoproterenol (10−6M) caused arrhythmias expressed by the irregular spontaneous firing rate (Fig. 7C–E), compatible with the arrhythmia at the single cell level. As expected, these arrhythmias were blocked by metoprolol. These findings were repeated in 9 control and 15 mutated cardiomyocytes.
Figure 7.
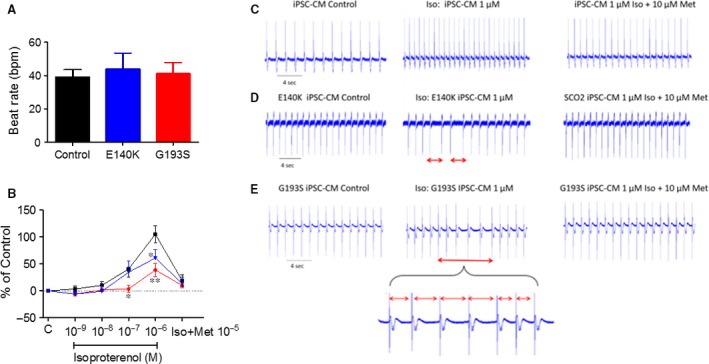
The chronotropic response of extracellular electrograms recorded from control, SCO2E140K and SCO2G193S iPSC‐CMs to isoproterenol. (A) The spontaneous beating rate of control (n = 11), SCO2E140K (n = 7) and SCO2G193S (n = 10) iPSC‐CMs. (B) The effect of isoproterenol on the beat rate of iPSC‐CMs and the blocking effect of the β‐blocker metoprolol. (C–E) The EB was perfused initially with DMEM solution (Control) and then with isoproterenol 10−6 M in DMEM solution. The different time intervals denote the arrhythmia in the isoproterenol‐treated SCO2‐mutated EBs. The arrhythmia was blocked by the β‐blocker metoprolol. (C) Control, (D) SCO2E140K and (E) SCO2G193S iPSC‐CMs. Results are expressed as per cent change from control (absence of isoproterenol). The arrhythmia is marked by red bar; bpm: beats per minute; C: control conditions—DMEM solution in the absence of isoproterenol; Iso: Isoproterenol; Met: Metoprolol; *P < 0.05, **P < 0.001 (versus control).
BRV characteristic in SCO2‐mutated versus control cardiomyocytes
As we previously demonstrated that disturbed intracellular Ca2+ handling (likely to occur in the SCO2‐mutated cardiomyocytes) augments the BRV indices 11, 12, we compared the BRV characteristic in mutated versus control cardiomyocytes. To this end, spontaneous electrograms were recorded for 30 min., and BRV analysis performed in the three experimental groups. The first indication of increased BRV in the mutated cardiomyocytes is demonstrated by the dissimilar inter‐beat intervals (IBIs), compared to the fixed intervals in the control cells (Fig. 8A). The increased BRV in the mutated cardiomyocytes is further illustrated by the IBI versus time plots (Fig. 8B, E and H), and the histograms (Fig. 8C, F and I) depicting the number of events at different interval ranges. As shown by the histograms, the range of IBIs was broader in SCO2 mutated than in control cardiomyocytes. Specifically, while in control cells, the IBIs range was ~300 msec, the ranges in the SCO2G193S and the SCO2E140K were ~2000 msec. and in 2000–3000 msec., respectively. Accordingly, the IBIs coefficient of variation (CV) values were larger (P < 0.05) in the mutated than in control cardiomyocytes (Fig. 8M).
Figure 8.
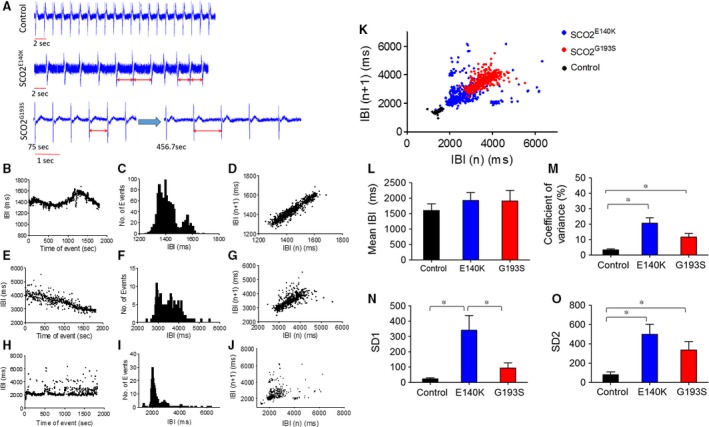
The spontaneous electrical activity and BRV properties of control, SCO2E140K and SCO2G193S iPSC‐CMs. (A) EBs were perfused with DMEM solution, activation spikes and repolarization waves were recorded in control, SCO2E140K and SCO2G193S iPSC‐CMs (first recorded at 75 sec. and then at 456 sec.). Inter‐beat intervals (IBIs), histograms and Poincaré plots analysis in control (B–D), SCO2G193S (E–G) and SCO2E140K iPSC‐CMs (H–J). (B, E, H) IBIs time series, (C, F, I) Histogram distribution of IBIs, (D, G, J) Poincaré plots of the BRV. (K) Combined Poincaré plots of (D, G, J). (L–O) Comparisons of BRV magnitude in control (n = 8), SCO2E140K (n = 5) and SCO2G193S (n = 8). (L) Summary of mean IBI, (M) coefficient of variance of IBIs (IBI CV), (N) SD1 and (O) SD2 of Poincaré plots in contracting EBs. Altered time intervals were marked by red bar. *P < 0.05.
The BRV magnitude was further analysed by generating Poincaré plots and calculating SD1 and SD2 representing the standard deviation (S.D.) of short‐term and long‐term IBI variability, respectively. In support of the higher CV values, the representative (Fig. 8D, G and J) and superimposed Poincaré plots (Fig. 8K) illustrate the much larger dispersion of the data points in the mutated cardiomyocytes. Accordingly, except for the mean IBI that showed no significant difference between control and mutated clones (Fig. 8L) and for SD1 which was not different between control and SCO2G193S iPSC‐CMs, the Poincaré plot indices were higher in the mutated (from both patients) than in the control cardiomyoctes (Fig. 8M–O).
Discussion
Mutations in the SCO2 gene are among the most common causes of COX deficiency 18 leading to HCM, heart and respiratory failure, and death at infancy 19. To investigate the mechanisms underlying the pathological features of the affected cardiomyocytes, we tested the hypothesis that the SCO2 mutation is associated with mitochondrial abnormalities, and intracellular Ca2+‐overload resulting in functional derangements and arrhythmias. The major findings in SCO2 cardiomyocytes were as follows: (i) ultrastructural abnormalities, mainly enlarged mitochondria and distorted cristae; (ii) attenuated inotropic response to β‐adrenergic stimulation, [Ca2+]o and AT‐II; (iii) abnormal responses to caffeine administration; and (iv) DADs and triggered arrhythmias.
Ultrastructural abnormalities in SCO2‐mutated cardiomyocytes
Comprehensive TEM analysis in SCO2G193S cardiomyocytes demonstrated age‐dependent (15‐, 30‐ and 45‐day‐old cultures) abnormalities including enlargement of mitochondria, disorganized mitochondrial cristae, intra‐mitochondrial vacuoles, glycogen deposits and lipid droplets. In contrast, SCO2E140K cardiomyocytes had normal mitochondrial distribution and structure, but large cellular glycogen deposits and lipid droplets. Currently, there is no explanation for these differences; other than that mitochondrial abnormalities seen in mitochondrial diseases are generally heterogeneous and there is often no clear genotype–phenotype correlation. Hence, the mutations in SCO2 are in different domains of the protein; the E140K mutation is close to the copper binding site, while the G193S mutation is in a different segment of the protein, which may also result in different effects of the mutations.
Mitochondrial structural abnormalities, including massive proliferation, are a secondary effect of the complex IV deficiency, and there is no universal explanation for how these structural changes come about. Possibly, ATP shortage due to COX deficiency in the oxidative phosphorylation pathway leads to a compensatory response causing swelling of mitochondria in an effort to produce more ATP. Further, mitochondrial proliferation is often (but certainly not always) seen in mitochondrial diseases, and it is thought to be a compensatory mechanism involving PGC1 alpha/AMPK signalling 20. Glycogen deposits are typical in SCO2‐mutated human cells 21. Notably, the TEM findings in cardiomyocytes are in agreement with the pathological findings demonstrated in the muscle biopsies taken from the hospitalized patients who showed mitochondrial abnormalities and low COX activity. This similarity further strengthens the validity of our model as an in vitro recapitulation of the in vivo disease.
Attenuated response of SCO2‐mutated iPSC‐CMs to positive inotropic interventions
In agreement with our previous studies and others 5, 17, 22 in control iPSC‐CMs, β‐adrenergic stimulation, increased [Ca2+]o and AT‐II caused prominent positive inotropic and lusitropic effects (Fig. 3 and 4). In marked contrast to the control responses, the mutated cardiomyocytes from both patients were completely unresponsive to all three positive inotropic interventions. As will be discussed below, the most probable explanation for these findings is that a downstream common step in these different inotropic cascades is impaired in SCO2‐mutated cardiomyocytes. In brief, higher [Ca2+]o augments the Ca2+ chemical gradient, leading to increased ICa,L amplitude, resulting in enhanced SR Ca2+ release which increases the contractile force. Isoproterenol activates the β‐adrenergic cascade which via increased protein kinase A (PKA) activation, augments ICa,L which enhances SR Ca2+ release, thereby augmenting contraction 15. On the other hand, AT‐II induces a positive inotropic effect by binding to its respective membrane receptor, and activating phospholipase C (PLC) 17, which synthesizes 1,4,5‐IP3, in turn increasing intracellular Ca2+ by opening SR 1,4,5‐IP3‐dependent Ca2+ channels. Collectively, the common denominator of these three positive inotropic interventions is increased SR Ca2+ release.
The mechanism underlying the attenuated positive inotropic responsiveness
To test the hypothesis that impaired SR Ca2+ content/release is responsible for the attenuated inotropic responses, we tested the effect (in control and SCO2‐mutated cardiomyocytes) of caffeine which releases Ca2+ from the SR by reducing the activation threshold of RyR2 23. Indeed, as illustrated in control cardiomyocytes, in agreement with our previous study 5 caffeine induced a long‐lasting rise in [Ca2+]i along with a transient depression of the contractions, followed by a gradual resumption of contractions. In contrast, the responses of mutated cardiomyocytes were completely different, featuring two major phenomena. Both phenotypes depicted a small and short (compared to control) Ca2+ spike: the first phenotype showed a FR and the second phenotype depicted a SR of contractions. The residual 10–20% (depending on the mutation) exhibited a control‐like phenotype. Thus, while control cardiomyocytes depicted a single typical response to caffeine, the mutated cells exhibited dissimilar (two types) responses to caffeine. These two abnormal responses of the mutated cardiomyocytes were demonstrated previously in sarcomeric‐HCM mutated cardiomyocytes 24.
While currently we cannot offer an explanation for the SR and FR phenotypes, it is likely they are both caused by disturbed intracellular Ca2+ handling resulting from the SCO2 mutation and COX impairment. Specifically, the most likely element underlying these Ca2+ handling abnormalities is the ATP‐dependent SERCA pump, responsible for Ca2+ re‐uptake into the SR 25, 26, and thus ATP shortage is expected to reduce its activity. Therefore, the depressed ATP synthesis and consequently reduced SERCA activity results in lower SR Ca2+ stores, leading to attenuated RyR2‐mediated Ca2+‐induced‐Ca2+‐release. Collectively, whereas the three positive inotropic stimuli tested (β‐adrenergic stimulation, increased [Ca2+]o and AT‐II) augment contraction via different pathways (Fig. 9), they share one common downstream element, which is impaired in SCO2‐mutated cardiomyocytes—ATP‐dependent SR Ca2+ storage capacity. Finally, an important observation that needs to be reconciled with the attenuated positive inotropic response is the control‐like basal [Ca2+]i transient and contraction characteristics in the SCO2‐mutated cardiomyocytes (Fig. S5). These results suggest that under unstressed conditions, the basal SR Ca2+ content maintained by the existing ATP levels (produced by a combination of glycolysis and oxidative phosphorylation) is sufficient to support the excitation‐contraction coupling machinery 26. However, these depressed SERCA‐dependent Ca2+ levels are insufficient to provide the excessive Ca2+ required to generate a positive inotropic effect. Finally, our findings are consistent with previous studies demonstrating ATP shortage as a cause of HCM 27, 28, 29, 30. Low ATP levels lead to abnormally high levels of cytosolic Ca2+ due to impaired SERCA activity. The high Ca2+ concentration activates various downstream proteins and pathways including Ca2+/calmodulin‐dependent protein phosphatase (calcineurin), different nuclear factors of activated T cells (NFAT), Ca2+/calmodulin‐dependent protein kinase (CaMK) and p38 mitogen‐activated protein kinase, which eventually results in HCM and cardiac dysfunction 31.
Figure 9.
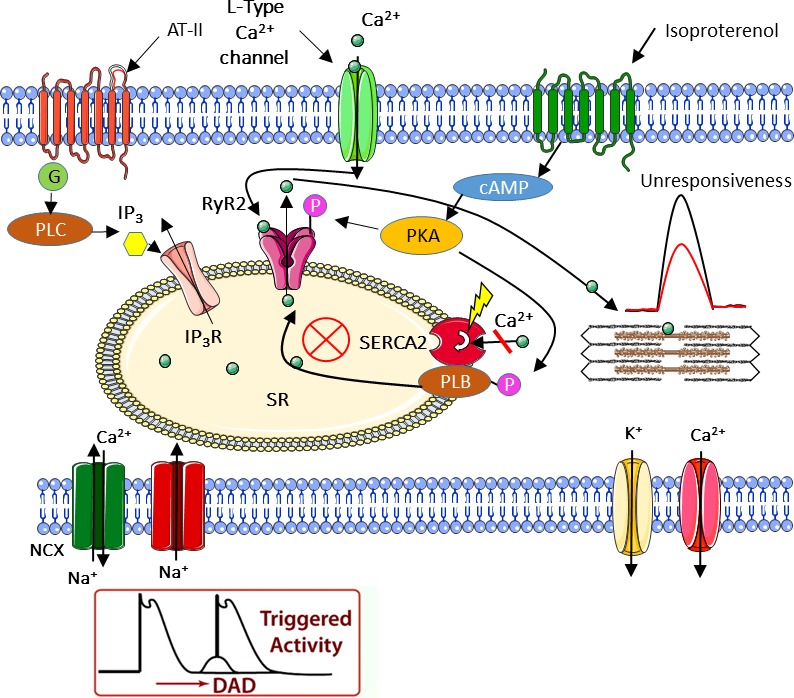
Schematic model of a proposed mechanism for the observed abnormalities in SCO2 iPSC‐CMs. The scheme describes the three distinct cellular pathways converging at the sarcoplasmic reticulum (SR). The scheme suggests an explanation for the delayed afterdepolarizations (DADs) and the attenuated inotropic responsiveness of SCO2‐mutated cardiomyocytes. While in control cardiomyocytes, these different pathways cause positive inotropic and lusitropic effects due to SR Ca2+ release, in SCO2‐mutated iPSC‐CMs, Ca2+ depleted SR accounts for the impaired inotropic responses.
As depicted in Figure 9, we propose a unified theory underlying the described abnormalities in SCO2 iPSC‐CMs. The attenuated response of the mutated cardiomyocytes to positive inotropic stimulation (in the form of isoproterenol, AT‐II and Ca2+ administration) all indicate abnormalities in different cellular pathways converging at the SR. Together with damaged mitochondria demonstrated by TEM analysis, we singled out SERCA, the ATP‐dependent pump responsible for Ca2+ re‐uptake into the SR, as a suspected dysfunctional key element resulting in intracellular Ca2+ overload. In agreement with this conclusion, spontaneous action potential recordings demonstrated DADs, known to originate from Ca2+ overload as well.
In summary, collectively, our novel findings reveal abnormal intracellular Ca2+ handling in SCO2‐mutated cardiomyocytes, accounted for by ATP shortage due to the impaired mitochondrial respiratory chain function. These findings are consistent with other HCM iPSC‐CMs studies which demonstrated irregular Ca2+ handling as a fundamental mechanism underlying the disease pathology 32. However, in this study, we present for the first time Ca2+ abnormalities as a prominent aspect of mitochondrial‐related HCM. Furthermore, the similar properties of different HCM subtypes may indicate a basic common mechanism to which pathological Ca2+ handling can be attributed. Additional research is required to determine whether a common mechanism is indeed responsible for the similar phenotypes or perhaps the resembling outcomes originate from different causes leading to the same HCM disease.
Conflict of interest
None declared.
Supporting information
Figure S1 Clinical data of the SCO2 patient at 4 months of age (prior to death).
Figure S2 Pluripotency of iPSC derived from the SCO2 patient and a healthy control.
Figure S3 Genetic, immunofluorescence and histological characterization of SCO2 iPSC.
Figure S4 Genetic and histological characterization of iPSC derived from SCO2 patients and a healthy control.
Figure S5 Transmission electron microscopy (TEM) demonstrating ultrastructural abnormalities in SCO2 iPSC‐CM.
Figure S6 Basal [Ca2+]i transients and contractions in control and SCO2 iPSC‐CMs.
Figure S7 Pluripotency of iPSC derived from human dermal fibroblasts and hair keratinocytes.
Figure S8 Effect of isoproterenol on [Ca+2]i transients and contractions in KT and HDF iPSC‐CMs.
Table S1. Mean diameter of mitochondria in control and SCO2‐mutated iPSC‐CMs.
Acknowledgements
Funding source: This work was supported by the Israel Science Foundation (ISF) [grant number 292/13]; the Israeli Ministry of Science, Technology and Space [grant number 7‐10772]; and the Niedersachsen Ministry of Science and Culture [grant number 11‐76251‐99‐16/14].
The authors wish to thank Mrs. Margarita Shulman for the excellent technical assistance.
References
- 1. Holmgren D. Cardiomyopathy in children with mitochondrial disease Clinical course and cardiological findings. Eur Heart J. 2003; 24: 280–8. [DOI] [PubMed] [Google Scholar]
- 2. Leary SC, Cobine PA, Kaufman BA, et al The human cytochrome c oxidase assembly factors SCO1 and SCO2 have regulatory roles in the maintenance of cellular copper homeostasis. Cell Metab. 2007; 5: 9–20. [DOI] [PubMed] [Google Scholar]
- 3. Casarin A, Giorgi G, Pertegato V, et al Copper and bezafibrate cooperate to rescue cytochrome c oxidase deficiency in cells of patients with SCO2 mutations. Orphanet J Rare Dis. 2012; 7: 1–8. [DOI] [PMC free article] [PubMed] [Google Scholar]
- 4. Jaksch M, Ogilvie I, Yao J, et al Mutations in SCO2 are associated with a distinct form of hypertrophic cardiomyopathy and cytochrome c oxidase deficiency. Hum Mol Genet. 2000; 9: 795–801. [DOI] [PubMed] [Google Scholar]
- 5. Novak A, Barad L, Lorber A, et al Functional abnormalities in iPSC‐derived cardiomyocytes generated from CPVT1 and CPVT2 patients carrying ryanodine or calsequestrin mutations. J Cell Mol Med. 2015; 19: 2006–18. [DOI] [PMC free article] [PubMed] [Google Scholar]
- 6. Novak A, Shtrichman R, Germanguz I, et al Enhanced reprogramming and cardiac differentiation of human keratinocytes derived from plucked hair follicles, using a single excisable lentivirus. Cell Reprogram. 2010; 12: 665–78. [DOI] [PubMed] [Google Scholar]
- 7. Sommer CA, Stadtfeld M, Murphy GJ, et al Induced pluripotent stem cell generation using a single lentiviral stem cell cassette. Stem Cells. 2009; 27: 543–9. [DOI] [PMC free article] [PubMed] [Google Scholar]
- 8. Itskovitz‐Eldor J, Schuldiner M, Karsenti D, et al Differentiation of human embryonic stem cells into embryoid bodies compromising the three embryonic germ layers. Mol Med. 2000; 6: 88–95. [PMC free article] [PubMed] [Google Scholar]
- 9. Dolnikov K, Shilkrut M, Zeevi‐Levin N, et al Functional properties of human embryonic stem cell‐derived cardiomyocytes: intracellular Ca2+ handling and the role of sarcoplasmic reticulum in the contraction. Stem Cells. 2006; 24: 236–45. [DOI] [PubMed] [Google Scholar]
- 10. Novak A, Barad L, Zeevi‐Levin N, et al Cardiomyocytes generated from CPVT D307H patients are arrhythmogenic in response to β‐adrenergic stimulation. J Cell Mol Med. 2012; 16: 468–82. [DOI] [PMC free article] [PubMed] [Google Scholar]
- 11. Ben‐Ari M, Schick R, Barad L, et al From beat rate variability in induced pluripotent stem cell‐derived pacemaker cells to heart rate variability in human subjects. Heart Rhythm. 2014; 11: 1808–18. [DOI] [PMC free article] [PubMed] [Google Scholar]
- 12. Ben‐Ari M, Naor S, Zeevi‐Levin N, et al Developmental changes in electrophysiological characteristics of human induced pluripotent stem cell‐derived cardiomyocytes. Hear Rhythm Soc. 2016; 13: 2379–87. [DOI] [PMC free article] [PubMed] [Google Scholar]
- 13. Gherghiceanu M, Barad L, Novak A, et al Cardiomyocytes derived from human embryonic and induced pluripotent stem cells: comparative ultrastructure. J Cell Mol Med. 2011; 15: 2539–51. [DOI] [PMC free article] [PubMed] [Google Scholar]
- 14. Joost K, Rodenburg R, Piirsoo A, et al A novel mutation in the SCO2 gene in a neonate with early‐onset cardioencephalomyopathy. Pediatr Neurol. 2010; 42: 227–30. [DOI] [PubMed] [Google Scholar]
- 15. Lehnart S, Marks AR. Regulation of ryanodine receptors in the heart. Circ Res. 2007; 101: 746–9. [DOI] [PubMed] [Google Scholar]
- 16. Stoehr A, Neuber C, Baldauf C, et al Automated analysis of contractile force and Ca2+ transients in engineered heart tissue. Am J Physiol Heart Circ Physiol. 2014; 306: H1353–63. [DOI] [PMC free article] [PubMed] [Google Scholar]
- 17. Sedan O, Dolnikov K, Zeevi‐Levin N, et al 1,4,5‐Inositol trisphosphate‐operated intracellular Ca2+ stores and angiotensin‐II/endothelin‐1 signaling pathway are functional in human embryonic stem cell‐derived cardiomyocytes. Stem Cells. 2008; 26: 3130–8. [DOI] [PubMed] [Google Scholar]
- 18. Dickinson EK, Adams DL, Schon EA, et al A human SCO2 mutation helps define the role of Sco1p in the cytochrome oxidase assembly pathway. J Biol Chem. 2000; 275: 26780–5. [DOI] [PubMed] [Google Scholar]
- 19. Papadopoulou LC, Sue CM, Davidson MM, et al Fatal infantile cardioencephalomyopathy with COX deficiency and mutations in SCO2, a COX assembly gene. Nat Genet. 1999; 23: 333–7. [DOI] [PubMed] [Google Scholar]
- 20. Wu SB, Wu YT, Wu TP, et al Role of AMPK‐mediated adaptive responses in human cells with mitochondrial dysfunction to oxidative stress. Biochim Biophys Acta. 2014; 1840: 1331–44. [DOI] [PubMed] [Google Scholar]
- 21. Vesela K, Hulkova H, Hansikova H, et al Structural analysis of tissues affected by cytochrome C oxidase deficiency due to mutations in the SCO2 gene. APMIS. 2008; 116: 41–9. [DOI] [PubMed] [Google Scholar]
- 22. Germanguz I, Sedan O, Zeevi‐Levin N, et al Molecular characterization and functional properties of cardiomyocytes derived from human inducible pluripotent stem cells. J Cell Mol Med. 2011; 15: 38–51. [DOI] [PMC free article] [PubMed] [Google Scholar]
- 23. Endo M. Calcium‐induced calcium release in skeletal muscle. Physiol Rev. 2009; 89: 1153–76. [DOI] [PubMed] [Google Scholar]
- 24. Han L, Li Y, Tchao J, et al Study familial hypertrophic cardiomyopathy using patient‐specific induced pluripotent stem cells. Cardiovasc Res. 2014; 104: 258–69. [DOI] [PMC free article] [PubMed] [Google Scholar]
- 25. Brini M, Calì T, Ottolini D, et al Calcium pumps: why so many? Compr Physiol. 2012; 2: 1045–60. [DOI] [PubMed] [Google Scholar]
- 26. Willems PHGM, Valsecchi F, Distelmaier F, et al Mitochondrial Ca2+ homeostasis in human NADH: ubiquinone oxidoreductase deficiency. Cell Calcium. 2008; 44: 123–33. [DOI] [PubMed] [Google Scholar]
- 27. Marín‐Garcia J, Goldenthal M. Understanding the impact of mitochondrial defects in cardiovascular disease: a review. J Card Fail. 2002; 8: 347–61. [DOI] [PubMed] [Google Scholar]
- 28. Blair E, Redwood C, Ashrafian H, et al Mutations in the γ 2 subunit of AMP‐activated protein kinase cause familial hypertrophic cardiomyopathy: evidence for the central role of energy compromise in disease pathogenesis. Hum Mol Genet. 2001; 10: 1215–20. [DOI] [PubMed] [Google Scholar]
- 29. Spindler M, Saupe KW, Christe ME, et al Diastolic dysfunction and altered energetics in the alphaMHC403/+ mouse model of familial hypertrophic cardiomyopathy. J Clin Invest. 1998; 101: 1775–83. [DOI] [PMC free article] [PubMed] [Google Scholar]
- 30. Crilley JG, Boehm EA, Blair E, et al Hypertrophic cardiomyopathy due to sarcomeric gene mutations is characterized by impaired energy metabolism irrespective of the degree of hypertrophy. J Am Coll Cardiol. 2003; 41: 1776–82. [DOI] [PubMed] [Google Scholar]
- 31. Ashrafian H, Redwood C, Blair E, et al Hypertrophic cardiomyopathy: a paradigm for myocardial energy depletion. Trends Genet. 2003; 19: 263–8. [DOI] [PubMed] [Google Scholar]
- 32. Lan F, Lee AS, Liang P, et al Abnormal calcium handling properties underlie familial hypertrophic cardiomyopathy pathology in patient‐specific induced pluripotent stem cells. Cell Stem Cell. 2013; 12: 101–13. [DOI] [PMC free article] [PubMed] [Google Scholar]
Associated Data
This section collects any data citations, data availability statements, or supplementary materials included in this article.
Supplementary Materials
Figure S1 Clinical data of the SCO2 patient at 4 months of age (prior to death).
Figure S2 Pluripotency of iPSC derived from the SCO2 patient and a healthy control.
Figure S3 Genetic, immunofluorescence and histological characterization of SCO2 iPSC.
Figure S4 Genetic and histological characterization of iPSC derived from SCO2 patients and a healthy control.
Figure S5 Transmission electron microscopy (TEM) demonstrating ultrastructural abnormalities in SCO2 iPSC‐CM.
Figure S6 Basal [Ca2+]i transients and contractions in control and SCO2 iPSC‐CMs.
Figure S7 Pluripotency of iPSC derived from human dermal fibroblasts and hair keratinocytes.
Figure S8 Effect of isoproterenol on [Ca+2]i transients and contractions in KT and HDF iPSC‐CMs.
Table S1. Mean diameter of mitochondria in control and SCO2‐mutated iPSC‐CMs.