
FIG 6 .
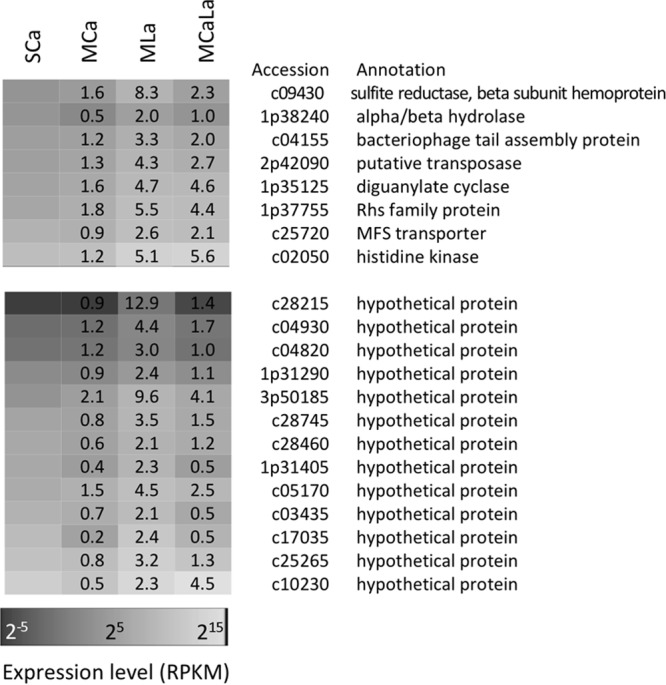
Heat map of expression level of the genes extracted under restrictions of MLa versus MCa >2.5-fold change, MCaLa versus MCa >2.5-fold change, MLa versus SCa >2-fold change, GC content of >60%, and genes not tRNA genes. The genes are sorted to their expression level under the SCa condition. Fold change values against SCa condition are shown in the heat map.