

Abstract
Fatty acid synthase (FASN) is a key lipogenic enzyme for de novo fatty acid biosynthesis and a druggable metabolic oncoprotein that is activated in most human cancers. We evaluated whether the HER2-driven lipogenic phenotype might represent a biomarker for sensitivity to pharmacological FASN blockade. A majority of clinically HER2-positive tumors were scored as FASN overexpressors in a series of almost 200 patients with invasive breast carcinoma. Re-classification of HER2-positive breast tumors based on FASN gene expression predicted a significantly inferior relapse-free and distant metastasis-free survival in HER2+/FASN+ patients. Notably, non-tumorigenic MCF10A breast epithelial cells engineered to overexpress HER2 upregulated FASN gene expression, and the FASN inhibitor C75 abolished HER2-induced anchorage-independent growth and survival. Furthermore, in the presence of high concentrations of C75, HER2-negative MCF-7 breast cancer cells overexpressing HER2 (MCF-7/HER2) had significantly higher levels of apoptosis than HER2-negative cells. Finally, C75 at non-cytotoxic concentrations significantly reduced the capacity of MCF-7/HER2 cells to form mammospheres, an in vitro indicator of cancer stem-like cells. Collectively, our findings strongly suggest that the HER2-FASN lipogenic axis delineates a group of breast cancer patients that might benefit from treatment with therapeutic regimens containing FASN inhibitors.
Keywords: Fatty acid synthase, HER2, breast cancer, C75
INTRODUCTION
The up-regulation of fatty acid synthase (FASN), a key lipogenic enzyme in de novo biogenesis of fatty acids, appears to necessarily accompany the natural history of most human cancers (Menendez and Lupu, 2007). FASN-driven endogenous lipogenesis confers growth and survival advantages to cancer cells (Menendez and Lupu, 2004, 2006; Menendez, 2010), and FASN signaling regulates well-established cancer-controlling networks (Menendez et al., 2004a, b; Lupu and Menendez, 2006; Vazquez-Martin et al., 2009). Indeed, the discovery that sole overexpression of FASN induces a transformation-like phenotype in epithelial cells (Vazquez-Martin et al., 2008; Migita et al., 2009) has led to the suggestion that FASN operates as a bona fide oncogene (Baron et al., 2004; Menendez and Lupu, 2006; Patel et al., 2015).
Increasing experimental evidence for a metabolo-oncogenic role of FASN in human carcinomas and their precursor lesions implies that pharmacological targeting of FASN might offer new therapeutic options for metabolically preventing and/or treating cancer. Consequently, a variety of FASN inhibitors have been developed in recent years. Among them is the natural product cerulenin and its semi-synthetic derivative C75 (α-methylene-γ-butyrolactone), and C93, C247 and FAS31, which were developed in an effort to overcome the lack of potency of C75 and its undesirable side-effects (Alli et al., 2005; Orita et al., 2007). Orlistat, an FDA-approved pancreatic lipase inhibitor, was originally developed as an anti-obesity drug (Kridel et al., 2004; Menendez et al., 2005a). Additionally, the anti-microbial agent triclosan (Sadowski et al., 2014) and the dibenzenesulfonamide urea GSK837149A (Vázquez et al., 2008) have consistently demonstrated preclinical activity in cultured cancer cell lines and xenograft models (reviewed in Lupu and Menendez, 2006b; Flavin et al., 2010; Pandey et al., 2012). Although none of these compounds have been tested in cancer patients because of limitations imparted by their pharmacological properties (e.g., poor cell permeability, poor oral bioavailability and lack of selectivity) or side-effect profiles (e.g., anorexia and weight-loss), which could be limiting in the development of cancer therapy, a new generation of FASN inhibitors have only just entered the clinic (Arkenau et al., 2015; O’Farrell et al., 2015; Patel et al., 2015). Therefore, it will important to not only monitor the levels at which the FASN target is inhibited, but also to effectively select patients who are likely to benefit, which could assist in prioritizing the yet-scarce anti-FASN drug discovery resources (Jones and Infante, 2015).
Previous studies from our laboratory suggested a strong correlation between the sensitivity of breast cancer cell lines to pharmacological FASN blockade and the expression of the HER2 oncogene (Menendez et al., 2004a, c, 2005b). To validate the HER2-driven lipogenic phenotype as a phenotypic biomarker of sensitivity to FASN inhibition, we investigated the clinical and therapeutic relevance of FASN expression and activity in HER2-overexpressing breast carcinomas.
RESULTS
FASN overexpression is frequent in HER2-positive breast carcinomas
Breast cancer tissue sections of 189 patients with primary invasive breast carcinomas (Menendez et al., 2006) were evaluated for the expression of HER2 and FASN by immunohistochemistry. Representative examples of invasive breast carcinomas expressing different levels of FASN immunostaining are shown in Fig. 1. Sixty (32%) tumors were HER2-positive and 113 tumors (60%) were classified as FASN overexpressors (Fig. 1). The majority of clinically HER2-positive tumors (85%) were scored as FASN overexpressors, with the remaining 15% classified as negative or low-to-moderate FASN expressors. By contrast, an almost identical distribution of FASN-overexpressors (48%) and non-FASN overexpressors (52%) was observed in clinically HER2-negative tumors. A significant association between HER2- and FASN-overexpression was found by Chi-square test (P<0.001).
Figure 1.
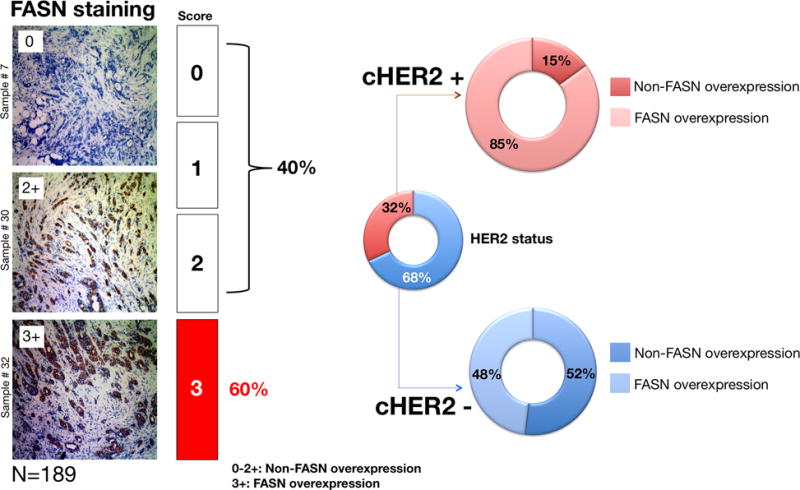
Immunophenotypic classification of FASN-overexpression in HER2-negative and HER2-positive invasive breast carcinomas.
FASN overexpression confers poor prognosis in HER2-positive breast tumors
The close relationship between FASN overexpression and clinical status of HER2 expression prompted us to investigate whether FASN might confer clinical aggressiveness and, therefore, more adverse prognoses in HER2-positive breast carcinomas. We utilized the on-line Kaplan-Meier plotter (http://kmplot.com/; Gyorffy et al., 2010) to evaluate whether the re-classification of HER2-positive tumors by the median expression of the FASN gene (217006_x_at) using the best performing threshold as a cutoff (Mihály et al., 2013) was sufficient to predict significantly different relapse-free survival (RFS) and distant metastasis-free survival (DMSF) outcomes.
We assessed the clinical impact of high-FASN expression on RFS and DMSF through the molecularly distinct intrinsic subtypes of breast cancer (Mihály and Győrffy, 2013), which were classified based on 2013 St. Gallen criteria using the expression of HER2, estrogen receptor (ESR1), and Ki67 (MKI67), i.e., luminal A (ESR1+, HER2-, MKI67 low), luminal B (ESR+, HER2-, MKI67 high), basal (ESR-, HER2-), and HER2+ (HER2+, ESR1-). High-FASN expression was found to significantly worsen the RFS (Fig. 2) and DMFS (Fig. 3) of HER2+ breast tumors (HR=1.95; p=0.0037 and HR=2.19; p=0.036, respectively). FASN expression, however, failed to distinguish good- and bad-prognoses in other breast cancer subtypes, including the intrinsically aggressive basal-like breast carcinomas (Fig. 3).
Figure 2.
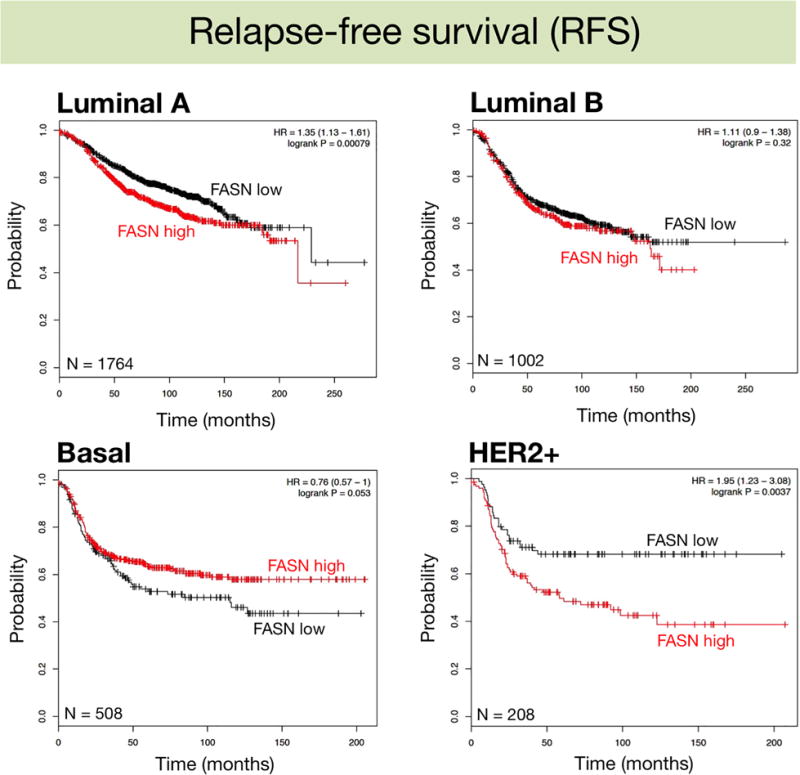
Kaplan-Meier Relapse-free survival curves of breast cancer subtypes stratified by low/high FASN gene expression.
Figure 3.
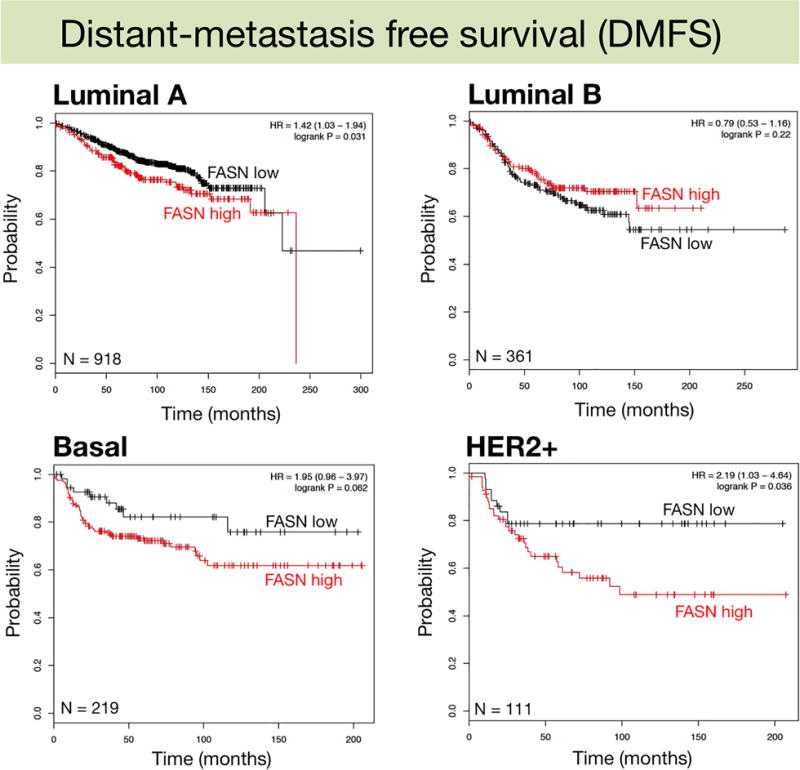
Kaplan-Meier Distant metastasis-free survival curves of breast cancer subtypes stratified by low/high FASN gene expression.
FASN inhibition suppresses HER2-induced oncogenic properties in breast epithelial cells
To evaluate the biological consequences of FASN activation on HER2-driven breast tumor development we utilized MCF10A cells, which are a useful in vitro model to analyze the transforming effects of HER2 overexpression (Ciardiello et al., 1992; Giunciuglio et al., 1995) as they are dependent on EGF and express very low levels of HER1, HER2, and HER3. Consequently, the overexpression of HER2 in MCF10A cells recapitulates the common clinical HER1- and HER2-positive breast cancer phenotype.
MCF10A cells engineered to stably overexpress HER2 (Menendez et al., 2015) were transiently transfected with a luciferase reporter containing a 178-bp FASN promoter (FASN-Luc) harboring all the elements necessary for high level expression in cancer cells (Swinnen et al., 1997), including a complex SREBP-binding site. MCF10A/HER2 cells transfected with FASN-Luc had a >2-fold-increase in luciferase activity relative to equivalent HER2-negative MCF10A cells when grown under standard culture conditions (Fig. 4, left panel). Upon EGF stimulation, which recapitulates the paracrine/autocrine stimulation of HER receptor-driven signaling, FASN-Luc promoter activity was 3.5-fold higher in MCF10A/HER2 cells than in HER2-negative MCF10A cells (Fig. 4, left panel). Immunoblotting analyses confirmed that protein level of FASN was significantly increased in MCF10A/HER2 cells (data not shown).
Figure 4. Pharmacological blockade of FASN activity suppresses the HER2-induced transforming phenotype in breast epithelial cells.
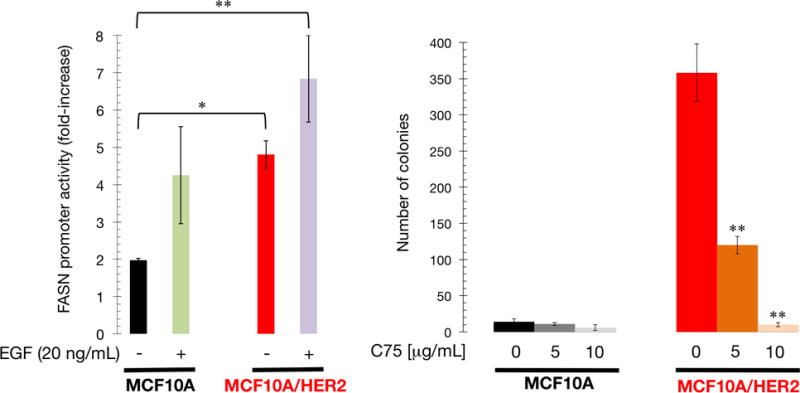
Left. Transcriptional activities were expressed as relative (×-fold) changes in luciferase activity of FASN promoter-transfected MCF10A and MCF10/HER2 cells in response to treatments after normalization to pRL-CMV luciferase activity. Each experimental value represents the mean fold increase (columns) ± SD (bars) from at least three independent experiments measured in triplicate. Right. Soft-agar colony formation assay of MCF10A and MCF10A/HER2 cells cultured with/without C75. Each experimental value represents the mean colony number (columns) ± S. D. (bars) from at least three independent experiments measured in triplicate.
MCF10A cells are unable to grow in an anchorage-independent fashion in the absence of oncogenic stimuli. HER2 overexpression confers anchorage independence, which recapitulates an in vivo transformed phenotype that strongly correlates with in vivo tumorigenicity. To evaluate a role for the lipogenic activity of FASN in HER2-promoted anchorage-independence, cell growth and survival in soft agar were assessed in the presence of C75, a slow-binding FASN inhibitor. MCF10A/HER2 colony formation was significantly impaired by C75 treatment at 5 μg/mL and was completely abolished at 10 μg/mL (Fig. 4, right panel).
FASN-overexpressing, HER2-positive breast cancer cells are exquisitely sensitive to FASN inhibition-induced apoptotic cell death
Given the critical role of FASN activity in the transforming capability of HER2, we questioned whether HER2-overexpressing breast cancer cells might exhibit an increased sensitivity to FASN inhibition. We utilized MCF-7 breast cancer cells engineered to stably overexpress HER2 (MCF-7/HER2) and which have been shown to have functional levels of HER2 comparable with those of HER2 gene-amplified BT-474 breast cancer cells (Benz et al., 1992). Our previous results showed that forced expression of HER2 in MCF-7 breast cancer cells, which naturally express moderate levels of FASN and HER2 (Menendez et al., 2004a), results in a significant enhancement in FASN-Luc reporter activity and significant up-regulation of FASN protein relative to MCF-7/Neo isogenic controls (Menendez et al., 2005a,c). The half-maximal inhibitory concentration (IC50) of C75 was 3.5±1.0 μg/mL in MCF-7/HER2 cells measured by MTT reduction and 10.0±1.8 μg/mL in MCF-7/Neo cells (Fig. 5, top panels).
Figure 5. HER2-overexpressing breast cancer cells are exquisitely sensitive to FASN inhibition-induced cell death.
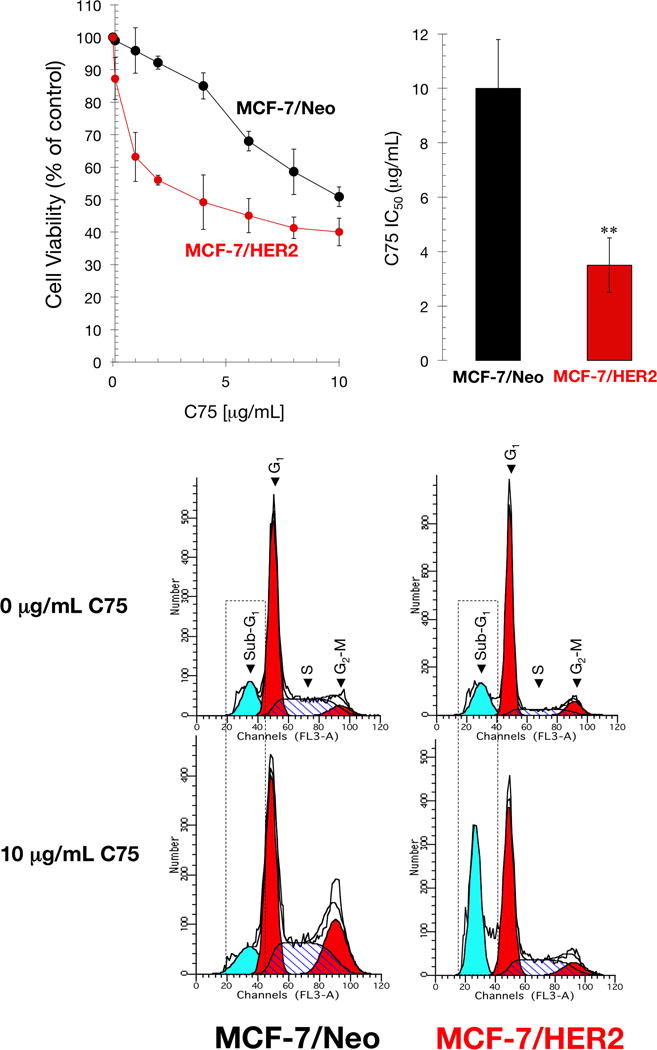
Top. Cell viability and IC50 values were determined using MTT reduction. Data summarize the mean±SD of five independent experiments measured in triplicate. Bottom. Cell cycle analysis of MCF-7/neo and MCF-7/HER2 cells by flow cytometry after 48 h with/without C75 (10 μg/mL). Representative cell cycle profiles are shown for each cell line and treatment. Cell cycle analyses were repeated at least three times. Dashed boxes highlight the sub-G1 (apoptotic) cell populations in each cell line and treatment.
Although the approximate 3-fold reduction in the IC50 value of C75 strongly suggested an exquisite sensitivity of MCF-7/HER2 cells to the FASN inhibitor, it is accepted that cell viability assays are often a measure of cellular metabolic activity and may not necessarily reflect bona fide cytotoxic effects. We therefore assessed whether the differential effects of C75 were due to cell death rather than alterations in NAD+ and/or ATP-generating metabolic processes. To do this, we examined the effects of C75 on cell cycle progression. Using flow cytometry analysis, we found that exposure of MCF-7/Neo control cells to 10 μg/mL C75 resulted in a significant increase in G2/M phase cells concomitant with a decrease in the G0/G1 phase (Fig. 5, bottom panels); however, we failed to detect an increase in cell death (Table 1). By contrast, exposure of MCF-7/HER2 cells to 10 μg/mL C75 substantially increased cell death as demonstrated by the strong accumulation of a sub-G1 population with <2n DNA (57% in MCF-7/HER2 cells versus 12% in MCF-7/Neo cells) representing dead cells (Fig. 5, bottom panels; Table 1).
Table 1.
Effects of C75 on the cell cycle distribution of MCF-7/HER2 and MCF-7/Neo isogenic control cells.
| MCF-7/HER2 | ||
|---|---|---|
| Cell Cycle phase | Untreated (%) | C75 (%) |
| Sub-G1 (apoptosis) | 17 | 36 |
| G0/G1 | 63 | 39 |
| S | 12 | 19 |
| G2/M | 8 | 6 |
| MCF-7/Neo | ||
|---|---|---|
| Cell Cycle phase | Untreated (%) | C75 (%) |
| Sub-G1 (apoptosis) | 13 | 11 |
| G0/G1 | 55 | 38 |
| S | 27 | 30 |
| G2/M | 5 | 21 |
To further confirm that pharmacological inhibition of FASN activity differentially promotes cell death in HER2+/FASN+ breast cancer cells, we compared the number of sub-G1 hypodiploid cells after treatment with C75 in two models of breast cancer cells that either do not express HER2 (e.g., MDA-MB-231) or naturally amplify the HER2 oncogene (e.g., BT-474) (Fig. 6, top panel). Whereas a modest increase in sub-G1 apoptotic cells was observed in C75-treated HER2-/FASN- MDA-MB-231 cells, a dramatic ~20-fold-increase in the number of sub-G1 hypodiploid cells was observed after C75 treatment of HER2+/FASN+ BT-474 cells (Fig. 6, bottom panel). These results not only confirm that C75 regulates cell cycle progression without significantly affecting cell death in HER2-negative breast cancer cells, but also validate the exquisite sensitivity of HER2-positive cells to FASN blockade.
Figure 6. HER2 gene-amplified but not HER2-negative breast cancer cells are sensitive to FASN inhibition-induced apoptosis.
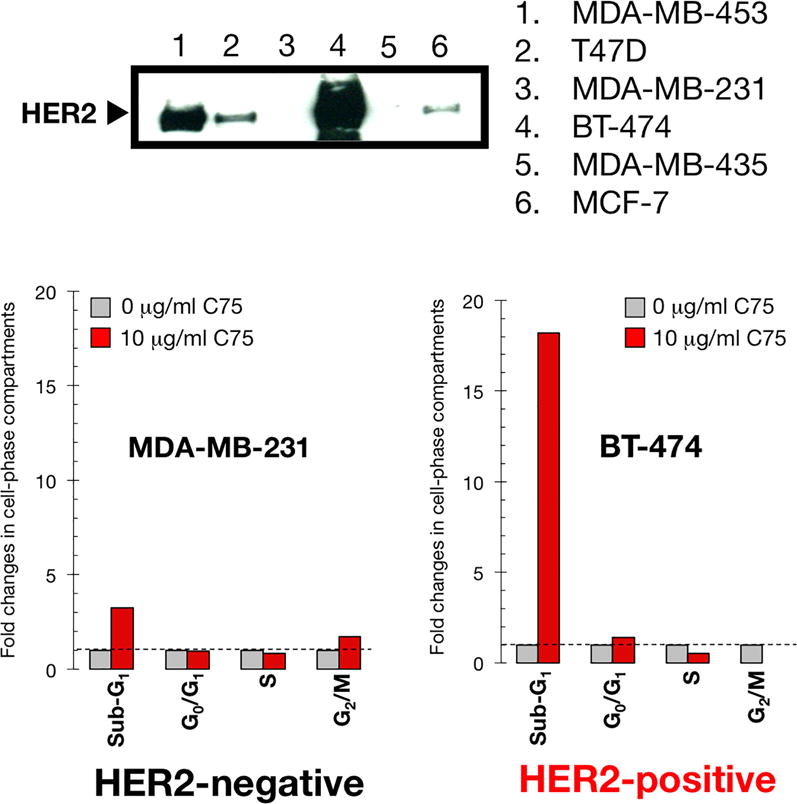
Top. HER2 protein expression in a panel of human breast cancer cell lines. Bottom. Fold-change in the C75-induced percentage of sub-G1, G0/G1, S, and G2/M phases relative to untreated MDA-MB-231 and BT-474 cells (=1-fold in each phase). Cell cycle analyses were repeated at least three times. Standard deviations were less 0.1-fold for each experimental condition.
Specific pharmacological inhibition of FASN activity suppresses the HER2-enhanced formation of cancer stem cell-like cells
The HER2 oncogene plays a key role in the generation and maintenance of so-called cancer stem cells (CSC) during tumor formation and progression (Korkaya et al., 2008; Martin-Castillo et al., 2015). Given this and the increasing evidence suggesting that metabolic reprogramming controls the ability of CSCs to resist cancer therapies and promote cancer recurrence (Corominas-Faja et al., 2015; Menendez, 2015; Menendez and Alarcón, 2014; Menendez et al., 2013, 2014, 2016), we explored whether FASN activity might have an impact on the occurrence of CSC-like cellular states in HER2-positive breast cancer cells by culturing cells in suspension to generate mammospheres. As anticipated, MCF-7/HER2 cells formed significantly more mammospheres than MCF-7 cells (3.0 ± 0.4% versus1.9 ± 0.2%), reflecting the recognized ability of HER2 to expand the breast CSC population (Korkaya et al., 2008; Corominas-Faja et al., 2014). To ensure that any C75-induced change in mammosphere formation was not related to non-specific toxicity, C75 was used at concentrations (0.1 and 1 μg/mL) that did not significantly affect cell viability in monolayer cultures. C75 at 1 μg/mL, but not at 0.1 μg/mL, significantly reduced mammosphere formation approximately 40% in MCF-7 cells (Fig. 7). By contrast, the enhanced spheroid formation ability of MCF-7/HER2 cells was severely and dose-dependently reduced by C75; the highest dose of C75 (1 μg/mL) elicited inhibitory effects of ∼80% relative to the basal mammosphere forming efficiency found in untreated cultures.
Figure 7. Pharmacological blockade of FASN activity suppresses the HER2-driven tumor-initiating capacity of CSCs.
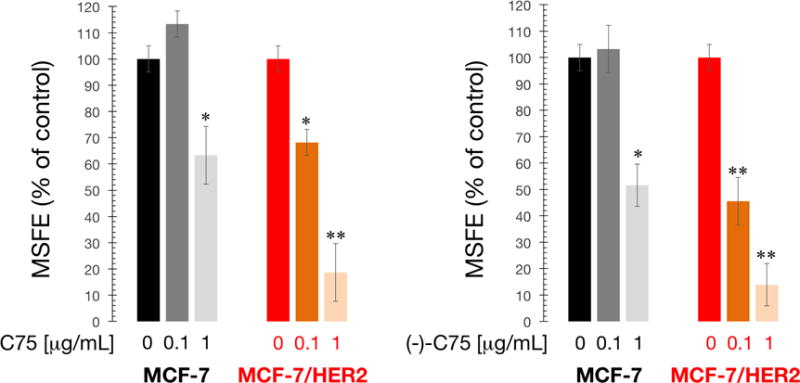
Mammosphere formation of MCF-7 and MCF-7/HER2 cells with/without C75 (left) or (-)-C75 (right). MSFE of vehicle-alone control cells was normalized to one in each cell line.
Racemic mixtures of C75 have been used in all previous studies and different biological activities of C75 enantiomers have been described, i.e., (+)-C75 inhibits carnitine palmitoyltransferase (CPT I), the main regulatory enzyme involved in fatty acid oxidation, and accounts for the central anorectic effects of C75 (Bentebibel et al., 2006; Mera et al., 2009; Makowski et al., 2013), whereas (-)-C75 specifically inhibits FASN activity without affecting CPT I-related food consumption (Makoswski et al., 2013). Because of this, we finally determined whether treatment with the (-)-C75 enantiomer was sufficient to recapitulate the suppressive effects of C75 on self-renewal of HER2-driven CSC-like cell populations. Remarkably, MCF-7/HER2 cells required a 10-fold lower concentration of the FASN-specific (-)-C75 enantiomer than MCF-7/Neo cells to decrease mammosphere-forming efficiency by 50% (Fig. 7), confirming that the C75-driven suppression of HER2-enhanced formation of CSC-like cell was due to its ability to inhibit FASN activity.
DISCUSSION
Our results support the hypothesis that the metabolic oncogene FASN plays an important role in HER2-driven breast cancer progression and may be a novel therapeutic target in HER2-overexpressing breast carcinomas.
Immunohistochemical staining for FASN in almost 200 cases of invasive ductal breast carcinoma confirmed a significant positive correlation with HER2 status. These findings are consistent with recent studies showing a strong correlation between FASN and HER2 gene amplification: FASN expression was highest in immunohistochemically HER2+ tumors and lowest in triple-negative breast carcinomas (Yang et al., 2013; Jung et al., 2015; Kim et al., 2015).
Our results show that different breast cancer subtypes varyingly employ cancer-associated metabolic pathways such as the FASN-driven lipogenic phenotype. Perhaps more importantly, the differential usage of the FASN-driven lipogenic phenotype seems to have clinical implications for different breast cancer subtypes. Specifically, whereas FASN-driven endogenous lipogenesis appears not to be involved in the metabolic programming of basal-like breast carcinomas, which are often associated with an intrinsically aggressive clinical behavior, the activation of the FASN-driven lipogenic phenotype increases the aggressiveness of HER2-positive breast carcinomas. Accordingly, the re-classification of HER2-positive breast tumors based on expression of FASN predicted a significantly inferior relapse-free survival and distant metastasis-free survival in the HER2+/FASN+ patient cohort.
In a clinical scenario in which FASN-driven endogenous lipogenesis drives tumor cell proliferation and eventually metastasis, selective FASN inhibition may be a valuable therapeutic strategy for the HER2+ breast cancer subtype. Accordingly, HER2+/FASN+ breast cancer cells exhibited an exacerbated cytotoxic response to C75, a competitive and irreversible FASN inhibitor. The ability of CSC-like cellular states to survive and proliferate as floating spherical colonies under anchorage-independent conditions is commonly regarded as an in vitro surrogate of the self-renewal and tumor-initiating potential exclusively possessed by CSCs. Our novel findings showing that C75-induced suppression of HER2-driven breast CSC populations specifically occurs via blockade of FASN-driven lipogenesis therefore strongly suggest that the HER2-FASN lipogenic axis represents a powerful, but hitherto largely unexplored, target to eliminate treatment-refractory CSCs.
New generations of FASN inhibitors are in development and one of them, the first oral, selective, potent, reversible FASN inhibitor TVB-2640, has recently entered clinical trials. Data from early-phase clinical trials have shown target engagement and prolonged stable disease when TVB-2640 was used as monotherapy (Arkenau et al., 2015; O’Farrell et al., 2015; Patel et al., 2015). In this scenario, the identification of pathophysiological mechanisms predictive of responsiveness to FASN inhibitors could assist in prioritizing anti-FASN drug discovery resources. Our current findings strongly suggest that HER2 overexpression may permit the delineation of a group of breast cancer patients that might benefit from therapeutic regimens containing FASN inhibitors, which could exert highly toxic effects against HER2-positive bulk tumor cells while at the same time restraining HER2-dependent CSC traits in tumor tissues.
MATERIALS AND METHODS
Interpretation of immunohistochemical results
Immunohistochemical analyses of formalin-fixed tissue sections of paraffin-embedded invasive breast tumor biopsies (n=189) were performed as described (Menendez et al., 2006). The status of HER2 expression was analyzed using the anti-HER2 monoclonal antibody Ab-3 (clone 3B5; Oncogene Science Inc., Manhasset, NY). HER2 immunohistochemistry (IHC) results were classified according to American Society of Clinical Oncology/College of American Pathologists (ASCO/CAP) guidelines, which includes the following categories: 0 = no immunostaining; 1+ = weak/incomplete membrane staining in less than 10% of tumor cells; 2+ = complete membrane staining that is either uniform or weak in at least 10% of all tumor cells; and 3+ = uniform, intense membrane staining in at least 30% of tumor cells. In the present study, HER2 staining was considered positive when strong (3+) membranous staining was observed, whereas IHC 0 or 1+ were considered HER2 negative. Because IHC 2+ is an equivocal classification, in these cases HER2 expression was further evaluated with fluorescence in situ hybridization.
Cytoplasmic intensities of FASN immunoreactivity were classified semi-quantitatively into the four following categories: non-staining (0), weak (score 1+), moderate (score 2+), and strong (score 3+) in more than 30% of stained cells. When heterogeneous intensities of FASN immunoreactivity were observed within examined cases, the strongest intensity was adopted as the score of FASN expression. The staining intensity in normal breast tissue was used as an internal control. A score of 0−2+ was considered non-overexpression, whereas a score of 3+ was considered overexpression.
Survival analyses and Kaplan-Meier survival plots
Survival analyses and Kaplan-Meier survival plots were generated using the publicly accessible Kaplan Meier plotter (http://kmplot.com/analysis/), which can assess the effect of thousands of genes on survival using 4,142 breast cancer patients with a mean follow-up of 69 months. The database is handled by a PostgreSQL server, which integrates gene expression and clinical data simultaneously. To analyze the prognostic value of a particular gene (e.g., FASN), the patient samples (e.g., HER2-positive) are split into two groups according to various quantile expressions of the proposed biomarker. A Kaplan-Meier survival plot compares the two patient cohorts, and the hazard ratio with 95% confidence intervals and logrank P value are calculated.
Cell lines
HER2-overexpressing MCF-7/HER2 (clone 18) cells and their matched controls (empty vector-transfected) MCF-7/Neo cells were provided by Prof. Mien-Chie Hung (The University of Texas MD Anderson Cancer Center, Houston, TX). HER2-overexpressing MCF10A/HER2 cells were generated and characterized as described in Menendez et al. (2015). Cells were screened periodically for Mycoplasma contamination.
FASN promoter luciferase assays
Cells were transfected with FuGENE 6 (Roche Biochemicals, Indianapolis, IN). Overnight serum-starved MCF10A and MCF10A/HER2 cells seeded into 24-well plates (5 × 10⁴ cells/well) were transfected for 18 h in low-serum (0.1% horse serum, HS) medium with 300 ng/well of the pGL3-luciferase (Promega, Madison, WI) vector containing a luciferase reporter gene cloned downstream of an intact (FASN wtSREBP-BS-Luc) 178-bp FASN promoter fragment, and pRL-CMV (30 ng/well), which was used to correct for transfection efficiency. Transfected cells were washed and incubated with/without 20 ng/mL EGF for a further 24 h. Luciferase activity in cell extracts was detected after 24 h using the Luciferase Assay System (Promega, Madison, WI) on the TD-20/20 luminometer (Turner Designs, Sunnyvale, CA). The level of activation in FASN promoter-transfected cells was determined after normalization to the luciferase activity in cells transfected with equivalent amounts of the empty pGL3-luciferase vector (∅-Luc) and the internal control plasmid pRL-CMV, which was taken as 1.0-fold. This control value was used to calculate the fold change in transcriptional activities of FASN promoter-transfected cells in response to treatments after normalization.
Cell viability
Cell viability was determined using a modified MTT reduction assay (Cell Titer 96 Aqueous Non-Radioactive Cell Proliferation Assay, Promega). Briefly, cells in exponential growth were harvested by trypsinization, seeded at a concentration of 3 × 10³ cells/200 μl/well into 96-well plates, and allowed to attach overnight. The medium was then replenished along with graded concentrations of C7, which was not renewed during the entire period of cell exposure. Following treatments (5–6 days), the plates were centrifuged at 200 g for 10 min and MTS/PMS solution was added to each well at a 1/5 volume. After incubation for 3 h at 37°C in the dark, the absorbance was measured at 490 nm using a multiwell plate reader. Control cells were subjected to the same procedure, but without C75. The cell viability effects from exposure to C75 were analyzed generating concentration–effect curves as a plot of the fraction of unaffected (surviving) cells versus drug concentration. Dose–response curves were plotted as a percentage of the control cell absorbance, which was obtained from control wells containing the C75 vehicle (DMSO) that were processed simultaneously. Cell viability was evaluated for each treatment as a percentage using the following equation: (A570 of treated sample/A570 of untreated sample) × 100. Breast cancer cell sensitivity to C75 was expressed in terms of the concentration of FASN inhibitor required for 50% (IC50) reduction of cell viability. Since the percentage of control absorbance was considered to be the surviving fraction of cells, the IC50 values were defined as the concentration of drug that produced 50% reduction in control absorbance (by interpolation).
Soft Agar Colony Formation Assays
A bottom layer of 1 mL of 2× complete DMEM/F12 medium containing 0.7% agar and 10% HS was prepared in 35-mm multi-well cluster dishes. After the bottom layer solidified, 10,000 cells/dish were added in a 1-mL top layer of 2× complete DMEM/F12 medium containing C75 or vehicle in 0.35% agar and 10% HS as specified. All samples were prepared in triplicate. After 2 weeks of incubation at 37°C in 5% CO2 and 95% air, colonies measuring ≥50 μm were counted after staining with nitroblue tetrazolium (Sigma, St Louis, MO) using a cell colony counter (Ommias 3600, Imaging Products International, Inc., Charley, VA).
Cell cycle analysis
Adherent and detached cells were collected after trypsin treatment, washed in PBS and centrifuged at 1500 rpm. For DNA staining, the cells were washed again after harvesting and treated with RNAse A (0.2 mg/mL) in PBS at 37 °C for 20 min. Propidium iodide (20 μg/mL) was then added to the cell suspension and incubated for 30 min at room temperature protected from light. FACSDiva software (Becton Dickinson) was run for data acquisition using a FACScan flow cytometer and ModFit software for cell cycle analysis.
Immunoblotting analyses of HER2
HER2 expression was assesed by western blotting using a monoclonal antibody against HER2 (Ab-3 clone, Oncogene Research Products, San Diego, CA) as described (Menendez et al. 2005a).
Mammosphere culture and mammosphere-forming efficiency
Single cell suspensions (1000 cells/mL) were plated in 6-well tissue culture plates previously coated with poly-2-hydroxyethyl-methacrylate (Sigma, St. Louis, MO) to prevent cell attachment, in serum-free DMEM/F-12 supplemented with 1% L-glutamine, 1% penicillin/streptomycin, 2% B27 (Invitrogen, Carlsbad, CA), 20 ng/mL EGF (Sigma) and 20 ng/mL FGFb (Invitrogen). The medium was made semi-solid with 0.5% methylcellulose (R&D Systems, Minneapolis, MN) to prevent cell aggregation. Mammosphere-forming efficiency (MSFE) was calculated as the number of sphere-like structures (diameter >50 μm) formed after 7 days divided by the original number of cells seeded, and expressed as a percentage.
Statistical analysis
All observations were confirmed by at least three, independent experiments. Data are presented as means±S.D. Student’s t test (paired and unpaired) was used to evaluate the statistical significance of mean values. Statistical significance levels were P<0.05 (denoted as *) and P<0.005 (denoted as **). All Ps are two-tailed.
Acknowledgments
Work in the corresponding authors’ laboratories was supported by a Department of Defense award (W81XWH-06-1-0703), a National Institutes of Health/National Cancer Institute award (R01-CA118975), and by the Department of Energy under contract No. DE-AC03-76SF00098 to Ruth Lupu, and by grants from the Ministerio de Ciencia e Innovación (Grant SAF2012-38914), Plan Nacional de I+D+I, Spain and the Agència de Gestió d’Ajuts Universitaris i de Recerca (AGAUR) (Grant 2014 SGR229), Departament d’Economia I Coneixement, Catalonia, Spain, to Javier A. Menendez. The authors wish to thank Johannes Swinnen (Catholic University of Leuven, Leuven, Belgium) for the FASN promoter-reporter constructs and Mien-Chie Hung (The University of Texas M D Anderson Cancer Center, Houston, Texas) for kindly providing MCF-7/HER2 (clone 18) cells.
References
- Alli PM, Pinn ML, Jaffee EM, McFadden JM, Kuhajda FP. Fatty acid synthase inhibitors are chemopreventive for mammary cancer in neu-N transgenic mice. Oncogene. 2005;24:39–46. doi: 10.1038/sj.onc.1208174. [DOI] [PubMed] [Google Scholar]
- Arkenau HT, Voskoboynik M, Infante J, Brenner A, Patel M, Borazanci E, et al. Evidence of activity of a new mechanism of action (MoA): a first-in-human Study of the first-in-class fatty acid synthases (FASN) inhibitor, TVB-2640, as monotherapy or in combinations [abstract]. Proceedings of the European Cancer Congress 2015; 2015 September 25–29; Vienna, Austria. Brussels (Belgium): European CanCer Organisation; 2015. Abstract 27LBA. [Google Scholar]
- Baron A, Migita T, Tang D, Loda M. Fatty acid synthase: a metabolic oncogene in prostate cancer? J Cell Biochem. 2004;91:47–53. doi: 10.1002/jcb.10708. [DOI] [PubMed] [Google Scholar]
- Bentebibel A, Sebastián D, Herrero L, López-Viñas E, Serra D, Asins G, Gómez-Puertas P, Hegardt FG. Novel effect of C75 on carnitine palmitoyltransferase I activity and palmitate oxidation. Biochemistry. 2006;45:4339–4350. doi: 10.1021/bi052186q. [DOI] [PubMed] [Google Scholar]
- Benz CC, Scott GK, Sarup JC, Johnson RM, Tripathy D, Coronado E, Shepard HM, Osborne CK. Estrogen-dependent, tamoxifen-resistant tumorigenic growth of MCF-7 cells transfected with HER2/neu. Breast Cancer Res Treat. 1992;24:85–95. doi: 10.1007/BF01961241. [DOI] [PubMed] [Google Scholar]
- Ciardiello F, Gottardis M, Basolo F, Pepe S, Normanno N, Dickson RB, Bianco AR, Salomon DS. Additive effects of c-erbB-2, c-Ha-ras, and transforming growth factor-alpha genes on in vitro transformation of human mammary epithelial cells. Mol Carcinog. 1992;6:43–52. doi: 10.1002/mc.2940060108. [DOI] [PubMed] [Google Scholar]
- Corominas-Faja B, Cuyàs E, Gumuzio J, Bosch-Barrera J, Leis O, Martin ÁG, Menendez JA. Chemical inhibition of acetyl-CoA carboxylase suppresses self-renewal growth of cancer stem cells. Oncotarget. 2014;5:8306–83016. doi: 10.18632/oncotarget.2059. [DOI] [PMC free article] [PubMed] [Google Scholar]
- Flavin R, Peluso S, Nguyen PL, Loda M. Fatty acid synthase as a potential therapeutic target in cancer. Future Oncol. 2010;6:551–562. doi: 10.2217/fon.10.11. [DOI] [PMC free article] [PubMed] [Google Scholar]
- Giunciuglio D, Culty M, Fassina G, Masiello L, Melchiori A, Paglialunga G, Arand G, Ciardiello F, Basolo F, Thompson EW, et al. Invasive phenotype of MCF10A cells overexpressing c-Ha-ras and c-erbB-2 oncogenes. Int J Cancer. 1995;63:815–822. doi: 10.1002/ijc.2910630612. [DOI] [PubMed] [Google Scholar]
- Gyorffy B, Lanczky A, Eklund AC, Denkert C, Budczies J, Li Q, Szallasi Z. An online survival analysis tool to rapidly assess the effect of 22,277 genes on breast cancer prognosis using microarray data of 1809 patients. Breast Cancer Res Treatment. 2010;123:725–731. doi: 10.1007/s10549-009-0674-9. [DOI] [PubMed] [Google Scholar]
- Jones SF, Infante JR. Molecular Pathways: Fatty Acid Synthase. Clin Cancer Res. 2015;21:5434–5438. doi: 10.1158/1078-0432.CCR-15-0126. [DOI] [PubMed] [Google Scholar]
- Jung YY, Kim HM, Koo JS. Expression of Lipid Metabolism-Related Proteins in Metastatic Breast Cancer. PLoS One. 2015;10:e0137204. doi: 10.1371/journal.pone.0137204. [DOI] [PMC free article] [PubMed] [Google Scholar]
- Kim S, Lee Y, Koo JS. Differential expression of lipid metabolism-related proteins in different breast cancer subtypes. PLoS One. 2015;10:e0119473. doi: 10.1371/journal.pone.0119473. [DOI] [PMC free article] [PubMed] [Google Scholar]
- Korkaya H, Paulson A, Iovino F, Wicha MS. HER2 regulates the mammary stem/progenitor cell population driving tumorigenesis and invasion. Oncogene. 2008;27:6120–6130. doi: 10.1038/onc.2008.207. [DOI] [PMC free article] [PubMed] [Google Scholar]
- Kridel SJ, Axelrod F, Rozenkrantz N, Smith JW. Orlistat is a novel inhibitor of fatty acid synthase with antitumor activity. Cancer Res. 2004;64:2070–2075. doi: 10.1158/0008-5472.can-03-3645. [DOI] [PubMed] [Google Scholar]
- Lupu R, Menendez JA. Targeting fatty acid synthase in breast and endometrial cancer: An alternative to selective estrogen receptor modulators? Endocrinology. 2006a;147:4056–4066. doi: 10.1210/en.2006-0486. [DOI] [PubMed] [Google Scholar]
- Lupu R, Menendez JA. Pharmacological inhibitors of Fatty Acid Synthase (FASN)–catalyzed endogenous fatty acid biogenesis: a new family of anti-cancer agents? Curr Pharm Biotechnol. 2006b;7:483–493. doi: 10.2174/138920106779116928. [DOI] [PubMed] [Google Scholar]
- Makowski K, Mera P, Paredes D, Herrero L, Ariza X, Asins G, Hegardt FG, García J, Serra D. Differential pharmacologic properties of the two C75 enantiomers: (+)-C75 is a strong anorectic drug; (-)-C75 has antitumor activity. Chirality. 2013;25:281–287. doi: 10.1002/chir.22139. [DOI] [PubMed] [Google Scholar]
- Martin-Castillo B, Lopez-Bonet E, Cuyàs E, Viñas G, Pernas S, Dorca J, Menendez JA. Cancer stem cell-driven efficacy of trastuzumab (Herceptin): towards a reclassification of clinically HER2-positive breast carcinomas. Oncotarget. 2015;6:32317–32338. doi: 10.18632/oncotarget.6094. [DOI] [PMC free article] [PubMed] [Google Scholar]
- Menendez JA. Fine-tuning the lipogenic/lipolytic balance to optimize the metabolic requirements of cancer cell growth: molecular mechanisms and therapeutic perspectives. Biochim Biophys Acta. 2010;180:381–391. doi: 10.1016/j.bbalip.2009.09.005. [DOI] [PubMed] [Google Scholar]
- Menendez JA. Metabolic control of cancer cell stemness: Lessons from iPS cells. Cell Cycle. 2015;14:3801–3811. doi: 10.1080/15384101.2015.1022697. [DOI] [PMC free article] [PubMed] [Google Scholar]
- Menendez JA, Alarcón T. Metabostemness: a new cancer hallmark. Front Oncol. 2014;4:262. doi: 10.3389/fonc.2014.00262. [DOI] [PMC free article] [PubMed] [Google Scholar]
- Menendez JA, Lupu R. Fatty acid synthase-catalyzed de novo fatty acid biosynthesis: from anabolic-energy-storage pathway in normal tissues to jack-of-all-trades in cancer cells. Arch Immunol Ther Exp (Warsz) 2004;52:414–426. [PubMed] [Google Scholar]
- Menendez JA, Lupu R. Oncogenic properties of the endogenous fatty acid metabolism: molecular pathology of fatty acid synthase in cancer cells. Curr Opin Clin Nutr Metab Care. 2006;9:346–357. doi: 10.1097/01.mco.0000232893.21050.15. [DOI] [PubMed] [Google Scholar]
- Menendez JA, Lupu R. Fatty acid synthase and the lipogenic phenotype in cancer pathogenesis. Nat Rev Cancer. 2007;7:763–777. doi: 10.1038/nrc2222. [DOI] [PubMed] [Google Scholar]
- Menendez JA, Corominas-Faja B, Cuyàs E, Alarcón T. Metabostemness: Metaboloepigenetic reprogramming of cancer stem-cell functions. Oncoscience. 2014;1:803–806. doi: 10.18632/oncoscience.113. [DOI] [PMC free article] [PubMed] [Google Scholar]
- Menendez JA, Corominas-Faja B, Cuyàs E, García MG, Fernández-Arroyo S, Fernández AF, Joven J, Fraga MF, Alarcón T. Oncometabolic Nuclear Reprogramming of Cancer Stemness. Stem Cell Reports. 2016 doi: 10.1016/j.stemcr.2015.12.012. 2016 Jan 27. pii: S2213-6711(15)00377-X. [DOI] [PMC free article] [PubMed] [Google Scholar]
- Menendez JA, Decker JP, Lupu R. In support of fatty acid synthase (FAS) as a metabolic oncogene: extracellular acidosis acts in an epigenetic fashion activating FAS gene expression in cancer cells. J Cell Biochem. 2005c;94:1–4. doi: 10.1002/jcb.20310. [DOI] [PubMed] [Google Scholar]
- Menendez JA, Joven J, Cufí S, Corominas-Faja B, Oliveras-Ferraros C, Cuyàs E, Martin-Castillo B, López-Bonet E, Alarcón T, Vazquez-Martin A. The Warburg effect version 2.0: metabolic reprogramming of cancer stem cells. Cell Cycle. 2013;12:1166–1179. doi: 10.4161/cc.24479. [DOI] [PMC free article] [PubMed] [Google Scholar]
- Menendez JA, Lupu R, Colomer R. Targeting fatty acid synthase: potential for therapeutic intervention in her-2/neu-overexpressing breast cancer. Drug News Perspect. 2005b;18:375–385. doi: 10.1358/dnp.2005.18.6.927929. [DOI] [PubMed] [Google Scholar]
- Menendez JA, Mehmi I, Lupu R. Trastuzumab in combination with heregulin-activated Her-2 (erbB-2) triggers a receptor-enhanced chemosensitivity effect in the absence of Her-2 overexpression. J Clin Oncol. 2006;24:3735–3746. doi: 10.1200/JCO.2005.04.3489. [DOI] [PubMed] [Google Scholar]
- Menendez JA, Mehmi I, Atlas E, Colomer R, Lupu R. Novel signaling molecules implicated in tumor-associated fatty acid synthase-dependent breast cancer cell proliferation and survival: Role of exogenous dietary fatty acids, p53-p21WAF1/CIP1, ERK1/2 MAPK, p27KIP1, BRCA1, and NF-kappaB. Int J Oncol. 2004a;24:591–608. [PubMed] [Google Scholar]
- Menendez JA, Mehmi I, Verma VA, Teng PK, Lupu R. Pharmacological inhibition of fatty acid synthase (FAS): a novel therapeutic approach for breast cancer chemoprevention through its ability to suppress Her-2/neu (erbB-2) oncogene-induced malignant transformation. Mol Carcinog. 2004c;41:164–178. doi: 10.1002/mc.20054. [DOI] [PubMed] [Google Scholar]
- Menendez JA, Schroeder B, Peirce SK, Vellon L, Papadimitropoulou A, Espinoza I, Lupu R. Blockade of a key region in the extracellular domain inhibits HER2 dimerization and signaling. J Natl Cancer Inst. 2015;107:djv090. doi: 10.1093/jnci/djv090. Print 2015 Jun. [DOI] [PubMed] [Google Scholar]
- Menendez JA, Vellon L, Lupu R. Antitumoral actions of the anti-obesity drug orlistat (XenicalTM) in breast cancer cells: blockade of cell cycle progression, promotion of apoptotic cell death and PEA3-mediated transcriptional repression of Her2/neu (erbB-2) oncogene. Ann Oncol. 2005a;16:1253–1267. doi: 10.1093/annonc/mdi239. [DOI] [PubMed] [Google Scholar]
- Menendez JA, Vellon L, Mehmi I, Oza BP, Ropero S, Colomer R, Lupu R. Inhibition of fatty acid synthase (FAS) suppresses HER2/neu (erbB-2) oncogene overexpression in cancer cells. Proc Natl Acad Sci U S A. 2004b;101:10715–10720. doi: 10.1073/pnas.0403390101. [DOI] [PMC free article] [PubMed] [Google Scholar]
- Mera P, Bentebibel A, López-Viñas E, Cordente AG, Gurunathan C, Sebastián D, Vázquez I, Herrero L, Ariza X, Gómez-Puertas P, Asins G, Serra D, García J, Hegardt FG. C75 is converted to C75-CoA in the hypothalamus, where it inhibits carnitine palmitoyltransferase 1 and decreases food intake and body weight. Biochem Pharmacol. 2009;77:1084–1095. doi: 10.1016/j.bcp.2008.11.020. [DOI] [PubMed] [Google Scholar]
- Migita T, Ruiz S, Fornari A, Fiorentino M, Priolo C, Zadra G, Inazuka F, Grisanzio C, Palescandolo E, Shin E, Fiore C, Xie W, Kung AL, Febbo PG, Subramanian A, Mucci L, Ma J, Signoretti S, Stampfer M, Hahn WC, Finn S, Loda M. Fatty acid synthase: a metabolic enzyme and candidate oncogene in prostate cancer. J Natl Cancer Inst. 2009;101:519–532. doi: 10.1093/jnci/djp030. [DOI] [PMC free article] [PubMed] [Google Scholar]
- Mihály Z, Győrffy B. Improving Pathological Assessment of Breast Cancer by Employing Array-Based Transcriptome Analysis. Microarrays. 2013;2:228–242. doi: 10.3390/microarrays2030228. [DOI] [PMC free article] [PubMed] [Google Scholar]
- Mihály Z, Kormos M, Lánczky A, Dank M, Budczies J, Szász MA, Győrffy B. A meta-analysis of gene expression-based biomarkers predicting outcome after tamoxifen treatment in breast cancer. Breast Cancer Res Treat. 2013;140:219–232. doi: 10.1007/s10549-013-2622-y. [DOI] [PubMed] [Google Scholar]
- O’Farrell M, Crowley R, Heuer TS, Buckley D, Rubino CM, McCulloch W, Kemble G. Biomarker PK/PD analyses of first in class FASN inhibitor TVB-2640 in a first-in-human phase 1 study in solid tumor patients. [abstract]. Cancer Res; Proceedings of the 106th Annual Meeting of the American Association for Cancer Research; 2015 Apr 18–22; Philadelphia, PA. Philadelphia (PA): AACR; 2015. Abstract nr 2675. [DOI] [Google Scholar]
- Orita H, Coulter J, Lemmon C, Tully E, Vadlamudi A, Medghalchi SM, Kuhajda FP, Gabrielson E. Selective inhibition of fatty acid synthase for lung cancer treatment. Clin Cancer Res. 2007;13:7139–7145. doi: 10.1158/1078-0432.CCR-07-1186. [DOI] [PubMed] [Google Scholar]
- Pandey PR, Liu W, Xing F, Fukuda K, Watabe K. Anti-cancer drugs targeting fatty acid synthase (FAS) Recent Pat Anticancer Drug Discov. 2012;7:185–197. doi: 10.2174/157489212799972891. [DOI] [PubMed] [Google Scholar]
- Patel AV, Johansson G, Colbert MC, Dasgupta B, Ratner N. Fatty acid synthase is a metabolic oncogene targetable in malignant peripheral nerve sheath tumors. Neuro Oncol. 2015;17:1599–1608. doi: 10.1093/neuonc/nov076. [DOI] [PMC free article] [PubMed] [Google Scholar]
- Patel M, Infante J, Von Hoff D, Jones S, Burris H, Brenner A, McCulloch W, Zhukova-Harrill V, Kemble G, Parsey M. Report of a first-in-human study of the first-in-class fatty acid synthase (FASN) inhibitor TVB-2640. [abstract]. Cancer Res; Proceedings of the 106th Annual Meeting of the American Association for Cancer Research; 2015 Apr 18–22; Philadelphia, PA. Philadelphia (PA): AACR; 2015. Abstract nr CT203. [DOI] [Google Scholar]
- Sadowski MC, Pouwer RH, Gunter JH, Lubik AA, Quinn RJ, Nelson CC. The fatty acid synthase inhibitor triclosan: repurposing an anti-microbial agent for targeting prostate cancer. Oncotarget. 2014;5:9362–9381. doi: 10.18632/oncotarget.2433. [DOI] [PMC free article] [PubMed] [Google Scholar]
- Swinnen JV, Ulrix W, Heyns W, Verhoeven G. Coordinate regulation of lipogenic gene expression by androgens: Evidence for a cascade mechanism involving sterol regulatory element binding proteins. Proc Natl Acad Sci USA. 1997;94:12975–12980. doi: 10.1073/pnas.94.24.12975. [DOI] [PMC free article] [PubMed] [Google Scholar]
- Vazquez-Martin A, Colomer R, Brunet J, Lupu R, Menendez JA. Overexpression of fatty acid synthase gene activates HER1/HER2 tyrosine kinase receptors in human breast epithelial cells. Cell Prolif. 2008;41:59–85. doi: 10.1111/j.1365-2184.2007.00498.x. [DOI] [PMC free article] [PubMed] [Google Scholar]
- Vazquez-Martin A, Fernandez-Real JM, Oliveras-Ferraros C, Navarrete JM, Martin-Castillo B, Del Barco S, Brunet J, Menendez JA. Fatty acid synthase activity regulates HER2 extracellular domain shedding into the circulation of HER2-positive metastatic breast cancer patients. Int J Oncol. 2009;35:1369–1376. doi: 10.3892/ijo_00000455. [DOI] [PubMed] [Google Scholar]
- Vázquez MJ, Leavens W, Liu R, Rodríguez B, Read M, Richards S, Winegar D, Domínguez JM. Discovery of GSK837149A, an inhibitor of human fatty acid synthase targeting the beta-ketoacyl reductase reaction. FEBS J. 2008;275:1556–1567. doi: 10.1111/j.1742-4658.2008.06314.x. [DOI] [PubMed] [Google Scholar]
- Yang M, Xu SP, Ao QL. Expression of fatty acid synthase and its association with HER2 in invasive ductal carcinoma of breast. Zhonghua Bing Li Xue Za Zhi. 2013;42:257–261. doi: 10.3760/cma.j.issn.0529-5807.2013.04.010. [DOI] [PubMed] [Google Scholar]