Abstract
Despite major efforts, our knowledge about many brain diseases remains remarkably limited. Epigenetic dysregulation has been one of the few leads toward identifying the causes and potential treatments of psychiatric disease over the past decade. A new positron emission tomography radiotracer, [11C]Martinostat, has enabled the study of histone deacetylase in living human subjects. A unique property of [11C]Martinostat is its profound brain penetrance, a feature that is challenging to engineer intentionally. In order to understand determining factors for the high brain-uptake of Martinostat, a series of compounds was evaluated in rodents and non-human primates. The study revealed the major structural contributors to brain uptake, as well as a more clinically relevant fluorinated HDAC radiotracer with comparable behavior to Martinostat, yet longer half-life.
Keywords: Histone Deacetylase, Positron Emission Tomography, Fluorine, Brain Penetrance, Epigenetics, Blood-Brain Barrier
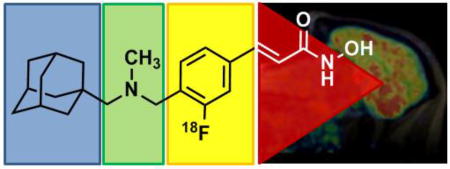
Graphical abstract

Epigenetic dysregulation is linked to a number of diverse brain pathologies 1–5. Histone deacetylases (HDACs) are epigenetic enzymes which have received considerable attention as potential drug targets, based on animal models and post mortem studies 6–12. Even though their potential application includes a number of psychiatric and neurodegenerative diseases, only cancer treatment is currently an approved application of HDAC inhibitors in humans 13. A crucial missing link toward neurological and psychiatric applications is a more detailed, quantitative understanding of HDAC enzymes and their relationship to disease and treatment inside the living human brain.
Positron emission tomography (PET) has a unique potential to visualize human epigenetic biochemistry in vivo. The rate limiting step toward understanding the human neuroepigenome with PET is the development of suitable radiotracers because a number of parameters – like brain penetrance – are still virtually impossible to determine without tedious trial-and-error based screening 14.
[11C]Martinostat is an HDAC radiotracer with exceptionally high brain uptake 12, 15, 16. The currently available version of Martinostat is labelled with carbon-11, which limits its practicality, since logistics are constrained by its 20 min half-life 17, 18. One key achievement presented in this work is the development of an [18F]-HDAC-radiotracer, which enables in vivo quantification of HDAC with the benefits of a longer half-life. Additionally, an [18F]-labeled version enabled a detailed resolution of the contribution of different functional groups to the remarkable brain uptake of Martinostat. As empirically identified, contribution of a single adamantyl substituent was confirmed19, 20 to be a major driving force for the brain penetrance of Martinostat. Furthermore, amine methylation significantly increases brain uptake.
Results and Discussion
Strategic Prioritization of Candidates
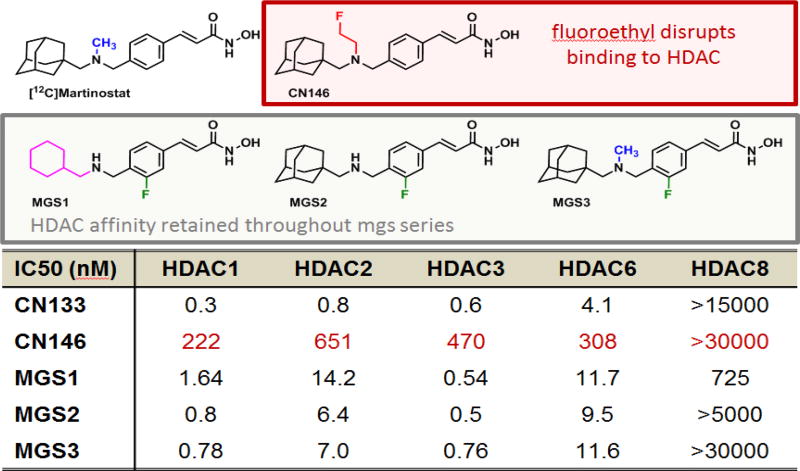
To develop a fluorine-18 analog of [11C]Martinostat, we attempted two distinct strategies: 1) labeling by installation of a fluorine-bearing prosthetic group; or 2) fluorination of the aromatic ring. The first approach is represented by CN146, which contains a fluoroethyl substituent, while the second approach is actualized by the structures MGS1-3, which are labeled on the aromatic ring (Figure 1). Ex vivo prioritization of compounds was achieved using a validated functional recombinant HDAC assay to determine the extent to which candidate structures engage HDAC subtypes 15. As shown in Figure 1, installation of a fluoroethyl prosthetic group reduces HDAC affinity drastically. Therefore, we focused our efforts on three leads, MGS1-3.
Figure 1.
Recombinant HDAC assay, IC50 values for candidate molecules to elucidate how structural modifications to [12C]Martinostat impact target engagement. While installation of a fluoroethyl prosthetic group disrupts HDAC binding, the target affinity is retained throughout the MGS series
Initial interrogation of brain uptake of the MGS1-3 series utilizing the existing [11C]Martinostat radiotracer indicated a comparable reduction in [11C]Martinostat uptake in rat following administration of either 1 mg/kg of unlabeled [19F]MGS1-3 or unlabeled [12C]Martinostat (Figure 1-SI), providing evidence for brain penetrance and in vivo HDAC engagement of the candidate structures and warranting investments in radiolabeling.
Rodent PET-CT
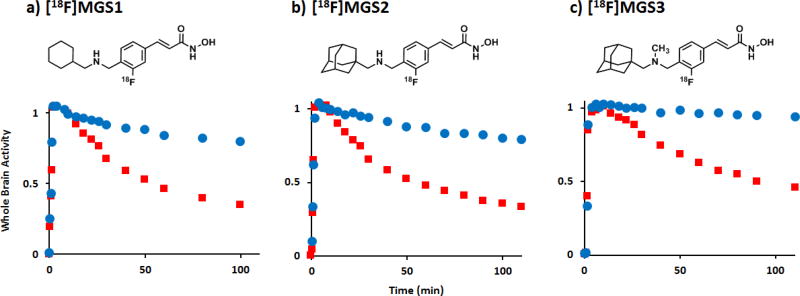
To verify in vivo specific, saturable binding of the three candidate structures, MGS1-3, to HDAC, we radiolabeled each compound with fluorine-18. Although yields were generally low (Supporting Information), we obtained sufficient amounts in high specific activity to conduct dynamic PET/CT imaging in rodents. The time-activity curves of a whole-brain volume of interest (VOI) at baseline were compared to intravenous pre-treatment with 1 mg/kg of unlabeled, [12C]Martinostat immediately prior to radiotracer injection 12. As shown in Figure 2, all fluorine-18 tracers showed similar baseline TAC profiles, including a rapid increase in whole brain activity with peak activity around 10 min post injection, and limited washout over the 2 h scan interval. Consistent with saturable in vivo binding, pre-treatment with a brain-penetrant HDAC inhibitor increases the rate of [18F]MGS1-3 washout, resulting in a 40–50% reduction in [18F]MGS1-3 compared to peak activity within two hours (Figure 2). This observation indicates in vivo HDAC engagement of MGS1-3 signal in rodents is predominantly due to saturable, and hence specific binding to their respective targets.
Figure 2. PET-CT Imaging of [18F]MGS1-3 in rat.
Graphs show tracer uptake in brain at baseline and after pre-treatment with [12C]Martinostat (1mg/kg), normalized to whole brain activity at 10 min post injection. Robust blocking was observed for all three tracers: a) [18F]MGS1, b) [18F]MGS2 and c) [18F]MGS3. Time-activity curves for whole brain VOI (baseline: blue, blocking: red) confirm high specific/non-specific binding ratio for all three molecules, as the retained activity after two hours is markedly reduced by administration of a blocking agent.
Non-Human Primate Imaging
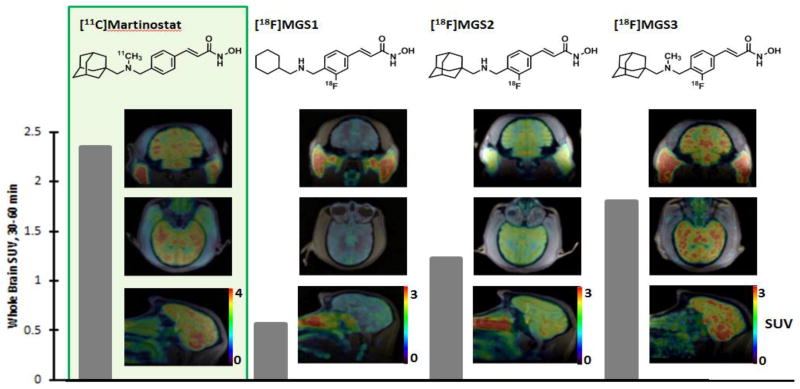
To determine the degree to which specific structural changes of tracer molecules impact brain penetrance and in vivo distribution, as well as for validation of the compounds in a higher species, we advanced MGS1-3 to nonhuman primates. Dynamic PET/MRI imaging in baboon (papio anubis) revealed differences between the labelled molecules in greater detail. Brain images of [18F]MGS1-3 standardized uptake value (SUV), summed over 30–60 min post-radiotracer injection, are shown in comparison to [11C]Martinostat in Figure 3. All three tracers penetrate the blood brain barrier, but the overall SUV greatly varies across the substitution patterns, indicated by the grey bar next to the images. While MGS3 reaches about 78% of the uptake of [11C]Martinostat, seemingly minor structural changes have a detrimental influence on the uptake properties. Formal removal of the methyl group on the amine, as shown by MGS2, results in only about 52% of the uptake of [11C]Martinostat, which is equivalent to an additional 33% reduction of brain uptake with compared to MGS3. Even more strikingly, substitution of the adamantyl substituent for cyclohexyl results in an SUV of 0.56, a 69% decrease compared to MGS3.
Figure 3. Whole Brain Radiotracer uptake.
Images show the distribution of [11C]Martinostat (SUV scale 0–4) as well as [18F]MGS1-3 (SUV scale 0–3) in baboon brain in three planes each. The images are shown in subject space. The respective whole brain SUVs (30–60 minutes) are quantified for each tracer by the gray bar.
Brain penetrance often correlates to specific physical properties of molecules within a series (Table 1), such as their distribution coefficient (LogP) or total polar surface area (TPSA) 21. In the case of [18F]MGS1-3, it is true that with a higher computed LogP (cLogP) 22, 23, brain penetrance increases. The cLogP of MGS1-3 (3.07, 3.77, 4.17 respectively) correlate linearly (R2 = 0.99) with the SUV. In comparison, the TPSA values of 61.35 for both MGS1 and 2, and 52.56 for [18F]MGS3 do not seem to correlate well with the observed behavior. It has previously been suggested that the high brain penetrance of adamantyl bearing structures can be explained by an increased lipophilicity, with a rigid and constricted atomic configuration compared to linear alkanes, which typically leads to undesirable nonspecific binding 20. Our findings are consistent with that hypothesis.
Table 1.
Physical properties and Standard uptake values of MGS-series.
| Radiotracer | [18F] MGS1 | [18F]MGS2 | [18F]MGS3 |
|---|---|---|---|
| SUV, baboon | 0.566 | 1.22 | 1.80 |
| cLogP | 3.07 | 3.77 | 4.17 |
| TPSA | 61.35 | 61.35 | 52.56 |
Apart from the adamantyl substituent, another factor we were specifically interested in was the influence of amine methylation on brain uptake, which was tested through comparison of MGS2 and MGS3. Formal removal of a methyl group from the parent structure is estimated to decrease the pKA by roughly one unit. However, at physiological pH, this change is not expected to alter the protonation state significantly, since pKA values of secondary and tertiary acyclic aliphatic amines are typically greater than 9 24. The influence on the cLogP and, ultimately, the SUV is nonetheless profound, as described above. The effect of methylation on brain uptake within the MGS-series is therefore merely based on overall polarity.
Beyond brain uptake, the regional tracer distribution was assessed to determine the suitability of a candidate fluorine-18 tracer as an analog for [11C]Martinostat. To compare regional distribution, images for each tracer were coregistered to the Black baboon atlas25, 38 ROIs were chosen and symmetrical regions averaged. The regional SUV values for [18F]MGS1-3 were determined and compared to [11C]Martinostat (Figure 4, Table 1-SI). While for [18F]MGS1, the correlation is relatively poor (but still significant, Spearman r = 0.64, P = 0.005), correlation increases across the series to [18F]MGS3 (Spearman r = 0.86, P = 3.5 × 10⁻⁶). This degree of correlation strongly suggests a high specific binding component as well as engagement of the same targets as [11C]Martinostat.
Figure 4. Regional correlation between [11C]Martinostat and the MGS series.
a) Regional correlation analysis between [11C]Martinostat and [18F]MGS1 averaged 30–60 min after TOI, Spearman r = 0.64; b) [11C]Martinostat and [18F]MGS2 averaged 30–60 min after TOI, Spearman r = 0.79; c) [11C]Martinostat and [18F]MGS3 averaged 30–60 min post injection, Spearman r = 0.86;
The results presented here are limited by several consequences of the inefficient radiochemistry. Poor yields and the manual synthesis only allowed for low doses to be administered. Full validation of [18F]MGS3, including blocking experiments in baboons, rigorous kinetic quantification using an arterial input function and automated production for human use will require a more efficient synthesis, which is currently under investigation. Our laboratory is investigating the detailed contributions of HDAC subtypes in different tissues to the overall signal.
Conclusion
We developed a series of new fluorine-18 labeled radiotracers for measuring HDAC occupancy in the central nervous system. It was found that within the examined series, the major driving force for brain uptake could be attributed to an adamantyl substituent. Additionally, it was determined that methylation of an amine moiety also drastically increases SUV, overall affording the desired replacement for [11C]Martinostat. [18F]MGS3 exhibits specific binding, as well as comparable brain uptake and regional distribution to [11C]Martinostat, which warrants further investigation of more efficient radiosyntheses to facilitate full imaging validation and enable use in human subjects.
Materials and Methods
Animal Preparation
RODENT
A total of 12 male Sprague–Dawley rats (Charles River Labs) between 2 and 4 months of age were used for imaging. Animals were pair-housed until they reached a weight of 500 g, and were kept on a 12 h : 12 h light:dark cycle. All treatment and imaging experiments were performed according to procedures approved by the Institutional Animal Care and Use Committee at the Massachusetts General Hospital. Anesthesia consisting of isoflurane (3% for induction, 2% for maintenance) and oxygen carrier was administered to each animal. For i.v. administration, a catheter was placed in a lateral tail vein of each animal. The catheter was connected to a syringe via an extension line. Animals received a bolus injection of either vehicle (1:1:8 DMSO:Tween80:saline) or blocking agent in solution (1 mg/kg, 1 mg/mL in 1:1:8 DMSO:Tween80:saline) immediately prior to injection of the radiotracer.
NHP
Four baseline PET/MR studies were carried out with two baboons (both females, Papio anubis, 13.4 and 16.2 kg) as approved by the Institutional Animal Care and Use Committee at the Massachusetts General Hospital. Nil per os was instructed 12 h prior to the study. Anesthesia was induced with intramuscular (i.m.) ketamine (10 mg/kg) and xylazine (0.5 mg/kg). Anesthesia was continued during the study with 1−1.5% isoflurane in medical oxygen and ketamine/xylazine effects were reverted with yobine (0.11mg/kg, i.m.) prior to the scan. Radiotracer injection was performed through a catheter in the saphenous vein. Vital signs (end-tidal CO2, oxygen saturation, heart rate, and respiration rate) were under continuous surveillance to maintain a normal physiological range, documented every 15 minutes.
Chemical Synthesis
Syntheses and characterization of blocking agents, precursors for radiolabeling, reagents and nonradioactive standards are described in detail in the Supporting Information.
Radiosynthesis
[11C]Martinostat was synthesized as previously reported.6, 7
Radiosyntheses for MGS1-3 are described in detail in the Supporting Information.
PET/MR Image Acquisition
RODENT
After injection of a radiotracer bolus (669±15 μCi [11C]Martinostat; 305±5 μCi [18F]MGS1; 103±4 μCi [18F]MGS2; 67±1 μCi [18F]MGS3), a 120 min dynamic PET scan was acquired for each animal. PET scans were performed on either a GammaMedica Triumph PET/CT/SPECT scanner or Siemens P4 PET scanner. PET data collected on the GammaMedica Triumph was corrected for attenuation with the corresponding CT image, which was acquired immediately following the PET scan. On the P4 scanner, a transmission scan with a Cobalt (57Co) line source was acquired to generate an attenuation map, which was applied during image reconstruction. The dynamic PET data was binned into 38 or 44 timeframes (8 × 15 s, 8 × 1 min, 10 × 2 min, 18 × 5 min or 6 × 5 min and 6 × 10 min) and reconstruction of each frame via an iterative MLEM (maximum likelihood expectation maximization) algorithm, consisting of 16 iterations, afforded images with a resolution of approximately 2 mm FWHM (full width at half maximum).
NHP
PET/MRI acquisition was performed on a 3T Siemens TIM-Trio with a BrainPET insert (Siemens, Erlangen, Germany). A PET/MRI compatible eight-channel array coil customized for nonhuman primate brain imaging to increase image signal and quality was employed. After administration of one of the radiotracers (1.4 mCi MGS1; 1.8 mCi MGS2; 0.55 mCi MGS3) or [11C]Martinostat (4.9 mCi), dynamic PET image acquisition was initiated. Dynamic PET data were collected and stored in list mode for 90 min in the case of [11C]Martinostat and 120 min for [18F]MGS1-3. Image reconstruction was performed using the 3D ordinary Poisson expectation maximization algorithm with detector efficiency, decay, dead time, attenuation, and scatter corrections. PET data were binned in 29 frames (6 × 10 s, 6 × 20 s, 2 × 30 s, 1 × 1 min, 5 × 5 min, 9x10 min for [18F] scans (6 × 10 min for [11C]Martinostat)). Image volumes were eventually reconstructed into 76 slices with 128x128 pixels and a 2.5 mm isotropic voxel size. 30 minutes after scanner start, a high-resolution anatomical scan using multiecho MPRAGE sequence (TR = 2530 ms, TE1/TE2/TE3/TE4 = 1.64/3.5/5.36/7.22 ms, TI = 1200 ms, flip angle = 7°, and 1 mm isotropic) was acquired.
Image Analysis
RODENT
The imaging software package PMOD 3.3 (PMOD Technologies, Zurich, Switzerland) was used for all image analysis. All PET imaging data acquired on the Triumph scanner were coregistered to the CT image acquired from the same animal. Siemens P4 data were aligned and coregistered to CT data derived from an age matched animal of similar size. For maximum consistency, the data were coregistered to the Schiffer Px Rat26 rat brain template and data was derived from a whole brain VOI (volumes of interest) for time activity curves.
NHP
PET data were registered to the Black baboon brain atlas 25 using JIP tools optimized for nonhuman primate data processing (www.nitrc.org/projects/jip). The high-resolution T1-weighted anatomical MRI image was first registered to the baboon brain atlas using a mutual information approach and the transformation parameters were then applied to the simultaneously collected dynamic PET data. 38 common VOIs from the Black baboon atlas 25 were applied to all scans. Time−activity curves (TACs) were extracted from the orbitofrontal cortex, dorsolateral prefontal cortex, anterior cingulate gyrus, posterior cingulate gyrus, amygdala, hippocampus, ventral caudate, caudate body, putamen, nucleus accumbens, medial and ventral posterolateral thalamus, habenula, cerebellar midline nuclei, whole cerebellum, genu and splenium of the corpus callosum, striate cortex, motor cortex, supplementary motor area and the centrum semiovale. Symmetrical structures were averaged before further analysis. For SUV calculations, time points between 30 and 60 min were averaged for each tracer and each VOI. Spearman correlation coefficients, R2 values and P values were determined using statistical tools within Microsoft Excel.
Supplementary Material
Acknowledgments
M.G.S. was supported by a training grant from the NIH Blueprint for Neuroscience Research (T90DA022759/R90DA023427), as well as the Jacques-Emile Dubois Graduate Student Dissertation Fellowship Fund. C. W. and H.-Y.W. were supported by the Harvard/MGH Nuclear Medicine Training Program from the Department of Energy (DE-SC0008430). M.S.P. was supported by a NIH-NIDA T32 postdoctoral fellowship (T32DA015036)). Research was supported by the National Institute of Drug Abuse (NIDA) of the National Institutes of Health under grant number R01DA030321. This research was carried out at the Athinoula A. Martinos Center for Biomedical Imaging at the Massachusetts General Hospital, using resources provided by the Center for Functional Neuroimaging Technologies, P41EB015896, a P41 Regional Resource supported by the National Institute of Biomedical Imaging and Bioengineering (NIBIB), National Institutes of Health. This work also involved the use of instrumentation supported by the NIH Shared Instrumentation Grant Program and/or High-End Instrumentation Grant Program; specifically, Grant Numbers: S10RR017208, S10RR026666, S10RR022976, S10RR019933, and S10RR029495.
The authors are grateful to Helen Deng as well as the Martinos Center radiopharmacy and imaging staff (Grae Arabasz, Regan Butterfield, Garima Gautam, Shirley Hsu, Kari Phan, Judit Sore, Samantha To) for help with nonhuman primate experiments and isotope generation. HDAC activity screening was enabled by a Caliper assay developed by Jennifer Gale and Yan-Ling Zhang at the Broad Institute. Thanks to Tonya Gilbert for helpful discussions.
Footnotes
Associated Content
Supporting Information
HDAC inhibition assay, chemical syntheses, radiosyntheses of MGS1-3, blocking experiments with non-labeled MGS1-3 and detailed regional analysis of brain distribution of MGS3 in comparison to Martinostat are documented in the Supporting Information. This material is available free of charge via the Internet at http://pubs.acs.org.
References
- 1.Akbarian S, Nestler EJ. Epigenetic Mechanisms in Psychiatry. Neuropsychopharmacology. 2013;38:1–2. doi: 10.1038/npp.2012.185. [DOI] [PMC free article] [PubMed] [Google Scholar]
- 2.Fass DM, Reis SA, Ghosh B, Hennig KM, Joseph NF, Zhao W-N, Nieland TJF, Guan J-S, Groves Kuhnle CE, Tang W, Barker DD, Mazitschek R, Schreiber SL, Tsai L-H, Haggarty SJ. Crebinostat: A novel cognitive enhancer that inhibits histone deacetylase activity and modulates chromatin-mediated neuroplasticity. Neuropharmacology. 2013;64:81–96. doi: 10.1016/j.neuropharm.2012.06.043. [DOI] [PMC free article] [PubMed] [Google Scholar]
- 3.Grayson DR, Guidotti A. The Dynamics of DNA Methylation in Schizophrenia and Related Psychiatric Disorders. Neuropsychopharmacology. 2013;38:138–166. doi: 10.1038/npp.2012.125. [DOI] [PMC free article] [PubMed] [Google Scholar]
- 4.Robison AJ, Nestler EJ. Transcriptional and epigenetic mechanisms of addiction. Nat Rev Neurosci. 2011;12:623–637. doi: 10.1038/nrn3111. [DOI] [PMC free article] [PubMed] [Google Scholar]
- 5.Sun H, Kennedy PJ, Nestler EJ. Epigenetics of the Depressed Brain: Role of Histone Acetylation and Methylation. Neuropsychopharmacology. 2013;38:124–137. doi: 10.1038/npp.2012.73. [DOI] [PMC free article] [PubMed] [Google Scholar]
- 6.Schroeder FA, Lewis MC, Fass DM, Wagner FF, Zhang Y-L, Hennig KM, Gale J, Zhao W-N, Reis S, Barker DD, Berry-Scott E, Kim SW, Clore EL, Hooker JM, Holson EB, Haggarty SJ, Petryshen TL. A Selective HDAC 1/2 Inhibitor Modulates Chromatin and Gene Expression in Brain and Alters Mouse Behavior in Two Mood-Related Tests. PLoS ONE. 2013;8:e71323. doi: 10.1371/journal.pone.0071323. [DOI] [PMC free article] [PubMed] [Google Scholar]
- 7.Jakovcevski M, Bharadwaj R, Straubhaar J, Gao G, Gavin DP, Jakovcevski I, Mitchell AC, Akbarian S. Prefrontal Cortical Dysfunction After Overexpression of Histone Deacetylase 1. Biol Psychiatry. 2013;74:696–705. doi: 10.1016/j.biopsych.2013.03.020. [DOI] [PMC free article] [PubMed] [Google Scholar]
- 8.Bahari-Javan S, Maddalena A, Kerimoglu C, Wittnam J, Held T, Bähr M, Burkhardt S, Delalle I, Kügler S, Fischer A, Sananbenesi F. HDAC1 Regulates Fear Extinction in Mice. J Neurosci. 2012;32:5062–5073. doi: 10.1523/JNEUROSCI.0079-12.2012. [DOI] [PMC free article] [PubMed] [Google Scholar]
- 9.Guan J-S, Haggarty SJ, Giacometti E, Dannenberg J-H, Joseph N, Gao J, Nieland TJF, Zhou Y, Wang X, Mazitschek R, Bradner JE, DePinho RA, Jaenisch R, Tsai L-H. HDAC2 negatively regulates memory formation and synaptic plasticity. Nature. 2009;459:55–60. doi: 10.1038/nature07925. [DOI] [PMC free article] [PubMed] [Google Scholar]
- 10.Malvaez M, McQuown SC, Rogge GA, Astarabadi M, Jacques V, Carreiro S, Rusche JR, Wood MA. HDAC3-selective inhibitor enhances extinction of cocaine-seeking behavior in a persistent manner. Proc Natl Acad Sci U S A. 2013;110:2647–2652. doi: 10.1073/pnas.1213364110. [DOI] [PMC free article] [PubMed] [Google Scholar]
- 11.Kennedy PJ, Feng J, Robison AJ, Maze I, Badimon A, Mouzon E, Chaudhury D, Damez-Werno DM, Haggarty SJ, Han MH, Bassel-Duby R, Olson EN, Nestler EJ. Class I HDAC inhibition blocks cocaine-induced plasticity by targeted changes in histone methylation. Nat Neurosci. 2013;16:434–440. doi: 10.1038/nn.3354. [DOI] [PMC free article] [PubMed] [Google Scholar]
- 12.Schroeder FA, Wang C, Van de Bittner GC, Neelamegam R, Takakura WR, Karunakaran A, Wey HY, Reis SA, Gale J, Zhang YL, Holson EB, Haggarty SJ, Hooker JM. PET imaging demonstrates histone deacetylase target engagement and clarifies brain penetrance of known and novel small molecule inhibitors in rat. ACS Chem Neurosci. 2014;5:1055–1062. doi: 10.1021/cn500162j. [DOI] [PMC free article] [PubMed] [Google Scholar]
- 13.West AC, Johnstone RW. New and emerging HDAC inhibitors for cancer treatment. J Clin Invest. 2014;124:30–39. doi: 10.1172/JCI69738. [DOI] [PMC free article] [PubMed] [Google Scholar]
- 14.Van de Bittner GC, Ricq EL, Hooker JM. A Philosophy for CNS Radiotracer Design. Acc Chem Res. 2014;47:3127–3134. doi: 10.1021/ar500233s. [DOI] [PMC free article] [PubMed] [Google Scholar]
- 15.Wang C, Schroeder FA, Wey H-Y, Borra R, Wagner FF, Reis S, Kim SW, Holson EB, Haggarty SJ, Hooker JM. In Vivo Imaging of Histone Deacetylases (HDACs) in the Central Nervous System and Major Peripheral Organs. J Med Chem. 2014;57:7999–8009. doi: 10.1021/jm500872p. [DOI] [PMC free article] [PubMed] [Google Scholar]
- 16.Wey H-Y, Wang C, Schroeder FA, Logan J, Price JC, Hooker JM. Kinetic Analysis and Quantification of [11C]Martinostat for in Vivo HDAC Imaging of the Brain. ACS Chem Neurosci. 2015;6:708–715. doi: 10.1021/acschemneuro.5b00066. [DOI] [PMC free article] [PubMed] [Google Scholar]
- 17.Ren H, Wey H-Y, Strebl M, Neelamegam R, Ritter T, Hooker JM. Synthesis and Imaging Validation of [18F]MDL100907 Enabled by Ni-Mediated Fluorination. ACS Chem Neurosci. 2014;5:611–615. doi: 10.1021/cn500078e. [DOI] [PMC free article] [PubMed] [Google Scholar]
- 18.Wooten DW, Moraino JD, Hillmer AT, Engle JW, Dejesus OJ, Murali D, Barnhart TE, Nickles RJ, Davidson RJ, Schneider ML, Mukherjee J, Christian BT. In vivo kinetics of [F-18]MEFWAY: a comparison with [C-11]WAY100635 and [F-18]MPPF in the nonhuman primate. Synapse. 2011;65:592–600. doi: 10.1002/syn.20878. [DOI] [PMC free article] [PubMed] [Google Scholar]
- 19.Tsuzuki N, Hama T, Kawada M, Hasui A, Konishi R, Shiwa S, Ochi Y, Futaki S, Kitagawa K. Adamantane as a brain-directed drug carrier for poorly absorbed drug. 2. AZT derivatives conjugated with the 1-adamantane moiety. J Pharm Sci. 1994;83:481–484. doi: 10.1002/jps.2600830407. [DOI] [PubMed] [Google Scholar]
- 20.Liu J, Obando D, Liao V, Lifa T, Codd R. The many faces of the adamantyl group in drug design. Eur J Med Chem. 2011;46:1949–1963. doi: 10.1016/j.ejmech.2011.01.047. [DOI] [PubMed] [Google Scholar]
- 21.Molinspiration Property Calculation Services. 2002 www.molinspiration.com.
- 22.Tetko IV, Gasteiger J, Todeschini R, Mauri A, Livingstone D, Ertl P, Palyulin VA, Radchenko EV, Zefirov NS, Makarenko AS, Tanchuk VY, Prokopenko VV. Virtual computational chemistry laboratory--design and description. J Comput Aided Mol Des. 2005;19:453–463. doi: 10.1007/s10822-005-8694-y. [DOI] [PubMed] [Google Scholar]
- 23.VCCLAB, Virtual Computational Chemistry Laboratory. 2005 doi: 10.1007/s10822-005-8694-y. www.vcclab.org. [DOI] [PubMed]
- 24.Bordwell FG. Equilibrium acidities in dimethyl sulfoxide solution. Acc Chem Res. 1988;21:456–463. [Google Scholar]
- 25.Black KJ, Snyder AZ, Koller JM, Gado MH, Perlmutter JS. Template images for nonhuman primate neuroimaging, 1. Baboon. Neuroimage. 2001;14:736–743. doi: 10.1006/nimg.2001.0752. [DOI] [PubMed] [Google Scholar]
- 26.Schiffer WK, Mirrione MM, Biegon A, Alexoff DL, Patel V, Dewey SL. Serial microPET measures of the metabolic reaction to a microdialysis probe implant. J Neurosci Methods. 2006;155:272–284. doi: 10.1016/j.jneumeth.2006.01.027. [DOI] [PubMed] [Google Scholar]
Associated Data
This section collects any data citations, data availability statements, or supplementary materials included in this article.


