

Abstract
Drug development is a lengthy, costly process with low probability of success. Biopharmaceuticals are highly specific molecules, with efficacy and safety closely tied to target biology and pharmacology. The “learning−predicting−confirming” continuum by translational and clinical modeling and simulation (M&S) was implemented at every decision point for mavrilimumab, a human monoclonal antibody in development for rheumatoid arthritis (RA). This tutorial uses mavrilimumab as an example to demonstrate rational discovery, preclinical development, clinical study design, and dose selection of biotherapeutics by M&S.
Pharmaceutical discovery and development are highly regulated, with timelines typically spanning over 10 years. To cope with escalating research and development costs and high failure rates, there has been significant effort to shift product development from an empirical, inefficient attrition‐based paradigm to a quantitative, rational approach. Model‐based drug development (MBDD)1, 2 involves the integration of pharmacokinetics (PK), pharmacodynamics (PD; biomarkers and endpoints), disease progression, trial design, and other relevant information to describe complex biological systems and the action of drugs by mathematical and pharmacostatistical models.3, 4, 5 The intention of better system understanding is to make informed decisions and establish a more effective drug development process.
The concept of MBDD is closely associated with the advent of quantitative clinical pharmacology and pharmacometrics. In the early days, the primary focus of clinical pharmacology and pharmacometrics was to quantify and characterize observed interindividual variability in drug exposure. The first clinical trial simulation using a pharmacostatistical model for mycophenolate mofetil was published in 1998.6 Sheiner7 later proposed modeling and simulation‐based “learn and confirm” cycles in clinical development. The US Food and Drug Administration guidance on evidence of effectiveness8 indicates that understanding of PK properties and well‐defined exposure−response relationships may form a basis for a new dosing regimen. Two separate sets of guidelines followed, on population PK9 and exposure−response relationships,10 describing the potential uses of these tools in drug development and regulatory decision‐making. With the rapid advancement of computing power and new bioanalytical/data analysis methodologies, there has been increasing interest in using MBDD to evaluate clinical endpoints and study design, perform cross‐product comparison and, most recently, incorporate the tools of systems pharmacology.
Despite its promise, the extent of adoption of MBDD for new pharmaceutical development varies across the industry. In some cases, only a posteriori modeling and simulations are conducted to address specific regulatory inquiries for an investigational product that is already in clinical development. However, MBDD demands a more proactive, prediction‐based approach to reap its full rewards. This tutorial may serve as a precedent for more widespread and encompassing adoption of MBDD for rational drug discovery and development.
MODELING AND SIMULATION FOR BIOPHARMACEUTICALS
Compared with small molecules, biologics are more target‐specific. The desired pharmacological response is closely related to target modulation, and biologics normally show less off‐target toxicity. The treatment response typically lasts for days, if not weeks, due to potentially higher affinity to targets and longer PK half‐lives, particularly for monoclonal antibodies and fragment crystallizable (Fc)‐fusion proteins. This has implications for dose and dosing frequency. As such, biologics and their targets are ideal subjects for MBDD. Examples of early applications of modeling for rational biologics development include the prediction of delayed but pronounced elevation of red blood cells by erythropoietin products,11 characterization of nonlinear PK by target‐mediated clearance,12, 13 and translational modeling of tumor response in xenograft mice.14 Clinical modeling and simulation (M&S) has been successfully used to support switching from weight‐based (mg/kg) dosing to fixed dosing in subjects,15, 16 bridging across patient populations,17 administering of adult dose to adolescents,18, 19, 20 and even product approval of a tumor necrosis factor (TNF) antagonist in juvenile arthritis subjects without an efficacy trial.21 This was all made possible by understanding and representing the drug's mechanism of action (MOA) with mechanistic computer models.
It should be noted that, at this moment, there are some scientific challenges for the quantitative modeling approach for biopharmaceutical development (e.g., mechanistic understanding of the immunogenicity response; cytokine‐mediated drug–drug interactions; and instances in which the conventional PK‐PD relationship needs to be reconsidered, e.g. for immune‐oncology and immune‐modulating products).
As new biopharmaceuticals with novel scaffolds, such as antibody‐drug conjugate (ADC), immunotoxins, bispecific antibodies, and oncolytic viruses, enter clinical development, MBDD can play a larger role in the dose selection and characterization of exposure−response relationships for these molecules. Together with pharmacometrics, a systems pharmacology approach can greatly facilitate and integrate the translational research and development of such novel biologics and mechanism‐based combination therapies.
MODEL‐BASED DISCOVERY AND DEVELOPMENT OF MAVRILIMUMAB
MBDD has been widely used to facilitate the clinical development of small molecules and biologics.1, 2 In this tutorial, we use mavrilimumab, a human immunoglobulin G4 (IgG4) against the granulocyte‐macrophage colony‐stimulating factor receptor α (GM‐CSFRα) for rheumatoid arthritis (RA) treatment, as an example to demonstrate the application of M&S at every stage of biologic discovery and development.
The extended “learning−predicting−confirming” cycles for discovery, preclinical, and clinical development of mavrilimumab are illustrated in Figure 1. The sequence started with an in‐depth study of the biology of the therapeutic target, the GM‐CSFRα, and translational simulations for antibody affinity goal setting. This approach continued through the preclinical and clinical development of mavrilimumab. At each decision point, performance of the a priori prediction was evaluated by comparison with the observed data, and any new information learned was incorporated into the model. Simulations were then conducted to aid the design of each subsequent study. Details of the “learning−predicting−confirming” cycle at each milestone are presented in the sections below. (At the time of this publication, phase III studies have not been initiated.)
Figure 1.

Continuum of “learning−predicting−confirming” cycles for mavrilimumab discovery and development. ACR, American College of Rheumatology; CTS, clinical trial simulation; DAS, Disease Activity Score; E−R, exposure−response; FIH, first‐in‐human; M&S, modeling and simulations; mAb, monoclonal antibody; MABEL, minimum anticipated biological effect; MD, multiple dose; NHP, non‐human primate; PK, pharmacokinetic; POC, proof‐of‐concept; Q2W, every 2 weeks; RO, receptor occupancy; SC, subcutaneous; TMDD, target‐mediated drug disposition.
TARGET AND AFFINITY EVALUATION
At the early discovery stage, considerations for the selection of an appropriate therapeutic target for monoclonal antibody (mAb) treatment include disease association, extracellular concentrations of soluble target, expression in tissues and cell membrane expression levels, binding affinity to endogenous ligand or receptor, and target turnover rate.22 Target‐mediated disposition is common for mAbs against membrane receptors, resulting in nonlinear PK at low concentration levels (antigen‐sink effect). High expression level of a target and/or rapid turnover may lead to an economically unacceptable large or frequent mAb dose required for target blockade sufficient to elicit a therapeutic effect.23 On the other hand, for a soluble target with low endogenous levels and rapid clearance, only high‐affinity antibodies can adequately suppress the target.24 If the discovery goal is to develop an antibody to block a particular signaling pathway, instead of using the effector function for stimulation or target cell killing, engineering an antibody with sufficiently high affinity is critical for future success. The antibody affinity requirement is especially important for the development of a new product in a competitive market like RA, in which a dosage for subcutaneous administration and a dosing interval no more frequent than every 2 weeks is desirable to meet patient preferences.
The GM‐CSF was initially identified by its ability to promote the formation of both granulocyte (neutrophil) and macrophage colonies from precursor cells. Later, it was also found to mediate the functional activation of many cell types involved in host defense, including mature neutrophils, eosinophils, and macrophages.25 Elevated GM‐CSF levels were observed in synovial fluid26, 27 and synovial membrane biopsies28 from subjects with RA. An integrated approach was adopted to engineer a mAb against the ligand‐binding α‐subunit of GM‐CSFR to block the GM‐CSF pathway, which is considered to play a key role in the pathogenesis of RA.
To facilitate the affinity goal setting, an in silico model was constructed for an anti‐GM‐CSFRα mAb assuming typical volume of distribution and clearance by the reticuloendothelial system as an endogenous IgG.29 The model also assumed a parallel target receptor‐mediated clearance pathway with a 1‐hour receptor turnover half‐life. From simulations, a theoretical affinity (KD) of 0.1 nM would be required to achieve and maintain >99% occupancy of GM‐CSFRα in blood for over 14 days at a subcutaneous dose of 1 mg/kg in subjects with RA (Figure 2).30 A number of biologic agents with various dosing regimens are available for the treatment of RA. A single subcutaneous injection, not more frequent than every other week dosing, would be more likely to be acceptable to patients compared with more complex dosing regimens. The model structure is shown in Figure 3.31 A lead IgG antibody, 574D04, was subsequently identified and further optimized to achieve <0.1 nM in vitro potency and affinity. Upon entering preclinical and clinical development, 574D04 was named CAM‐3001 and later mavrilimumab.30
Figure 2.

Antibody affinity goal predictions using in silico translational simulations. The translational model assumed typical absorption and disposition parameter values of an immunoglobulin G in humans (50% absolute bioavailability, 2.5 mL/kg/d clearance by the reticuloendothelial system, and 64 mL/kg distribution volume). For target‐binding and nonlinear elimination pathway, the model assumed a 20 pM granulocyte‐macrophage colony‐stimulating factor receptor (GM‐CSFR)α expression level and a 1‐hour receptor internalization rate. Republished with permission of John Wiley and Sons, Inc., from Minter et al.30; permission conveyed through Copyright Clearance Center, Inc.
Figure 3.

Population pharmacokinetic (PK) analysis of mavrilimumab in subjects with rheumatoid arthritis using a mechanistic model (shown in a). (b) Mavrilimumab internalization rate in granulocyte‐macrophage colony‐stimulating factor receptor (GM‐CSFR)α–expressing live cells was determined using quantitative fluorescent imaging of the concentration–time profiles. (c) The solid curves in visual predictive check plots represent the medians of 1,000 simulated profiles, and the dashed curves represent the 5th and 95th percentile simulated concentration values. The horizontal lines represent the lower quantitation limit of the PK assay (0.49 ng/mL). Ab, antibody; Abp, antibody in peripheral compartment; CLRES, clearance by reticuloendothelial system; IV, intravenous; kint, rate constant of receptor internalization; R, receptor. Republished with permission of John Wiley and Sons, Inc., from Wang et al.31; permission conveyed through Copyright Clearance Center, Inc.
The model was based on known kinetic characteristics of typical IgGs and the target, and assumed 50% subcutaneous absolute bioavailability, 2.5 mL/kg/day IgG clearance by the reticuloendothelial system, a distribution volume of 64 mL/kg, and 20 pM GM‐CSFRα, with a 1‐hour internalization rate for the receptor and antibody–receptor complex. Simulations were performed to predict the unoccupied receptor level in humans following a single 1 mg/kg subcutaneous dose. At such an early stage, stochastic simulations are usually not considered crucial: our approach is to err on the side of caution when assuming typical parameter values. Given the paucity of information, introducing artificial uncertainties at this point may obscure the key messages and confuse presentation of this information to research teams.
PRECLINICAL DEVELOPMENT
During preclinical development, in vitro and in vivo animal studies are continuously conducted to evaluate the pharmacological effects, PK properties, and potential toxicities of a candidate molecule. For biopharmaceuticals, due to their high affinity and specificity, both pharmacology and toxicity are usually target‐related. Because the target modulation greatly depends on the PK exposure in blood and tissues, and target levels may affect the PK of an antibody in ways that are difficult to predict empirically, the exposure−response relationships for both desired pharmacological effect and unwanted toxicity are best characterized using a translational modeling and simulation approach. The same approach can be used for rational dose selection for first‐in‐human (FIH) studies. To achieve such translation, it is not unusual to use a surrogate of the primary lead antibody should cross‐reactivity with relevant preclinical species be poor.
Although in vitro and in vivo pharmacology studies demonstrated high potency and efficacy of mavrilimumab or its murine surrogate in blocking the GM‐CSF pathway and reducing arthritis symptoms in mouse models, dose‐dependent and treatment duration‐dependent foamy macrophages in the lungs were observed in nonhuman primate toxicity studies.32 Further investigation revealed that the GM‐CSF pathway also plays a central role in the regulation of pulmonary surfactant homeostasis and alveolar macrophage activity.33 Accordingly, accumulation of phospholipids and proteins in lungs was observed in GM‐CSF knockout mice.33, 34, 35 Exposure−response analysis and translational simulations suggested that the observed PK exposure in cynomolgus monkeys at the no‐observed‐effect level (NOEL) would provide adequate coverage for mavrilimumab in subjects with RA at the therapeutic dose level.32 During clinical development, such safety margin assessment has been regularly performed upon availability of new data from clinical trials or nonclinical safety studies, in order to facilitate the appropriate dose selection for subjects with RA.
The FIH starting dose for mavrilimumab in subjects with RA was selected based on the minimum anticipated biological effect level (MABEL),36 as GM‐CSFRα was a novel therapeutic target involved in the immune system and, at the time, another IgG (TGN1412), albeit with a completely different MOA, had recently induced unexpected immune responses (cytokine storm) in healthy subjects.37, 38 The mechanistic PK model previously developed for antibody affinity goal setting was updated with the experimentally determined binding affinity of mavrilimumab and GM‐CSFRα internalization rate. A starting dose of 0.01 mg/kg was selected based on translational simulations for minimal and transient target receptor blockade. On the other hand, a top dose of 10 mg/kg was recommended for up to 12‐week suppression of GM‐CSF activity for PD evaluation in subjects with RA.30, 31
FIRST‐IN‐HUMAN STUDY
Typically, FIH studies for therapeutic antibodies can be conducted in subjects to evaluate the safety, tolerability, PK, and immunogenicity profiles. In a randomized, double‐blind, dose‐escalation phase I study, 32 subjects with RA on stable methotrexate received single intravenous escalating doses of mavrilimumab or placebo. To reduce the total number of subjects in the study and expedite the dose escalation, two unblinded subjects in cohort 1 received the mavrilimumab MABEL dose at 0.01 mg/kg and the next dose at 0.03 mg/kg (one subject each) for monitoring of unpredictable side effects. Five sequential double‐blinded cohorts followed to evaluate the safety and PK of mavrilimumab.39
As predicted by translational simulations, at lower dose levels, mavrilimumab was rapidly cleared due to GM‐CSFRα mediated internalization and intracellular degradation of the antibody–receptor complex. The observed individual PK data were adequately described by a mechanistic model (Figure 3).31 In addition to the first‐order elimination pathway via interactions with the neonatal receptors in the reticuloendothelial system, mavrilimumab binds to GM‐CSFRα, and the antibody–receptor complex is subsequently internalized and degraded. Kinetics of mavrilimumab internalization upon binding to GM‐CSFRα, as assessed in live cells using quantitative fluorescent imaging, was incorporated into this mechanistic model.40
Although mavrilimumab showed an adequate safety and tolerability profile up to a 10 mg/kg single dose in subjects with RA, information about the PD activity was limited. Sparse data from ex vivo testing of induction of SOCS3 mRNA by GM‐CSF suggested potential inhibition of SOCS3 mRNA by mavrilimumab at 1.0 and 3.0 mg/kg dose levels.39
To support the proper design of a proof‐of‐principle (POP) phase IIa study, the mechanistic PK model was used to simulate PK and GM‐CSFRα occupancy profiles in blood, knee joints, and lungs under various dosing scenarios. The absolute bioavailability and subcutaneous absorption rate were assumed to be the same as other human IgGs,41 and a typical body weight of 80 kg was used for fixed dosing calculation. Such simulations helped to bridge across the single‐dose, weight‐based (mg/kg), intravenous dosing method used in Phase I and multiple‐dose, fixed (mg) subcutaneous dosing in the proposed POP study. Based on receptor occupancy simulations, 10 mg mavrilimumab every 2 weeks was selected as a safe starting dose for the multiple‐dose study, due to minimal predicted GM‐CSFRα blockade in the lungs. On the other hand, it was proposed that 100 mg subcutaneously every 2 weeks would be an appropriate top dose for the efficacy assessment, given the predicted 99% GM‐CSFRα in blood and unaffected GM‐CSF activity in the lungs.
PROOF‐OF‐PRINCIPLE STUDY
A POP study is an early‐stage, dose‐ranging, multiple‐dose study conducted in a limited number of subjects with the aim of detecting target modulation and efficacy signals by an investigational product. The treatment duration is usually short, and cohort dose‐escalation scheme is typically used. For biopharmaceuticals in nononcology areas, the subcutaneous administration route is preferred.
The efficacy, safety, and tolerability of multiple subcutaneous doses of mavrilimumab in subjects with moderate to severe RA were evaluated in a phase IIa study (NCT01050998).42 In each cohort, 60 subjects were randomized in a 2:1 ratio to receive subcutaneously either mavrilimumab (10, 30, 50, or 100 mg) or placebo every other week for 12 weeks.
The outcome of the study confirmed a priori predictions by the FIH mechanistic PK model. The observed PK concentrations following multiple subcutaneous administrations overlapped projected profiles. As the GM‐CSF pathway is linked to alveolar macrophage function and clearance of lung surfactant proteins,33 a conservative starting dose of 10 mg selected based on receptor occupancy simulations proved safe and well tolerated, and allowed further cohort dose escalation for efficacy evaluation. On the other hand, the top 100 mg dose demonstrated rapid and significant effect over placebo on efficacy endpoints of the Disease Activity Score in 28 joints calculated with C‐reactive protein (DAS28−CRP) and American College of Rheumatology (ACR) response rates of 20/50/70 (ACR20/50/70; Figure 4).42 No significant changes in pulmonary function parameters were observed. There were no treatment‐related serious adverse events reported in the study.42
Figure 4.

Disease Activity Score (DAS)28−C‐reactive protein (CRP) and American College of Rheumatology (ACR)20 response (expressed as percent of responders) at week 12 of a proof‐of‐principle phase IIa study. Asterisks in the plots represent statistically significant difference between mavrilimumab and placebo groups (P < 0.05). Republished with permission of BMJ Publishing Group Limited, from Burmester et al.42; permission conveyed through Copyright Clearance Center, Inc.
Although, as predicted by receptor occupancy (RO) simulations, 100 mg mavrilimumab was the most efficacious dose, the observed efficacy of the 30 mg dose was much better than that of the 50 mg dose (Figure 4).42 The inverted response rate at 30 and 50 mg complicated the characterization of the dose−response relationship of mavrilimumab and the proper dose selection for the next proof‐of‐concept (POC) study. In addition, as observed in clinical trials for other RA therapies, there was a strong placebo effect acting as a confounder. All the above reasons made modeling and simulation a potentially helpful tool to clarify some of these inconsistencies.
To facilitate data interpretation, observed PK and efficacy data (DAS28−CRP, ACR20, and ACR50) from all placebo‐treated and mavrilimumab‐treated subjects were pooled and modeled using a population approach. A direct PD model with placebo effect was developed to describe the DAS28−CRP response. The dichotomous ACR response rates were modeled using logistic regression, where the logit of the probability of being an ACR responder was modeled as a sum of a placebo effect, a mavrilimumab treatment effect, and an additive interindividual random effect.40 The population efficacy models provided adequate fit to the observed DAS28−CRP and ACR20/50 data. Such a population approach took into account efficacy data from all placebo‐treated and mavrilimumab‐treated subjects at all clinical visits. Compared to week 12 efficacy snapshots for statistical p value assessments (Figure 4),42 the longitudinal modeling approach provided a more reliable characterization of the exposure−response relationship for mavrilimumab. This was a result of a greater sample size (subjects in all cohorts instead of one cohort) and the inclusion of all available data for analysis (all visits instead of one snapshot at week 12).
Stochastic clinical simulations were subsequently conducted using the efficacy models to aid the dose selection for a POC phase IIb study. The projected efficacy outcomes for various dosing scenarios were placed in a “Go/No‐Go” decision table, which had been developed by the project team to facilitate outcome evaluation of the POC study (Table 1). In this table, the red zone demarcates “No‐Go” decision and project termination, amber indicates the need to wait for further information from additional clinical trials, and green is “Go” (i.e., proceeding to pivotal trials). From clinical efficacy simulations, only the 150 mg dose was predicted to provide robust result in the green zone.
Table 1.
“Go/No‐Go” model for the mavrilimumab proof‐of‐concept study
| ACR20 difference from placebo | |||||
|---|---|---|---|---|---|
| <15% | 15–20% | 20–25% | >25% | ||
|
DAS28 difference from placebo |
<13% |
30 mg Q2W, 50 mg Q2W |
|||
| 13–15% | 100 mg Q4W | ||||
| 15–20% | 150 mg Q4W | 200 mg Q4W | 100 mg Q2W | ||
| >20% | 200 mg Q4W | 100 mg Q2W | 150 mg Q2W | ||
| For the indicated regimens, at least an 80% probability that the true mean responses for DAS28‐CRP (a reduction of >1.2 points from baseline) and ACR20 are jointly achieved. | |||||
ACR, American College of Rheumatology; DAS28, Disease Activity Score in 28 joints; Q2W, every 2 weeks; Q4W, every 4 weeks.
Further nonclinical safety evaluation in nonhuman primates and projected clinical PK exposure by the updated mechanistic model for subcutaneously administered mavrilimumab indicated adequate safety margin coverage for the 150 mg dose in subjects with RA.32 As such, a 150 mg every‐2‐week regimen was recommended as the top dose to be evaluated in the mavrilimumab POC study.
PROOF‐OF‐CONCEPT STUDY
A POC study aims to confirm the efficacy signals from early‐stage studies, and to demonstrate clinically meaningful therapeutic benefit of an investigational drug prior to embarking on lengthy and costly pivotal trials. The sample size and treatment duration are typically greater than early‐stage studies, and a parallel‐cohort design is the norm for POC trials.
A multicenter, double‐blind, parallel‐group, placebo‐controlled, phase IIb study for mavrilimumab was conducted in subjects with RA who had inadequate response to at least one traditional disease‐modifying antirheumatic drug and had received stable methotrexate (NCT01706926). Based on prior efficacy simulations, 150 mg was added to the POC study as the top dose expected to maximize the therapeutic efficacy of mavrilimumab. Compared to the prior POP study, this POC study had a greater sample size (n = 80/dose instead of 40) and the treatment period was longer (24 instead of 12 weeks). The co‐primary endpoints were DAS28−CRP at week 12 and ACR20 at week 24.
Mavrilimumab significantly decreased RA disease activity, and the 150 mg dose selected by a priori clinical simulations substantially outperformed two lower doses in all efficacy and exploratory PD biomarker endpoints (Figure 5).43 Mavrilimumab was well tolerated and no apparent pulmonary function safety signals were noted for mavrilimumab‐treated subjects compared with those receiving placebo.43
Figure 5.

Weeks 12 and 24 American College of Rheumatology (ACR) responses and subject dropout (rescue) profile of a proof‐of‐concept phase IIb study. Republished with permission of BMJ Publishing Group Limited, from Burmester et al.43; permission conveyed through Copyright Clearance Center, Inc.
According to the study protocol, after week 12, subjects without adequate response to the investigational product (<20% improvement in both swollen and tender joint counts compared with day 1) were eligible to voluntarily withdraw and be transferred to a long‐term, open‐label extension (OLE; NCT01712399). This resulted in substantial subject dropouts in the placebo cohort and, to a lesser extent, in the 30 and 100 mg cohorts. In contrast, there was no change in dropout pattern throughout the 24‐week treatment period for the 150 mg cohort (Figure 5).43 Per protocol, subjects who withdrew from treatment for any reason were imputed as nonresponders for all subsequent assessments. As such, to properly analyze the POC outcome, an efficacy model had to take into consideration the dropout effect.
The exposure−response−dropout model that was developed based on the POC data is shown in Figure 6 (See Supplementary file: ACR20 model). A joint probability model was incorporated to describe the risk of voluntary dropout at each scheduled visit. From population modeling, the hazard of subject dropout prior to the next scheduled visit in this double‐blind study was significantly higher in ACR20 nonresponders, and substantially elevated at week 12 when voluntary subject rescue to the OLE was permitted by the protocol.44, 45 The visual predictive check plot for the exposure−response−dropout model is shown in Figure 7.45 Further clinical simulations indicated that the maximum efficacy for ACR20, DAS28−CRP response, and remission rate was reached at the 150 mg mavrilimumab dose. Additional longitudinal meta‐analysis of ACR20 response47 suggested that 150 mg of mavrilimumab in the POC study performed at least as well as the leading biopharmaceuticals for RA treatment.
Figure 6.

Pharmacokinetic‐efficacy‐dropout model for mavrilimumab in subjects with rheumatoid arthritis. Ab, antibody; Abp, antibody in peripheral compartment; ACR, American College of Rheumatology; DAS28, Disease Activity Score in 28 joints; EC50, the concentration of a drug that gives half‐maximal response; Emax, the maximal response; F, bioavailability; ka, absorption rate constant; kint, rate constant of receptor internalization; kpbo, rate constant describing placebo effect; Pmax, maximal response of placebo group; Q, intercompartmental clearance; R, receptor; SC, subcutaneous.
Figure 7.
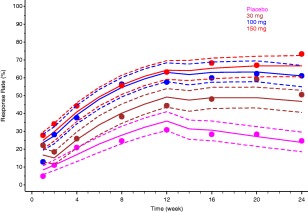
Observed (full circles) and model‐predicted (continuous lines) American College of Rheumatology 20 response for mavrilimumab proof‐of‐concept in subjects with rheumatoid arthritis. Dashed and dotted lines show the typical (median) and 95% confidence interval for the prediction, respectively.45
PIVOTAL STUDY
The pivotal stage is the last phase of clinical development for an investigational drug prior to application for marketing authorization. Pivotal studies are designed and executed to obtain statistically significant and clinically meaningful evidence of safety and effectiveness of an investigational drug for the identified therapeutic use. Upon completion of pivotal phase III studies, a meta‐analysis will typically commence with data from all clinical studies being merged and simultaneously modeled to adequately characterize the PK properties and/or exposure−response relationships of an investigational drug, and to support the application for marketing authorization. For biopharmaceuticals, such a population‐based meta‐analysis may also serve as the basis for clinical pharmacology evaluations and characteristics, such as drug−drug interaction potential and dose adjustment for special populations. Pivotal studies with mavrilimumab have not been conducted yet.
OTHER CONSIDERATIONS
In drug development, there has been an increasing effort in developing companion diagnostic and/or predictive biomarker to aid subject selection and treatment decisions. Such efforts are usually described as “precision medicine,” and relate to the common goal of achieving personalized medical treatment as a matter of routine. However, promising PD biomarker results from early‐stage clinical studies may be confounded by different dose levels being investigated (i.e., more pronounced biomarker response and better clinical efficacy are observed in subjects receiving a higher dose). In this case, without modeling support and a proper interpretation of exposure−response relationships, a claimed biomarker−efficacy relationship solely based on observations could be misleading. In addition, successful establishments of a PK‐PD biomarker relationship and a PK−efficacy relationship do not always translate into a clinically meaningful biomarker−efficacy relationship, as observed PD variability may preclude precise prediction of individual treatment response (efficacy) based on biomarker information. The clinical relevance of a PD biomarker is best assessed at the therapeutic dose level using a modeling approach, in which the biomarker data are evaluated as a covariate for efficacy of an investigational drug. Such methodology has been implemented in late‐stage development of some other biopharmaceuticals, including benralizumab,48 anifrolumab,18 tralokinumab,20 and durvalumab.43
SUMMARY
In this tutorial, we presented the continuum of “learning−predicting−confirming” cycles throughout the discovery and development of mavrilimumab, an investigational mAb for RA treatment. We started with a simple binding model for antibody affinity goal setting. Next, the in vitro experimentally determined antibody binding affinity and receptor internalization kinetics were incorporated into the mechanistic PK model for MABEL dose selection and clinical PK data analysis. The model‐predicted PK and RO profiles successfully bridged the single‐dose, weight‐based, intravenous dosing used in FIH and the multiple‐dose, fixed (mg) subcutaneous dosing of a POP phase IIa study. The efficacy endpoint M&S suggested a higher dose (150 mg) to be evaluated in the POC phase IIb study. The outcome of the POC study confirmed superior efficacy of the 150 mg dose, and revealed unbalanced subject dropout patterns across dose groups. An ACR20 and time‐dependent dropout model was developed, and the exposure−response−dropout model adequately described the observed DAS28−CRP and ACR response profiles in subjects with RA. As the GM‐CSF pathway also plays a key role in regulating pulmonary surfactant homeostasis,33 the observed and model‐predicted PK exposure in subjects with RA have been constantly examined throughout the clinical development of mavrilimumab to continually ensure adequate safety margin coverage by nonclinical safety studies in nonhuman primates.
As described above, quantitative model development is a continually evolving process: new information is constantly incorporated into a model to better characterize the candidate drug and further improve the predictability for the outcome of each nonclinical and clinical study. Given high target specificity and affinity, a biotherapeutic, such as a mAb, is an ideal subject for MBDD. The extended “learning−predicting−confirming” cycles and implementation of the model‐based approach can greatly facilitate data interpretation and informative decision‐making during the development of biologic products.
Conflict of Interest
D.J. is an employee of MedImmune and received personal fees outside the submitted work. C.Y.W. was an employee of MedImmune at the time of the study and received personal fees outside of the submitted work. P.V. is an employee of MedImmune and received personal fees from MedImmune outside the submitted work, and he is also an Associate Editor of CPT: Pharmacometrics & Systems Pharmacology. L.R. is an employee of MedImmune and holds stock options in MedImmune. At the time that the work was carried out, B.W. was an employee of MedImmune and he holds stock options in MedImmune. He also received payments from MedImmune outside the submitted work. P.V. was not involved in the review or decision process of this article.
Supporting information
Supplementary File 1 Mechanistic PK model for mavrilimumab in RA patients
Supplementary File 2 Mavrilimumab ACR20 model with dropouts
Acknowledgments
MedImmune pharmacokineticists Yvonne Lau, PhD, Young Qin, BS, and Mikhail Zusmanovich, BS, and Kenneth G. Kowalski, MS, of Ann Arbor Pharmacometrics Groups assisted with the data analysis for mavrilimumab nonclinical and clinical studies. The authors would also like to acknowledge the critical contributions of Patricia Ryan, PhD, Matthew Sleeman, PhD, Wendy White, PhD, Heidi Towers, PhD, and David Close, PhD, to the mavrilimumab development program. Roger Wild (QXV Comms; Macclesfield, UK), an Ashfield Company, part of UDG Healthcare), provided editorial support funded by MedImmune, Gaithersburg, MD, in accordance with Good Publication Practice (GPP3) guidelines (http://www.ismpp.org/gpp3).
Author Contributions
C.Y.W. designed research and analyzed data. D.J. analyzed data. P.V. designed research. L.R. designed research, analyzed data, and provided new reagents/analytical tools. B.W. designed and performed the research, analyzed data, and drafted the manuscript. All authors were involved in critically revising the manuscript for intellectual content and all authors approved the final version of the manuscript.
References
- 1. Lalonde, R.L. et al Model‐based drug development. Clin. Pharmacol. Ther. 82, 21–32 (2007). [DOI] [PubMed] [Google Scholar]
- 2. Milligan, P.A. et al Model‐based drug development: a rational approach to efficiently accelerate drug development. Clin. Pharmacol. Ther. 93, 502–514 (2013). [DOI] [PubMed] [Google Scholar]
- 3. Mould, D.R. & Upton, R.N. Basic concepts in population modeling, simulation, and model‐based drug development. CPT Pharmacometrics Syst. Pharmacol. 1, e6 (2012). [DOI] [PMC free article] [PubMed] [Google Scholar]
- 4. Mould, D.R. & Upton, R.N. Basic concepts in population modeling, simulation, and model‐based drug development − part 2: introduction to pharmacokinetic modeling methods. CPT Pharmacometrics Syst. Pharmacol. 2, e38 (2013). [DOI] [PMC free article] [PubMed] [Google Scholar]
- 5. Upton, R.N. & Mould, D.R. Basic concepts in population modeling, simulation, and model‐based drug development: part 3 − introduction to pharmacodynamic modeling methods. CPT Pharmacometrics Syst. Pharmacol. 3, e88 (2014). [DOI] [PMC free article] [PubMed] [Google Scholar]
- 6. Hale, M.D. et al The pharmacokinetic‐pharmacodynamic relationship for mycophenolate mofetil in renal transplantation. Clin. Pharmacol. Ther. 64, 672–683 (1998). [DOI] [PubMed] [Google Scholar]
- 7. Sheiner, L.B. Learning versus confirming in clinical drug development. Clin. Pharmacol. Ther. 61, 275–291 (1997). [DOI] [PubMed] [Google Scholar]
- 8.U.S. Food and Drug Administration, Center for Drug Evaluation and Research (CDER) and Center for Biologics Evaluation and Research (CBER). Guidance for Industry: Providing Clinical Evidence of Effectiveness for Human Drug and Biological Products. <http://www.fda.gov/downloads/Drugs/GuidanceCompliance%20RegulatoryInformation/Guidances/UCM078749.pdf> (1998).
- 9.U.S. Food and Drug Administration, Center for Drug Evaluation and Research (CDER) and Center for Biologics Evaluation and Research (CBER). Guidance for Industry: Population Pharmacokinetics. <http://www.fda.gov/downloads/ScienceResearch/SpecialTopics/WomensHealthResearch/UCM133184.pdf> (1999).
- 10.U.S. Food and Drug Administration, Center for Drug Evaluation and Research (CDER) and Center for Biologics Evaluation and Research (CBER). Guidance for Industry: Exposure−Response Relationships − Study Design, Data Analysis, and Regulatory Applications. <http://www.fda.gov/downloads/drugs/guidancecomplianceregulatoryinformation/guidances/ucm072109.pdf> (2003).
- 11. Harker, L.A. et al Effects of megakaryocyte growth and development factor on platelet production, platelet life span, and platelet function in healthy human volunteers. Blood 95, 2514–2522 (2000). [PubMed] [Google Scholar]
- 12. Bauer, R.J. , Dedrick, R.L. , White, M.L. , Murray, M.J. & Garovoy, M.R. Population pharmacokinetics and pharmacodynamics of the anti‐CD11a antibody hu1124 in human subjects with psoriasis. J. Pharmacokinet. Biopharm. 27, 397–420 (1999). [DOI] [PubMed] [Google Scholar]
- 13. Roskos, L.K. , Lum, P. , Lockbaum, P. , Schwab, G. & Yang, B.B. Pharmacokinetic/pharmacodynamic modeling of pegfilgrastim in healthy subjects. J. Clin. Pharmacol. 46, 747–757 (2006). [DOI] [PubMed] [Google Scholar]
- 14. Shah, D.K. , Haddish‐Berhane, N. & Betts, A. Bench to bedside translation of antibody drug conjugates using a multiscale mechanistic PK/PD model: a case study with brentuximab‐vedotin. J. Pharmacokinet. Pharmacodyn. 39, 643–659 (2012). [DOI] [PubMed] [Google Scholar]
- 15. Wang, B. et al A preliminary population pharmacokinetic analysis of panitumumab, a fully human IgG2 anti‐EGFR monoclonal antibody. AAPS J. 6(suppl 1), abstract 2375 (2004). [Google Scholar]
- 16. Wang, D.D. , Zhang, S. , Zhao, H. , Men, A.Y. & Parivar, K. Fixed dosing versus body size‐based dosing of monoclonal antibodies in adult clinical trials. J. Clin. Pharmacol. 49, 1012–1024 (2009). [DOI] [PubMed] [Google Scholar]
- 17. Wang, B. et al Population pharmacokinetics and pharmacodynamics of benralizumab in healthy volunteers and asthma patients. Annual Meeting of the Population Approach Group in Europe, June 11 − 14, 2013, Glasgow, UK, abstract 2810 (2013).
- 18. Wang, B. et al Pharmacogenomics and translational simulations to bridge indications for an anti‐interferon‐α receptor antibody. Clin. Pharmacol. Ther. 93, 483–492 (2013). [DOI] [PubMed] [Google Scholar]
- 19. Xu, Z. , Davis, H.M. & Zhou, H. Rational development and utilization of antibody‐based therapeutic proteins in pediatrics. Pharmacol. Ther. 137, 225–247 (2013). [DOI] [PubMed] [Google Scholar]
- 20. Baverel, P.G. et al Pharmacokinetics of tralokinumab in adolescents with asthma: implications for future dosing. Br. J. Clin. Pharmacol. 80, 1337–1349 (2015). [DOI] [PMC free article] [PubMed] [Google Scholar]
- 21. Hutmacher, M.M. , Nestorov, I. , Ludden, T. , Zitnik, R. & Banfield, C. Modeling the exposure‐response relationship of etanercept in the treatment of patients with chronic moderate to severe plaque psoriasis. J. Clin. Pharmacol. 47, 238–248 (2007). [DOI] [PubMed] [Google Scholar]
- 22. Tiwari, A. , Abraham, A.K. , Harrold, J.M. , Zutshi, A. , & Singh, A. Optimal affinity of a monoclonal antibody: guiding principles using mechanistic modeling. AAPS J. 19, 510–519 (2017). [DOI] [PubMed] [Google Scholar]
- 23. Dudal, S. Integrated pharmacokinetic, pharmacodynamic and immunogenicity profiling of an anti‐CCL21 monoclonal antibody in cynomolgus monkeys. mAbs 7, 829–837 (2015). [DOI] [PMC free article] [PubMed] [Google Scholar]
- 24. Roskos, L. , Klakamp, S. , Liang, M. , Arends, R. & Green, L. Molecular Engineering II: Antibody Affinity. Handbook of Therapeutic Antibodies (Wiley‐VCH Verlag GmbH, Weinheim, Germany, 2007). [Google Scholar]
- 25. Baldwin, G.C. The biology of granulocyte‐macrophage colony‐stimulating factor: effects on hematopoietic and nonhematopoietic cells. Dev. Biol. 151, 352–367 (1992). [DOI] [PubMed] [Google Scholar]
- 26. Bell, A.L. , Magill, M.K. , McKane, R. & Irvine, A.E. Human blood and synovial fluid neutrophils cultured in vitro undergo programmed cell death which is promoted by the addition of synovial fluid. Ann. Rheum. Dis. 54, 910–915 (1995). [DOI] [PMC free article] [PubMed] [Google Scholar]
- 27. Ottonello, L. et al Delayed neutrophil apoptosis induced by synovial fluid in rheumatoid arthritis: role of cytokines, estrogens, and adenosine. Ann. NY Acad. Sci. 966, 226–231 (2002). [DOI] [PubMed] [Google Scholar]
- 28. Farahat, M.N. , Yanni, G. , Poston, R. & Panayi, G.S. Cytokine expression in synovial membranes of patients with rheumatoid arthritis and osteoarthritis. Ann. Rheum. Dis. 52, 870–875 (1993). [DOI] [PMC free article] [PubMed] [Google Scholar]
- 29. Roskos, L. , Davis, C.G. & Schwab, G.M. The clinical pharmacology of therapeutic monoclonal antibodies. Drug Dev. Res. 61, 108–120 (2004). [Google Scholar]
- 30. Minter, R.R. et al Protein engineering and preclinical development of a GM‐CSF receptor antibody for the treatment of rheumatoid arthritis. Br. J. Pharmacol. 168, 200–211 (2013). [DOI] [PMC free article] [PubMed] [Google Scholar]
- 31. Wang, B. et al Mechanistic modeling of antigen sink effect for mavrilimumab following intravenous administration in patients with rheumatoid arthritis. J. Clin. Pharmacol. 52, 1150–1161 (2012). [DOI] [PubMed] [Google Scholar]
- 32. Ryan, P.C. et al Nonclinical safety of mavrilimumab, an anti‐GMCSF receptor alpha monoclonal antibody, in cynomolgus monkeys: relevance for human safety. Toxicol. Appl. Pharmacol. 279, 230–239 (2014). [DOI] [PubMed] [Google Scholar]
- 33. Trapnell, B.C. & Whitsett, J.A. Gm‐CSF regulates pulmonary surfactant homeostasis and alveolar macrophage‐mediated innate host defense. Annu. Rev. Physiol. 64, 775–802 (2002). [DOI] [PubMed] [Google Scholar]
- 34. Dranoff, G. et al Involvement of granulocyte‐macrophage colony‐stimulating factor in pulmonary homeostasis. Science 264, 713–716 (1994). [DOI] [PubMed] [Google Scholar]
- 35. Stanley, E. et al Granulocyte/macrophage colony‐stimulating factor‐deficient mice show no major perturbation of hematopoiesis but develop a characteristic pulmonary pathology. Proc. Natl. Acad. Sci. USA 91, 5592–5596 (1994). [DOI] [PMC free article] [PubMed] [Google Scholar]
- 36. Muller, P.Y. , Milton, M. , Lloyd, P. , Sims, J. & Brennan, F.R. The minimum anticipated biological effect level (MABEL) for selection of first human dose in clinical trials with monoclonal antibodies. Curr. Opin. Biotechnol. 20, 722–729 (2009). [DOI] [PubMed] [Google Scholar]
- 37. Wadman, M. London's disastrous drug trial has serious side effects for research. Nature 440, 388–389 (2006). [DOI] [PubMed] [Google Scholar]
- 38. Stebbings, R. , Poole, S. & Thorpe, R. Safety of biologics, lessons learnt from TGN1412. Curr. Opin. Biotechnol. 20, 673–677 (2009). [DOI] [PubMed] [Google Scholar]
- 39. Burmester, G.R. , Feist, E. , Sleeman, M.A. , Wang, B. , White, B. & Magrini, F. Mavrilimumab, a human monoclonal antibody targeting GM‐CSF receptor‐α, in subjects with rheumatoid arthritis: a randomised, double‐blind, placebo‐controlled, phase I, first‐in‐human study. Ann. Rheum. Dis. 70, 1542–1549 (2011). [DOI] [PMC free article] [PubMed] [Google Scholar]
- 40. Wang, B. et al Population pharmacokinetics and pharmacodynamics of mavrilimumab in rheumatoid arthritis patients. Annual Meeting of the Population Approach Group in Europe, June 5 − 8, 2012, Venice, Italy, abstract 2611 (2012).
- 41. Oh, C.K. et al An open‐label, single‐dose bioavailability study of the pharmacokinetics of CAT‐354 after subcutaneous and intravenous administration in healthy males. Br. J. Clin. Pharmacol. 69, 645–655 (2010). [DOI] [PMC free article] [PubMed] [Google Scholar]
- 42. Burmester, G.R. et al Efficacy and safety of mavrilimumab in subjects with rheumatoid arthritis. Ann. Rheum. Dis. 72, 1445–1452 (2013). [DOI] [PMC free article] [PubMed] [Google Scholar]
- 43. Burmester, G.R. et al A randomised phase IIb study of mavrilimumab, a novel GM‐CSF receptor alpha monoclonal antibody, in the treatment of rheumatoid arthritis. Ann. Rheum. Dis. 76, 1020–1030 (2017). [DOI] [PubMed] [Google Scholar]
- 44. Wu, C. , Jin, D. , Godwood, A. , Close, D. , Roskos, L. & Wang, B. Exposure‐response analysis for mavrilimumab phase 2b study in RA patients with informative dropout. ACR/ARHP Annual Meeting, November 14 − 19, 2014, Boston, MA, abstract 1496 (2014).
- 45. Wu, C. , Jin, D. , Roskos, L. & Wang, B. Informative dropout modeling and exposure−response analysis for mavrilimumab phase 2b study in patients with rheumatoid arthritis. ASCPT Annual Meeting, March 3 − 7, 2015, New Orleans, LA, abstract #PII‐055 (2015).
- 46. Demin, I. , Hamrén, B. , Luttringer, O. , Pillai, G. & Jung, T. Longitudinal model‐based meta‐analysis in rheumatoid arthritis: an application toward model‐based drug development. Clin. Pharmacol. Ther. 92, 352–359 (2012). [DOI] [PubMed] [Google Scholar]
- 47. Wang, B. et al Exposure‐response analysis for determination of benralizumab optimal dosing regimen in adults with asthma. Am. J. Respir. Crit. Care Med. 189, A1324 (2014). [Google Scholar]
- 48. Fairman, D. et al Pharmacokinetics of MEDI4736, a fully human anti‐PDL1 monoclonal antibody, in patients with advanced solid tumors. J. Clin. Oncol. 32 (15s suppl), abstract 2602 (2014). [Google Scholar]
Associated Data
This section collects any data citations, data availability statements, or supplementary materials included in this article.
Supplementary Materials
Supplementary File 1 Mechanistic PK model for mavrilimumab in RA patients
Supplementary File 2 Mavrilimumab ACR20 model with dropouts