ABSTRACT
The size distribution of complete 16S-rRNA sequences from the SILVA-database and nucleotide shifts that might interfere with the secondary structure of the molecules were evaluated. Overall, 513,309 sequences recorded in SILVA were used to estimate the size of hypervariable regions of the gene. Redundant sequences were treated as a single sequence to achieve a better representation of the molecular diversity. Nucleotides found in each position in 95% of the sequences were considered the consensus sequences for different size-groups (consensus95). The sizes of different regions ranged from 96.7 to 283.1 nucleotides and had similar distribution patterns, except for the V3 region, which exhibited a bimodal distribution composed of 2 main peaks of 161 and 186 nt. The alignment of Consensuses95 of fractions 161 and 186 showed a high degree of similarity and conservation, except for the central positions (gap zone), where the sequence was highly variable and several deletions were observed. Structurally, the gap zone forms the central part of helix 17 (H17), and its extension was directly reflected in the size of this helix. H17 is part of a multihelix conjunction known as the 5-way junction (5 WJ), which is indispensable for 30 S ribosome assembly. However, because a drastic variation in the sequence size of V3 region occurs at a central position in loop H17 without affecting the base of the loop, it has no apparent effect on 5 WJ. Finally, considering that these differences were detected in non-redundant sequences, it can be concluded that this is not an uncommon or isolated event and that the V3 region is possibly more likely to mutate than are other regions.
KEYWORDS: 5-way junction, bacterial rRNA, 16S gene, helix 17, k-mers, V3 pattern, V3 size different
Introduction
The 16S rRNA gene is probably the most common molecular biomarker for the identification of prokaryotes; it has served as the master key for phylogeny-based identification, microbial community composition and structure.1-3 16S gene databases are considered reference frameworks for mapping the fragmentary sequences produced by high-throughput sequencing platforms.1,3 Each particular sequence represents the occurrence of a prokaryotic taxon in a sampled community.4 This information contributes to the understanding of meaningful ecological patterns and the interrelationships between guests and hosts. Helical regions of the molecule exhibit considerable variation, which accumulate through a compensatory mutation process. These regions are also called hypervariable regions and have been used as differentiators; however, recent evidence has demonstrated that conserved regions may also exhibit some degree of variation, thus potentially introducing bias.5,6
Differences in 16S gene size have been detected in different bacteria species, ranging from ∼1200 to ≥ 1500 nucleotides; this can also be confirmed by database sequence mining. However, it is difficult to obtain larger fractions of partial sequences because the primers used for in silico tests are not universal. Recently, a method using k-mers that allows the determination of the most conserved regions of each rRNA region has been described.5 Taking advantage of this method, most of the reported sequences, either partial or complete, could be linked from robust databases and grouped to be studied.
Several reports have described the compensatory mutation process of RNA helices as the main factor contributing to variability in the 16S gene sequence, with AU and UA pairs 7-9 and single insertions and deletions (indel) as the major factors influencing size.
Despite previous reports that have described indel occurrence in different regions of the 16S rRNA gene,10,11 there have been no reports regarding the effect of these mutations on the size of the gene and its various internal regions from a universal perspective. This information could serve not only to broaden horizons in terms of knowledge about the molecule but also to detect possible 16S rRNA species, optimize the taxonomic classifications of prokaryotes and provide information about mutation processes and patterns.
In contrast, it is important to evaluate if these differences in size could have any effect on the secondary structure of the 16S rRNA molecule. Ribosomes consist of 2 asymmetric subunits, which are both composed of RNA and protein. Previous studies have revealed that the reference bacterium, Escherichia coli, has ribosomes composed of a small 30 S subunit consisting of a complex of 16S rRNA (1542 nucleotides) and 21 proteins. The structure contains approximately 50 helical elements that are interconnected by multi-helix junction loops or by single-stranded linkers. Each helical element comprises one or more helices connected by internal loops occurring throughout the molecule. 12-15 It is important to maintain the structure because there are segments that play essential roles in ribosome function. For instance, ribosomal proteins attach to 16S rRNA in a hierarchical order, which produces a cooperativity effect; 16-19 however, it is possible that structural variations would affect this process. In this respect, information concerning the size distribution of the different variable regions would contribute to identifying and locating mutable fractions within the molecule and evaluating if these affect the structure of the molecule.
Therefore, the aims of this study were (1) to determine the size distribution of the variable regions of the 16S rRNA gene using the k-mers strategy, (2) to determine if significant nucleotide fragment shifts could interfere with important components of the secondary structure of the 16S rRNA and (3) to associate taxonomic groups with size distribution.
Material and methods
The 513,309 bacteria sequences recorded in the high-quality rRNA database SILVA SSU Ref NR 99 (release 123), which contains non-redundant bacterial sequences of at least 1200 bases in length, were used to estimate the size of the 9 hypervariable regions of the 16S rRNA gene. The distance between conserved regions was calculated using a 12-mers technique, based on the algorithm reported by Martínez-Porchas et al.5 In short, primers that had been reported as matches of each conserved region were assembled to form contigs; sequences of 12 nucleotides (12-mers) were extracted from these contigs and used to search the entire set of SILVA sequences. If a 12-mer contained degenerations, each isoform was considered for analysis.
The most frequent 12-mers (Table 1) for consecutive regions were selected and used to recover the corresponding fragment from each sequence contained in the SILVA database. Operations and data manipulation were performed using a homemade-PHP script.
Table 1.
12-mers from each conserved region of the 16 S rRNA gene detected with the highest frequency and used as markers to recover the variable regions.
| Conserved Region | Sequence | Frequency |
|---|---|---|
| 1 | ATYMTGGCTCAG | 195,901 (38.16%) |
| 2 | SYGGCGNACGGG | 405,570 (79.01%) |
| 3 | GGRNGGCNGCAG | 500,253 (97.46%) |
| 4 | CVGCNGCYGCGG | 496,412 (96.71%) |
| 5 | TAGAWACCCNNG | 493,348 (96.11%) |
| 6 | RAATWGRCGGGG | 501,792 (97.76%) |
| 7 | GYYGYCGTCAGC | 499,976 (97.40%) |
| 8 | AGGYGGGGAYGA | 454,807 (88.60%) |
| 9 | GYACWCWCCGCC | 388,911 (75.77%) |
| 10 | AGTCRTAACAAG | 172,918 (33.69%) |
Recovering sequences
After recovering sequences and eliminating redundant sequences, size distribution was calculated considering only those covered with a confidence interval of 99% (mean ± 2 Std. Dev.), and the frequency distribution was estimated. Only non-redundant (NR) sequences were considered to achieve a better representation of molecular diversity.
Consensus
Nucleotides that were found at each position in 95% of the fragments were considered to be a consensus sequence (consensus95) for the different sequence sets. This method assigns the nucleotide detected in 95% (or more) of the sequences as representative of the position. If 2 or more nucleotides are required to reach 95%, the position is marked with an asterisk, or the corresponding ambiguity symbol is assigned.
The Escherichia coli 16S rRNA sequence was used as a reference to establish nucleotide positions. Thereafter, consensuses95 of the 2 most frequent size groups of region V3 (group 161 vs 186 nt) were aligned and compared. Because this region in E coli is 186 nucleotides long, consensus95 of this size was manually aligned with the consensus95 of 161 nucleotides. To confirm the model, all NR sequences were manually aligned from the ends, leaving gaps in the middle zone. The consensus95 was then determined, indicating ambiguous bases when necessary.
Taxa distribution
The proportion of the most frequent sizes (161 and 186) of the V3 region occurring in each phylum was determined. In addition, the occurrence of different sizes within this hypervariable region was associated with classes belonging to the phyla Firmicutes and Proteobacteria.
Results
Fragments containing the variable region and parts of the flanking conserved regions were successfully extracted from the sequences by using the most frequent 12-mer (Table 1). Despite having conserved segments, the fragment was assigned as the variability-containing region.
Size
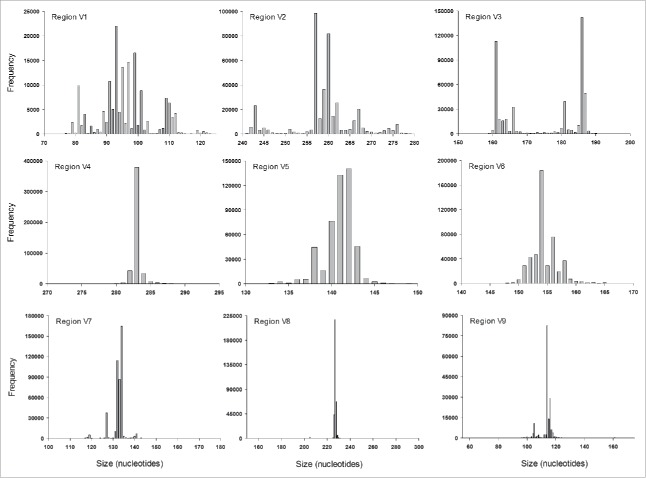
The size of the different fragments obtained registered mean values ranging from 96.7 (V1) to 283.1 (V4) nucleotides, with their respective variation (Table 2). Fragments of different regions showed similarities in size distribution; i.e., they tended to cluster around a central value with the highest frequency (Fig. 1). In addition, mean size, median and mode were quite similar for all of these fragments (Table 3), except for the fragment containing the V3 region, whose size distribution did not appear to have a normal distribution. Instead, the sizes of this fragment exhibited a bimodal distribution; for example, 2 major peaks of 161 and 186 nucleotides were observed as containing 23% and 29% of all V3 fragments, respectively. All other different sizes grouped around either of these 2 peaks.
Table 2.
The sizes of fragments from each region of the 16 S rRNA gene, recovered from the bacterial sequences recorded in the Silva 123 database. The number of fragments within the 99% confidence range is indicated, as is the size range.
| Region | Number of fragments | Fragments into the confidence range 99% | Mean | Standard Deviation | Size (range) |
|---|---|---|---|---|---|
| V1 | 161,482 | 159,808 | 96.08 | 8.62 | 78.84 – 113.32 |
| V2 | 397,049 | 395,814 | 258.90 | 7.11 | 244.67 – 273.12 |
| V3 | 486,589 | 485,252 | 175.08 | 11.38 | 152.33 – 197.84 |
| V4 | 478,491 | 476,047 | 283.04 | 0.78 | 281.48 – 284.61 |
| V5 | 483,462 | 481,755 | 140.90 | 1.73 | 137.44 – 144.37 |
| V6 | 489,859 | 488,026 | 154.53 | 2.26 | 150.00 – 159.06 |
| V7 | 444,220 | 443,501 | 132.50 | 3.11 | 126.27 – 138.72 |
| V8 | 343,456 | 342,108 | 226.98 | 2.17 | 222.63 – 231.33 |
| V9 | 166,692 | 166,390 | 113.56 | 4.64 | 104.29 – 122.84 |
Figure 1.
Size distribution of different variable regions of the 16 S rRNA gene calculated as the distance between the 2 most frequent adjacent 12-mers. All bacterial sequences from the SILVA database (release 123) were considered.
Table 3.
Mean, median and mode for each variable region-containing fragment. A basic feature of the normal distribution is the closeness among these 3 parameters, which is evident for all regions except the V3 fragment.
| Fragment | Mean | Median | Mode | Max-Min |
|---|---|---|---|---|
| V1 | 96.1 | 95 | 93 | 3.1 |
| V2 | 258.9 | 259 | 257 | 2.0 |
| V3 | 175.1 | 181 | 186 | 10.9 |
| V4 | 283.0 | 283 | 283 | 0.0 |
| V5 | 140.9 | 141 | 142 | 1.1 |
| V6 | 154.5 | 154 | 154 | 0.5 |
| V7 | 132.5 | 133 | 134 | 1.5 |
| V8 | 227.0 | 227 | 227 | 0.0 |
| V9 | 113.6 | 114 | 114 | 0.4 |
V3 sequences
Overall, 485,252 fragments containing the V3 region were recovered from all bacterial sequences deposited in Silva database release 123. From these, and after filtering identical sequences, 179,049 sequences were non-redundant. This selection had a slight effect on size distribution, although the same pattern was present in both total (Fig. 1, V3) and NR (Fig. 2) fragments. Four main groups of 161, 181, 186 and 187 nucleotides each contained at least 10% of the NR fragments, and 26,046 (14.55%), 18,887 (10.55%), 47,307 (26.42%) and 22,088 (12.34%) NR fragments were registered for each of these groups, respectively (63.85% in total). Moreover, 95% of the NR fragments were located in 19 size groups, which were distributed in 2 non-overlapping ranges: 160–167 and 178–188 nt (Fig. 2).
Figure 2.
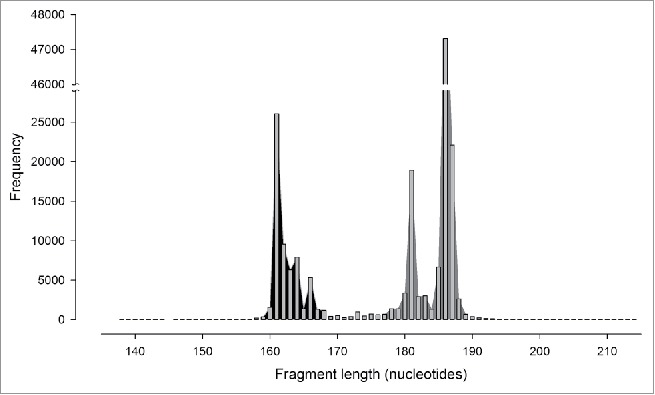
Sizes of non-redundant sequences of fragment V3. The modes are indicated as black- and gray-shaded zones.
Fragments of 161 nucleotides in length were the most frequent of the first group, whereas fragments of 186 nt were representative of the second group. Moreover, the E. coli 16S rRNA gene, used as numbering reference, fragment was 186 nt. Therefore, the consensus95 of fractions 161 and 186 were manually aligned. The results showed high degrees of similarity and conservation between consensuses95 obtained from short (161 nt) and large (186 nt) fragments of the V3 region, except for the central positions, where the sequence was highly variable and several deletions were observed (Fig. 3). Using the numbering from the E. coli 16S rRNA gene, the permutable and highly variable region was located within positions 439–478, and the sections flanking this region (95 nt from 5´ to 3´ and 51 nt 3´ to 5´) exhibited a conserved pattern (Fig. 3). The model was tested by aligning all of the NR fragments from the ends and establishing a consensus95. In both cases (from 5 ‘or from 3′), a low number of degeneracies were observed at the beginning, which subsequently increased with distance from the ends. As shown in Fig. 4, the mobile window average (MWA) for 5 and 10 elements has an inflection point after 87 and 33 nucleotides in the 5 ‘and 3′ alignments, respectively. These positions indicate the boundaries of the hypervariable region, so the fragment contains a semi-conserved region (C3), a hypervariable region in the middle zone (V3) and a semi-conserved region (C4), as shown in Fig. 5.
Figure 3.
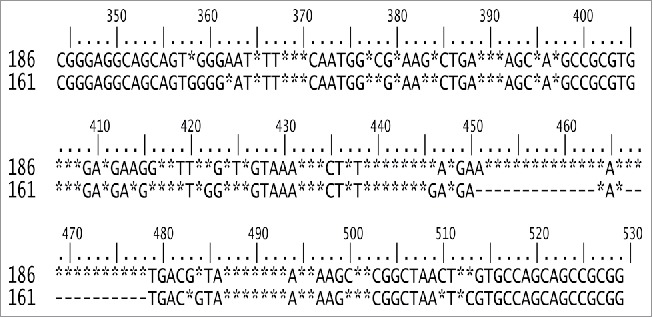
Consensuses95 obtained from non-redundant sequences belonging to the short (161 nt) and large (186 nt) size groups detected in fragment V3. Nucleotides at each position detected in ≥ 95% of sequences (consensus95) are indicated; otherwise, positions are marked with asterisks and gaps by hyphens. Position numbers correspond to E coli rRNA.
Figure 4.
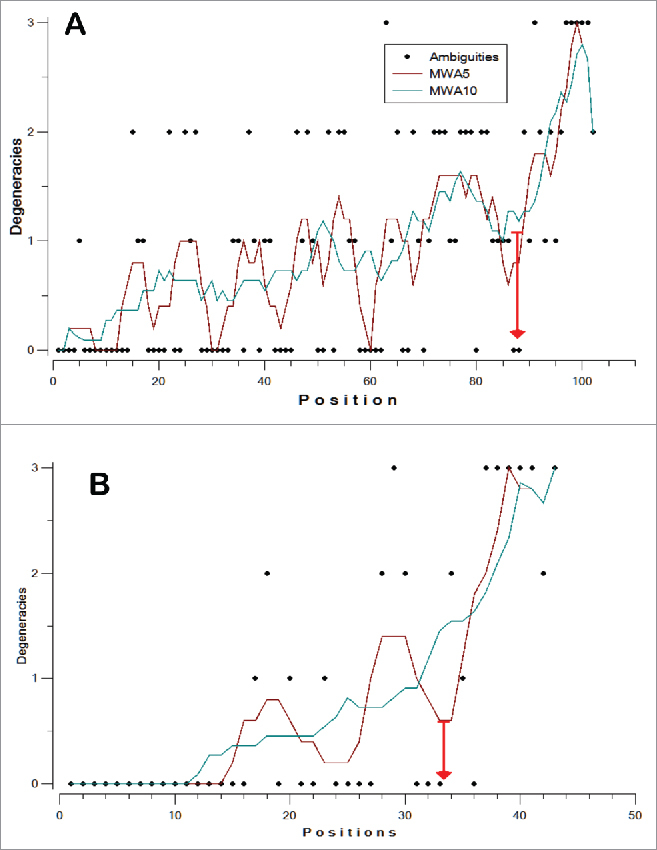
Mobile windows average for the number of degeneracies per position in the 5′ (A) and 3′ (B) ends of the region containing the V3 fragment. The inflection point is indicated by a red arrow, and the numbering is from the corresponding end.
Figure 5.
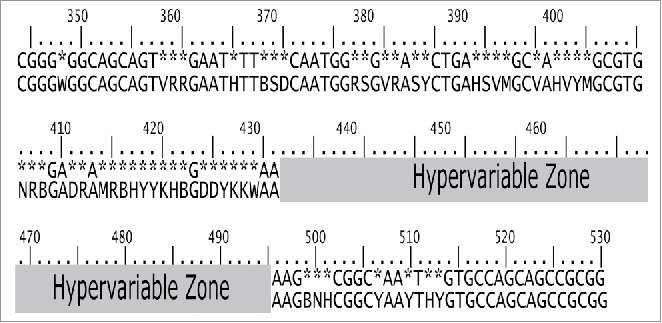
The pattern of the V3 fragment obtained by aligning all NR fragments from the 5 ‘and 3′ ends, leaving the middle part unaligned because of the occurrence of gaps and the consequent degeneracies. Bases found at a frequency of ≥ 95% are indicated; otherwise, they are replaced with an asterisk. Sequences containing degeneracies (W, V, R, H, T, B, S, D, M, Y, N) indicates the need for 2 or more bases to reach 95% consensus. Position numbers correspond to E coli 16 S rRNA.
Structurally, the 5′ end forms helix 16 (H16), and the 3′ end is part of H18. Therefore, the hypervariable regions forms H17, and its extension is directly reflected on the size of this helix (Fig. 6).
Figure 6.
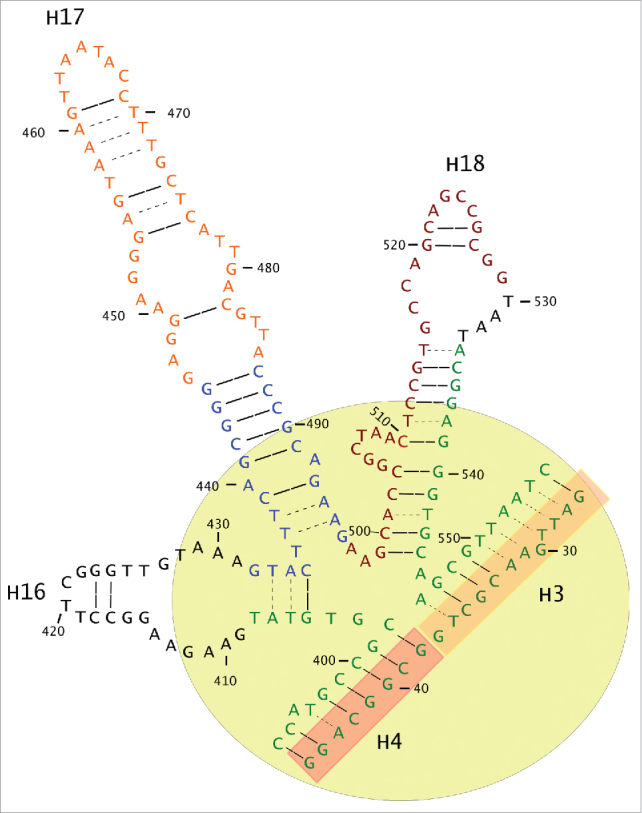
The amplified fragment forms the H16, H17 and H18 helices that, together with H3 and H4, form the 5-way junction (5 WJ), shown in a yellow circle. The 5′end forms part of H4 and the whole of H16, whereas the 3′ end is part of H18. The middle and hypervariable part forms H7, which has a basic section (in blue) and a growth part (orange) that does not seem to affect the functional structure of 5 WJ and is where modifying-size insertions are accepted.
Taxa distribution
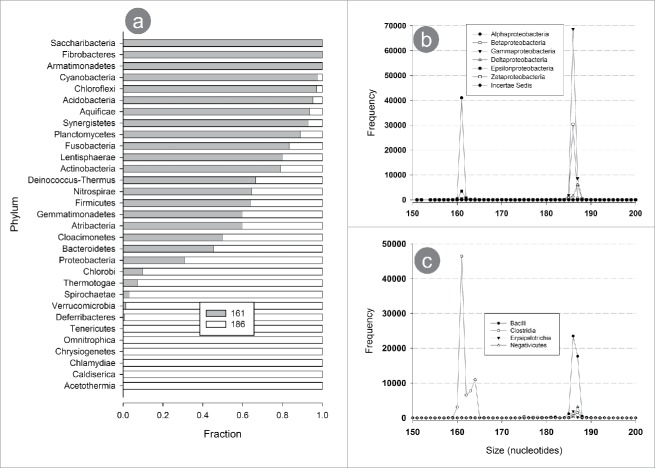
Fragments of 161 and 186 nt were found in different proportions within each phylum (Fig. 7a). Some phyla contained only one of the 2 sizes, whereas other exhibited a combination of both. For example, the sequences belonging to the phyla Saccharibacteria, Fibrobacteres and Armatimonadetes have only the 161 nt fragment, whereas a fragment size of 186 nt predominated in the phyla Tenericutes, Omnitrophica, Chlamydiae, Cladiserica and Acetothermia. However, some other phyla had different ratios of 161 and 186 nt.
Figure 7.
Size distribution of V3 fragments among bacterial taxonomic phyla. (a) Proportion of fragments measuring 161 and 186 nt in each of the bacterial phylum, in order of the relative abundance (descending) of the 161 nt fragment. The distribution of sizes for the classes of the phyla Proteobactyeria (b) and Firmicutes (c) shows that each class is associated with a particular fragment size.
Apparently, one or the other fragment was not exclusive for most phyla. In fact, when the analysis was performed one taxonomic level deeper, a strong association between size and class was observed. Considering sequence abundance, the frequency distribution for fragments of 150–200 nt was determined for each class of the phyla Proteobacteria (Fig. 7b) and Firmicutes (Fig. 7c). Proteobacteria αproteobacteria and Epsilonproteobacteria sequences had only short fragments (161 nt), whereas in βproteobacteria and Gammaproteobacteria the larger fragment sequences (186 nt) were highly predominant.
Discussion
The variable regions of the 16S rRNA have been considered an important source of genomic information for studies of phylogeny and taxonomy. According to the literature, the length of the molecule is approximately 1.5 Kbp. Slight variations have been reported and are considered, as in many other genes, to be an inherent part of evolutionary processes. Moreover, the 16S rRNA gene is a very structurally conserved molecule; therefore, the variations in sequence and size must be meticulously integrated. Using a simple strategy based on k-mer analysis, the sizes and distribution of fragments were determined as the distance between the most frequent 12-mers of 2 adjacent constant regions, and the size distribution for the different fragments was calculated (Fig. 1). Almost all fragments registered low size dispersion; for example, more than 90% of the fragments from the V4 region measured 283 ± 1 nt, whereas the V1 region ranged from 80 to 110 nt. These size variations were clustered around a central group containing the highest frequency of sequences of the same size, following the expected pattern that would arise from single nucleotide insertion or deletion. However, the fragment containing the V3 region did not show a normal distribution. Instead, at least 2 modes with defined and separated size ranges were observed. These 2 size groups were separated by a 25-nucleotide gap and contained most of the V3 sequences. Interestingly, the ends of the sequences from both groups aligned, and the gaps were located in the middle.
The fragment containing the V3 region was located between nucleotide positions 344 to 529 of the E. coli 16S rRNA, forming the H16, H17 and H18 helixes on the 16S 5′ domain. These, together with the H3 and H4, form a multihelix conjunction corresponding to the 5′ domain, also known as the 5-way junction (5 WJ), which is indispensable for 30 S ribosome assembly.18,20,21 The folded 5 WJ is stabilized,18 and the assembly of ribosome 30 S is stimulated only after binding the ribosomal protein S4.22,23 In addition, S4 binding promotes the formation of a crucial pseudoknot structure containing a translation initiation region. 24-27 Thus, because structural characteristics of the V3 region are critical for ribosome assembly, variations in sequence and size can only occur in very specific sites of the molecule to preserve functionality. In addition, this region (418–554) functions as an additional site for the Shine Delgarno sequence, which is important for the binding to translation initiation sequences.28 In this regard, the drastic variation in sequence size of the V3 region occurred in a central position of loop H17, without affecting the base of the loop, and therefore had no apparent effect on the 5 WJ of the 5´ domain. Previous studies have revealed that similar mutations in these kinds of stranded loops have no effect on molecule functionality.18 Variations in the length of H17 were observed among species of the same genus of Clostridium, Pirellula and Mycoplasma (structures in http://www.rna.icmb.utexas.edu/DAT/3A/Summary/index.php). Other studies have also revealed that although rRNA primary sequences exhibit considerable variation, a universal core secondary structure is maintained by compensatory base changes.8,29,30 Segment insertions usually occur at expansion sites and can still be superimposed on the conserved secondary structure of rRNA, whereas the core of the secondary structure remains highly conserved.31
The variations in the V3 region, which do not seem to affect the secondary structure of the 16S rRNA, demonstrate the existence of 2 rRNA families that can be differentiated by the size of their V3 regions. Considering that the representative sizes of each size family differ by 25 nucleotides (161 and 186 nt), the question is whether this difference in H17 is due to an insertion or a deletion. H17, together with H16 and H18, are considered parts of regions characterized as Expansion Segments, where functional insertions have been registered.32,33 Further study on rRNA structure may help better explain this event.
Regarding taxonomic associations with the different size groups of the V3 regions, although certain phyla contained only one fragment size, the absence of a sufficient number of sequences prevents us from asserting that variations in the size of the V3 region are associated with taxonomic groups, at least at the phylum level. However, relevant information was revealed when class level was considered: size distribution for classes belonging to the phyla Proteobacteria and Firmicutes exhibited marked preferences for one fragment size or the other. Detection of these patterns was possible due to the availability in Silva database of more than 70,000 Firmicutes sequences and more than 140,000 Proteobacteria sequences.
The differentiated distribution could be associated with the complexity levels reported in evolutionary schemes of prokaryotes, and elaborated by analysis of 16S rRNA and protein comparison.34,35 The β and Gamma classes constitute the clades of major complexity representing that evolutionary line. 36-38 Therefore, it could be assumed that the larger fragment is associated with organisms that are more complex or those thriving in complex environmental conditions. Something similar occurs in the phylum Firmicutes, where most of the V3 fragments of the Clostridia class registered 161 nt and some others had slightly larger-sized (162–165) fragments, whereas for the Bacilli class, the predominant size was 186 nt and, less frequently, 187 nt. In this particular case, a relationship between the small-sized fragment and the low complexity level of Clostridia was observed, whereas members of Bacilli and Erysipelotrichia, which are the most complex groups within the phylum Firmicutes, contained the larger fragment. 39-41
Finally, these results allow us to conclude that this is not an event associated with a few isolated cases but is apparently related to a major proportion of the bacterial world, considering that a marked difference in size was detected in non-redundant sequences. In addition, important information regarding the association of different V3 sizes and taxonomic groups at the class level were detected. This could be useful to understand evolutionary patterns of bacterial communities, and perhaps for taxonomic classification.
Disclosure of potential conflicts of interest
No potential conflicts of interest were disclosed.
Funding
This research was supported by the National Council for Science and Technology (CONACyT), Mexico, grant 84398 (to FVA).
References
- 1.Cole JR, Wang Q, Fish JA, Chai B, McGarrell DM, Sun Y, Brown CT, Porras-Alfaro A, Kuske CR, Tiedje JM. Ribosomal database project: Data and tools for high throughput rRNA analysis. Nucleic Acids Res 2014; 42:D633-D42; PMID: 24288368; https://doi.org/ 10.1093/nar/gkt1244 [DOI] [PMC free article] [PubMed] [Google Scholar]
- 2.Kim O-S, Cho Y-J, Lee K, Yoon S-H, Kim M, Na H, Park SC, Jeon YS, Lee JH, Yi H, et al.. Introducing EzTaxon-e: A prokaryotic 16S rRNA gene sequence database with phylotypes that represent uncultured species. Int J Syst Evol Microbiol 2012; 62:716-21; PMID: 22140171; https://doi.org/ 10.1099/ijs.0.038075-0 [DOI] [PubMed] [Google Scholar]
- 3.Quast C, Pruesse E, Yilmaz P, Gerken J, Schweer T, Yarza P, Peplies J, Glöckner FO. The SILVA ribosomal RNA gene database project: Improved data processing and web-based tools. Nucleic Acids Res 2013; 41:D590-D6; PMID: 23193283; https://doi.org/ 10.1093/nar/gks1219 [DOI] [PMC free article] [PubMed] [Google Scholar]
- 4.Eren AM, Maignien L, Sul WJ, Murphy LG, Grim SL, Morrison HG, Sogin ML. Oligotyping: Differentiating between closely related microbial taxa using 16S rRNA gene data. Methods Ecol Evol 2013; 4:1111-9; PMID:24358444; https://doi.org/28265511 10.1111/2041-210X.12114 [DOI] [PMC free article] [PubMed] [Google Scholar]
- 5.Martínez-Porchas M, Villalpando-Canchola E, Ortiz Suárez LE, Vargas-Albores F. How conserved are the conserved 16S-rRNA regions?. Peer J 2017; 5:e3036; PMID: 28265511; https://doi.org/ 10.7717/peerj.3036 [DOI] [PMC free article] [PubMed] [Google Scholar]
- 6.Vinje H, Almoy T, Liland K, Snipen L. A systematic search for discriminating sites in the 16S ribosomal RNA gene. Microb Informat Exp 2014; 4:2; PMID:24467869; https://doi.org/11139520 10.1186/2042-5783-4-2 [DOI] [PMC free article] [PubMed] [Google Scholar]
- 7.Savill NJ, Hoyle DC, Higgs PG. RNA sequence evolution with secondary structure constraints: Comparison of substitution rate models using maximum-likelihood methods. Genetics 2001; 157:399-411; PMID: 11139520. [DOI] [PMC free article] [PubMed] [Google Scholar]
- 8.Smit S, Widmann J, Knight R. Evolutionary rates vary among rRNA structural elements. Nucleic Acids Res 2007; 35:3339-54; PMID: 17468501; https://doi.org/ 10.1093/nar/gkm101 [DOI] [PMC free article] [PubMed] [Google Scholar]
- 9.Smith AD, Lui TWH, Tillier ERM. Empirical models for substitution in ribosomal RNA. Mol Biol Evol 2004; 21:419-27; PMID: 14660689; https://doi.org/ 10.1093/molbev/msh029 [DOI] [PubMed] [Google Scholar]
- 10.Gillespie JJ. Characterizing regions of ambiguous alignment caused by the expansion and contraction of hairpin-stem loops in ribosomal RNA molecules. Mol Phylogenet Evol 2004; 33:936-43; PMID: 15522814; https://doi.org/ 10.1016/j.ympev.2004.08.004 [DOI] [PubMed] [Google Scholar]
- 11.Pei AY, Oberdorf WE, Nossa CW, Agarwal A, Chokshi P, Gerz EA, Jin Z, Lee P, Yang L, Poles M, et al.. Diversity of 16S rRNA genes within individual prokaryotic genomes. Appl Environ Microbiol 2010; 76:3886-97; PMID: 20418441; https://doi.org/ 10.1128/AEM.02953-09 [DOI] [PMC free article] [PubMed] [Google Scholar]
- 12.Byrgazov K, Vesper O, Moll I. Ribosome heterogeneity: Another level of complexity in bacterial translation regulation. Curr Opin Microbiol 2013; 16:133-9; PMID: 23415603; https://doi.org/ 10.1016/j.mib.2013.01.009 [DOI] [PMC free article] [PubMed] [Google Scholar]
- 13.Filipovska A, Rackham O. Specialization from synthesis: How ribosome diversity can customize protein function. FEBS Lett 2013; 587:1189-97; PMID: 23485824; https://doi.org/ 10.1016/j.febslet.2013.02.032 [DOI] [PubMed] [Google Scholar]
- 14.Schluenzen F, Tocilj A, Zarivach R, Harms J, Gluehmann M, Janell D, Bashan A, Bartels H, Agmon I, Franceschi F, et al.. Structure of functionally activated small ribosomal subunit at 3.3 Å resolution. Cell 2000; 102:615-23; PMID: 11007480; https://doi.org/ 10.1016/S0092-8674(00)00084-2 [DOI] [PubMed] [Google Scholar]
- 15.Sweeney BA, Roy P, Leontis NB. An introduction to recurrent nucleotide interactions in RNA. Wiley Interdiscip Rev RNA 2015; 6:17-45; PMID: 25664365; https://doi.org/ 10.1002/wrna.1258 [DOI] [PubMed] [Google Scholar]
- 16.Abeysirigunawardena SC, Woodson SA. Differential effects of ribosomal proteins and Mg2+ ions on a conformational switch during 30 S ribosome 5′-domain assembly. RNA 2015; 21:1859-65; PMID: 26354770; https://doi.org/ 10.1261/rna.051292.115 [DOI] [PMC free article] [PubMed] [Google Scholar]
- 17.Adilakshmi T, Bellur DL, Woodson SA. Concurrent nucleation of 16S folding and induced fit in 30 S ribosome assembly. Nature 2008; 455:1268-72; PMID: 18784650; https://doi.org/ 10.1038/nature07298 [DOI] [PMC free article] [PubMed] [Google Scholar]
- 18.Bellur DL, Woodson SA. A minimized rRNA-binding site for ribosomal protein S4 and its implications for 30 S assembly. Nucleic Acids Res 2009; 37:1886-96; PMID: 19190093; https://doi.org/ 10.1093/nar/gkp036 [DOI] [PMC free article] [PubMed] [Google Scholar]
- 19.Gamalinda M, Woolford JL. Paradigms of ribosome synthesis: Lessons learned from ribosomal proteins. Translation 2015; 3:e975018; PMID: 26779413; https://doi.org/ 10.4161/21690731.2014.975018 [DOI] [PMC free article] [PubMed] [Google Scholar]
- 20.Kim H, Abeysirigunawarden SC, Chen K, Mayerle M, Ragunathan K, Luthey-Schulten Z, Ha T, Woodson SA. Protein-guided RNA dynamics during early ribosome assembly. Nature 2014; 506:334-8; PMID: 24522531; https://doi.org/ 10.1038/nature13039 [DOI] [PMC free article] [PubMed] [Google Scholar]
- 21.Parlea LG, Sweeney BA, Hosseini-Asanjan M, Zirbel CL, Leontis NB. The RNA 3 D Motif Atlas: Computational methods for extraction, organization and evaluation of RNA motifs. Methods 2016; 103:99-119; PMID: 27125735; https://doi.org/ 10.1016/j.ymeth.2016.04.025 [DOI] [PMC free article] [PubMed] [Google Scholar]
- 22.Nowotny V, Nierhaus KH. Assembly of the 30 S subunit from Escherichia coli ribosomes occurs via two assembly domains which are initiated by S4 and S7. Biochemistry 1988; 27:7051-5; PMID: 2461734; https://doi.org/ 10.1021/bi00418a057 [DOI] [PubMed] [Google Scholar]
- 23.Talkington MW, Siuzdak G, Williamson JR. An assembly landscape for the 30 S ribosomal subunit. Nature 2005; 438:628-32; PMID: 16319883; https://doi.org/ 10.1038/nature04261 [DOI] [PMC free article] [PubMed] [Google Scholar]
- 24.Babitzke P, Baker CS, Romeo T. Regulation of translation initiation by RNA binding proteins. Annu Rev Microbiol 2009; 63:27-44; PMID: 19385727; https://doi.org/ 10.1146/annurev.micro.091208.073514 [DOI] [PMC free article] [PubMed] [Google Scholar]
- 25.Mayerle M, Bellur DL, Woodson SA. Slow formation of stable complexes during coincubation of minimal rRNA and ribosomal protein S4. J Mol Biol 2011; 412:453-65; PMID: 21821049; https://doi.org/ 10.1016/j.jmb.2011.07.048 [DOI] [PMC free article] [PubMed] [Google Scholar]
- 26.Powers T, Noller HF. A functional pseudoknot in 16S ribosomal RNA. EMBO J 1991; 10:2203-14; PMID: 1712293. [DOI] [PMC free article] [PubMed] [Google Scholar]
- 27.Powers T, Noller HF. A temperature-dependent conformational rearrangement in the ribosomal protein S4.16 S rRNA complex. J Biol Chem 1995; 270:1238-42; PMID: 7836385; https://doi.org/ 10.1074/jbc.270.3.1238 [DOI] [PubMed] [Google Scholar]
- 28.Golshani A, Krogan NJ, Xu J, Pacal M, Yang X-C, Ivanov I, Providenti MA, Ganoza MC, Ivanov IG, AbouHaidar MG. Escherichia coli mRNAs with strong Shine/Dalgarno sequences also contain 5′ end sequences complementary to domain # 17 on the 16S ribosomal RNA. Biochem Biophys Res Commun 2004; 316:978-83; PMID: 15044080; https://doi.org/ 10.1016/j.bbrc.2004.02.169 [DOI] [PubMed] [Google Scholar]
- 29.Clark CG, Tague BW, Ware VC, Gerbi SA. Xenopus laevis 28 S ribosomal RNA: A secondary structure model and its evolutionary and functional implications. Nucleic Acids Res 1984; 12:6197-220; PMID: 6147812; https://doi.org/ 10.1093/nar/12.15.6197 [DOI] [PMC free article] [PubMed] [Google Scholar]
- 30.Gutell RR, Larsen N, Woese CR. Lessons from an evolving rRNA: 16S and 23 S rRNA structures from a comparative perspective. Microbiol Rev 1994; 58:10-26; PMID: 8177168. [DOI] [PMC free article] [PubMed] [Google Scholar]
- 31.Yokoyama T, Suzuki T. Ribosomal RNAs are tolerant toward genetic insertions: evolutionary origin of the expansion segments. Nucleic Acids Res 2008; 36:3539-51; PMID: 18456707; https://doi.org/ 10.1093/nar/gkn224 [DOI] [PMC free article] [PubMed] [Google Scholar]
- 32.Gerbi SA. Expansion segments: Regions of variable size that interrupt the universal core secondary structure of ribosomal RNA In: Zimmermann RA, Dahlberg AE, eds. Ribosomal RNA: Structure, Evolution, Processing and Function in Protein Synthesis. Forida, USA: CRC Press, 1996:71-87. [Google Scholar]
- 33.Ramesh M, Woolford JL. Eukaryote-specific rRNA expansion segments function in ribosome biogenesis. RNA 2016; 22:1153-62; PMID: 27317789; https://doi.org/ 10.1261/rna.056705.116 [DOI] [PMC free article] [PubMed] [Google Scholar]
- 34.Beiko RG, Harlow TJ, Ragan MA. Highways of gene sharing in prokaryotes. Proc Natl Acad Sci USA 2005; 102:14332-7; PMID: 16176988; https://doi.org/ 10.1073/pnas.0504068102 [DOI] [PMC free article] [PubMed] [Google Scholar]
- 35.Gupta RS, Sneath PH. Application of the character compatibility approach to generalized molecular sequence data: Branching order of the proteobacterial subdivisions. J Mol Evol 2007; 64:90-100; PMID: 17160641; https://doi.org/ 10.1007/s00239-006-0082-2 [DOI] [PubMed] [Google Scholar]
- 36.Hug LA, Baker BJ, Anantharaman K, Brown CT, Probst AJ, Castelle CJ, Butterfield CN, Hernsdorf AW, Amano Y, Ise K, et al.. A new view of the tree of life. Nat Microbiol 2016; 1:16048; PMID: 27572647; https://doi.org/ 10.1038/nmicrobiol.2016.48 [DOI] [PubMed] [Google Scholar]
- 37.Raymann K, Brochier-Armanet C, Gribaldo S. The two-domain tree of life is linked to a new root for the Archaea. Proc Natl Acad Sci USA 2015; 112:6670-5; PMID: 25964353; https://doi.org/ 10.1073/pnas.1420858112 [DOI] [PMC free article] [PubMed] [Google Scholar]
- 38.Wu D, Hugenholtz P, Mavromatis K, Pukall R, Dalin E, Ivanova NN, Kunin V, Goodwin L, Wu M, Tindall BJ, et al.. A phylogeny-driven genomic encyclopaedia of Bacteria and Archaea. Nature 2009; 462:1056-60; PMID: 20033048; https://doi.org/ 10.1038/nature08656 [DOI] [PMC free article] [PubMed] [Google Scholar]
- 39.Kysela DT, Randich AM, Caccamo PD, Brun YV. Diversity takes shape: Understanding the mechanistic and adaptive basis of bacterial morphology. PLoS Biol 2016; 14:e1002565; PMID: 27695035; https://doi.org/ 10.1371/journal.pbio.1002565 [DOI] [PMC free article] [PubMed] [Google Scholar]
- 40.Wolf M, Müller T, Dandekar T, Pollack JD. Phylogeny of Firmicutes with special reference to Mycoplasma (Mollicutes) as inferred from phosphoglycerate kinase amino acid sequence data. Int J Syst Evol Microbiol 2004; 54:871-5; PMID: 15143038; https://doi.org/ 10.1099/ijs.0.02868-0 [DOI] [PubMed] [Google Scholar]
- 41.Zhang W, Lu Z. Phylogenomic evaluation of members above the species level within the phylum Firmicutes based on conserved proteins. Environ Microbiol Rep 2015; 7:273-81; PMID: 25403554; https://doi.org/ 10.1111/1758-2229.12241 [DOI] [PubMed] [Google Scholar]


