

Abstract
Macrophages are a source of both proinflammatory and restorative functions in damaged tissue through complex dynamic phenotypic changes. Here, we sought to determine whether monocyte-derived macrophages (MDMs) contribute to recovery after acute sterile brain injury. By profiling the transcriptional dynamics of MDMs in the murine brain after experimental intracerebral hemorrhage (ICH), we found robust phenotypic changes in the infiltrating MDMs over time and demonstrated that MDMs are essential for optimal hematoma clearance and neurological recovery. Next, we identified the mechanism by which the engulfment of erythrocytes with exposed phosphatidylserine directly modulated the phenotype of both murine and human MDMs. In mice, loss of receptor tyrosine kinases AXL and MERTK reduced efferocytosis of eryptotic erythrocytes and hematoma clearance, worsened neurological recovery, exacerbated iron deposition, and decreased alternative activation of macrophages after ICH. Patients with higher circulating soluble AXL had poor 1-year outcomes after ICH onset, suggesting that therapeutically augmenting efferocytosis may improve functional outcomes by both reducing tissue injury and promoting the development of reparative macrophage responses. Thus, our results identify the efferocytosis of eryptotic erythrocytes through AXL/MERTK as a critical mechanism modulating macrophage phenotype and contributing to recovery from ICH.
Keywords: Inflammation, Neuroscience
Keywords: Innate immunity, Macrophages, Stroke
Introduction
Acute tissue injury induces rapid inflammatory responses largely mediated by innate immune cells. Monocyte-derived macrophages (MDMs) can acquire a broad spectrum of functions depending on signals they receive from the local microenvironment (1, 2) and are capable of either contributing to tissue injury or repair (3). Indeed, studies have identified a dynamic equilibrium of MDM activation over time after acute injury, shifting from a proinflammatory response to a tissue reparative program that dampens inflammation and improves recovery (4, 5). However, the mechanisms that promote macrophage reparative responses in disease settings, especially in the brain, remain poorly understood.
Intracerebral hemorrhage (ICH) is a devastating form of cerebrovascular disease, with the highest mortality among all stroke subtypes and without an effective therapy (6). ICH is initiated by blood vessel rupture within brain parenchyma, resulting in mechanical and metabolic insults from the hematoma mass and blood components, respectively. These primary insults induce secondary inflammatory responses in the perihematomal region characterized by inflammatory cytokine production and leukocyte recruitment, which exacerbate brain damage (7–9). We have shown that inhibition of early inflammatory responses from MDMs ameliorates acute disability in murine ICH models (10, 11), but the contribution of these cells to immune resolution and functional recovery has not been studied. Intriguingly, we have also noted that MDMs gradually increase expression of CD36 (11), a scavenger receptor associated with alternatively activated phenotype and phagocytosis after ICH (12), suggesting that MDMs may aid in ICH recovery. Signals that control tissue reparative responses after ICH, including the role of MDMs in clearance of the hematoma or functional recovery after ICH have not been explored to date. In the past, preclinical ICH studies have largely focused on the phagocytic role of microglia, the resident phagocytes of the CNS, or grouped microglia and MDMs together in hematoma resolution and brain injury (12–16). Recent data have highlighted important differences between tissue-resident phagocytes and MDMs in various disease states (5). We sought to specifically focus on exploring the contribution of MDMs in hematoma clearance and brain recovery, and the mechanism that modulates tissue reparative responses of MDMs in the ICH brain.
Phagocytosis of apoptotic cells, known as efferocytosis, is one of the primary functions of macrophages, and emerging evidence indicates that this process can direct activation of antiinflammatory transcriptional programs in MDMs after acute injury (17). In this context, phagocytosis is carefully regulated by a suite of scavenger receptors that recognize “eat me” signals expressed by apoptotic cells, including externalization of phosphatidylserine (PtdSer) (18, 19). The tyrosine kinases AXL and MERTK are PtdSer receptors activated by the binding of PtdSer-expressing cells via the adaptor proteins GAS6 and protein S (20). Upon activation, AXL/MERTK not only facilitate the action of efferocytosis but also trigger antiinflammatory responses in macrophages by inhibiting Toll-like receptor (TLR) signaling and increasing the expression of suppressor of cytokine 1 (SOCS1) and SOCS3 (21, 22). Under inflammatory conditions, AXL and MERTK can be cleaved from the cell membrane, decreasing availability of the cell surface receptors for activation (23, 24). These soluble forms of the receptors can be detected in the blood and tissue, and may compete with membrane-form receptors for the binding of protein S and GAS6. Disruption of AXL/MERTK ligand binding or AXL/MERTK deficiency inhibits clearance of apoptotic cells (25, 26) and enhances production of inflammatory cytokines (27), leading to disease pathogenesis (28, 29).
Blood products introduced from hematoma such as heme and free iron can exacerbate neuronal death in the ICH brain (30). Accelerating hematoma resolution before erythrocyte lysis and subsequently reducing free iron deposition protects against brain injury and neurologic deficits in mouse models of ICH (12, 31, 32). Apoptotic cells have been observed in the perihematomal region after ICH (33, 34). Erythrocytes, which do not contain nuclei and mitochondria, can externalize PtdSer by a process termed eryptosis (35, 36). The dual needs to clear large numbers of erythrocytes after brain hemorrhage and the role of efferocytosis in the resolution of inflammation raised the hypothesis that these processes could be fundamentally linked to recovery after ICH. However, whether eryptosis and efferocytosis occur in the brain after ICH and modulate MDMs toward a reparative phenotype is unknown.
Here, we examined the contribution of MDMs to hematoma resolution and neurological recovery after ICH. Using transcriptional profiling, we showed that the temporal gene expression of MDMs changes markedly over the course of inflammation and recovery after ICH. These data highlighted decreasing inflammatory cytokine expression and high Axl and Mertk expression in MDMs during the recovery phase of ICH. We found that erythrocytes largely express PtdSer in the brain after ICH and that efferocytosis of eryptotic erythrocytes by AXL/MERTK inhibits production of inflammatory factors while promoting reparative properties of MDMs. Finally, we determined that patients with elevated levels of soluble AXL in the plasma during the first few days after ICH onset had poorer long-term outcomes even after adjusting for ICH severity. Taken together, these results reveal a critical role for MDMs in hematoma resolution and functional recovery after ICH via AXL/MERTK–mediated efferocytosis of eryptotic erythrocytes. This establishes MDMs as essential mediators of reparative responses after ICH, and identifies erythrocyte phagocytosis as a potentially novel mechanism for acquisition of antiinflammatory properties by macrophages in acute sterile injury.
Results
MDMs are essential for optimal hematoma resolution and functional recovery after ICH.
Clinical evidence has revealed that hematoma volume is one of the major determinants of ICH patient outcomes (37) and iron toxicity from the hematoma exacerbates brain injury (38). Thus, acceleration of hematoma clearance is a logical therapeutic strategy for ICH. In order to evaluate the role of MDMs in ICH clearance, we created bone marrow–chimeric mice with either Ccr2–/– or WT hematopoietic cells and subjected them to experimental ICH by blood injection. Ccr2–/– monocytes have impaired ability to egress from the bone marrow, and Ccr2–/– bone marrow chimeras have minimal MDM recruitment to the brain after ICH (11). Chimeric mice with Ccr2–/– hematopoietic cells had larger residual hematomas than the WT chimeras at day 7 (Figure 1A), a time point when the majority of the blood has been cleared in the autologous blood injection model (Supplemental Figure 1; supplemental material available online with this article; https://doi.org/10.1172/JCI95612DS1). By 15 days, both genotypes had equal residual hemoglobin (Figure 1A), indicating that in the absence of MDMs other cell types are capable of ICH clearance, although clearance is markedly delayed. Interestingly, even at this time point when the ICH has been cleared in both genotypes, the functional outcomes of the Ccr2–/– chimeras were worse than the WT chimeras (Figure 1B), suggesting that MDMs contribute to functional recovery.
Figure 1. MDMs contribute to hematoma clearance and functional recovery after ICH.

(A) Left: Representative brain coronal sections show hematoma from WT and Ccr2–/– bone marrow chimeras (BMCs) at days 7 and 15 after ICH. Right: Quantification of residual hematoma volume in the WT and Ccr2–/– BMCs. n = 11 at day 7; n = 9 at day 15. *P < 0.05 by Student’s t test. (B) Cylinder test and apomorphine turning test from WT and Ccr2–/– BMCs at day 15 after ICH. n = 6/group for cylinder test; n = 8/group for apomorphine turning test. *P < 0.05 by Student’s t test. (C) Cylinder test, neurological deficit score, and corner test in control- and anti-CCR2 antibody–treated mice at days 1 and 3 after collagenase ICH. n = 7/group. *P < 0.05 by 1-way repeated-measures ANOVA and Bonferroni’s post hoc test. (D) Top: Representative coronal sections show hematoma from control- and anti-CCR2 antibody–treated WT mice after blood injection ICH at 7 days. Bottom: Quantification of hematoma volume, n = 3/ group. *P < 0.05 versus control by Student’s t test. (E) Top: Representative coronal sections show hematoma in the isotype control– and anti-CCR2 antibody–treated mice from collagenase model at day 12. Bottom: Quantification of hematoma volume. n = 8/group. *P < 0.05 versus control by Student’s t test. (F) The cylinder test, neurological deficit score, and corner test in isotype control– and anti-CCR2 antibody–treated ICH mice at days 3, 5, 7, 9, and 11 after collagenase ICH surgery. n = 8/group. *P < 0.05 versus isotype control group by 1-way repeated-measures ANOVA and Bonferroni’s post hoc test. αCCR2, anti-CCR2 antibody.
Although our previous study showed that MDM infiltration begins as early as 12 hours after ICH and exacerbates acute ICH disability, we also found that MDMs gradually upregulated CD36 expression by 7 days after ICH (11). These data suggest a separate, reparative role for macrophages in the subacute period after ICH. In order to evaluate the functional diversity between early infiltrating MDMs and subacute MDMs, we used an anti-CCR2 antibody (MC-21) to deplete circulating CCR2+ cells immediately after ICH or beginning 2 or 3 days after ICH (schematics shown in Supplemental Figure 2). Consistent with our previous findings of early deleterious functions of recruited MDMs in the autologous blood model (11), acute MDM depletion immediately after collagenase injection improved functional outcomes in mice at days 1 and 3 after ICH (Figure 1C). However, in both the blood injection model and the collagenase model, the residual hematoma volume was increased in the mice depleted of monocytes compared with controls (Figure 1, D and E). We then took advantage of the larger ICH and more severe and persistent functional deficits in the collagenase model to dissociate the varying impact of MDMs on functional recovery over time. MDM depletion beginning at day 3 led to better performance on cylinder and corner tests at day 5 after ICH, indicating that the MDMs contribute to acute disability for the initial 5 days in this model. However, mice with intact MDMs recovered over the next week after ICH, while recovery was more limited in the mice lacking MDMs (Figure 1F). These results demonstrate that MDMs contribute to impaired neurobehavioral function at the early stage of ICH, but provide beneficial roles in the brain later through both blood clearance and functional recovery. We next sought to identify the mechanisms by which MDMs contribute to ICH recovery and determine whether hematoma clearance directly contributes to recovery.
MDMs dramatically shift gene expression from the acute to subacute period after ICH.
In order to better understand the changes in MDM gene expression after ICH, we performed a temporal transcriptional analysis of 780 genes from MDMs sorted from mouse brains over the course of 10 days after ICH by autologous blood injection (Supplemental Figure 3A, clusters enlarged in Supplemental Figure 3, B–F). Principal components analysis (PCA) was performed and data projected along the first 2 components (Figure 2A and Supplemental Figure 4). This analysis revealed that replicate samples cluster close together and allowed us to identify genes that account for variability in MDM phenotype over the time course. Hierarchical clustering of the most variable genes across samples revealed distinct patterns of MDM transcriptional activation across time (Figure 2B). We found robust initial activation of proinflammatory genes at day 1, which then decreased at days 7 and 10. These include cytokines, chemokines, and their receptors, including Ifnar2, Mif, Il1a, Il1b, Tnf, Il6st, Ccl2, Ccl3, Ccl4, Ccl9, and Ccr5. Consistent with the IL-1 activation, Nlrp3 was also upregulated. Another gene set was transiently upregulated at day 3 and then rapidly downregulated. These genes included interferon-related genes, such as Isg20, Isg15, Ifit2, Ifit3, Irf7, Rsad2, Bst2, and Stat1, as well as other inflammatory genes, including Sell, Rel, Cxcl10, Ccrl2, Ddx58 (RIG-I), and Fcgr1. Interestingly, in the same cluster, we found increased expression of genes involved in protective responses, such as antiinflammatory responses (Il1rn, Tnfaip3, Oasl1, Hmox1 [heme oxygenase-1], and Klf4) (39), efferocytosis (Havcr2 and Tim3), autophagy (Lamp2) (40), and the lectins Lgals3 (galectin-3) and Clec7a (dectin-1).
Figure 2. Temporal transcriptional analysis of MDMs identifies Axl and Mertk as potential mediators of the resolution phase after ICH.

(A) The scatter plots show each sample projected on the first 2 principal components and are color coded according to time point after ICH. Biological replicates cluster closely at each time point. (B) Heatmap of the Z score of genes identified by PCA for each sample. Data were clustered hierarchically in GENE-E using one minus the Pearson correlation and complete linkage. Data are colored according to row minimum and maximum. (C) Top: Volcano plot showing differentially expressed genes in MDMs from brain on day 1 compared with day 3 after ICH. Axl is indicated in purple. Bottom: Volcano plot showing differentially expressed genes in MDMs from brain on day 1 compared with day 7 after ICH. Axl has the highest fold increase in MDMs on day 7. (D) Top: Representative histograms show AXL and MERTK expression on MDMs in FMO (gray) and post-ICH day 1 (red), 3 (blue), and 7 (green) samples. Bottom, quantification of percentage of AXL and MERTK expression on MDMs. n = 6/ group. *P < 0.05 versus FMO, day 1, or day 3 group by 1-way repeated-measures ANOVA and Bonferroni’s post hoc test. Data are the mean ± SD. FMO, fluorescence-minus-one control; MFI, mean fluorescence intensity.
We then focused on the cluster of genes that were increased in expression from day 3 to day 10 after ICH (outlined in Figure 2B). Some of these genes were involved in leukocyte activation (Cd84, Slamf5, Slamf7, and Cd319) and antigen presentation (H2d1, H2aa, and H2ab1). The remaining genes suggest a major role of phagocytosis and the lipid processing requirements resulting from the engulfment of cell membranes. These specific genes function in efferocytosis and in the inhibition of cytokine responses (Axl), phagolysosome formation (Lamp1 and Cd63) and lipid efflux (Abcg1) (41, 42). Clustering very closely were genes involved in cholesterol transport and efferocytosis (Apoe), immunoproteasome formation (Psmb9 and Pbmb8), and efferocytosis and the resolution of inflammation (Anxa1) (43–45). Taken together, these results show that this set of genes may be responsible for maintaining a reparative phenotype of MDMs.
We next sought to identify significantly differentially expressed genes that may drive MDM phenotype. To this end, we compared the magnitude of gene expression between day 1 (when macrophages are likely to contribute most to brain injury based on our previous work; see ref. 11) and day 3 (when macrophages are likely transitioning to a beneficial phenotype in this model) and, similarly, between day 1 and day 7 (when macrophages are likely fully reparative). We found many differentially expressed genes (Figure 2C) across both comparisons. Interestingly, we found that Axl was significantly upregulated both at day 3 and day 7 compared with day 1, and was the most upregulated gene between days 1 and 7. This suggests, together with the PCA results, that Axl is a critical gene in the changing phenotype of MDMs in the ICH brain. Overall, our transcriptional results suggested a role for efferocytosis in the modulation of the macrophage phenotype in brain after ICH and a potential link between clearance of the hematoma and the resolution of macrophage inflammatory responses.
We then confirmed the transcriptional findings at the protein level and determined the kinetics of expression by MDMs using flow cytometry. MDMs increased cell surface expression of AXL at days 3 and 7 after ICH (Figure 2D). Interestingly, the tyrosine kinase family member MERTK was highly expressed on the MDMs at all time points after ICH. While AXL and MERTK are highly expressed on MDMs, the other family member of the TAM (TYRO3-AXL-MERTK) receptor tyrosine kinases, TYRO3, is predominantly expressed on neurons rather than myeloid cells in the brain after ICH (Supplemental Figure 5). Thus, we hypothesized that the dual expression of AXL and MERTK with similar functions in efferocytosis suggests they might both have important roles in recovery after ICH.
Engulfment of eryptotic erythrocytes decreases macrophage proinflammatory phenotype.
Given the gene expression data highlighting a role for efferocytosis during recovery and the high AXL and MERTK expression on macrophages, we next sought to determine whether efferocytosis of the cells comprising the ICH and/or recruited to the perihematomal area could modulate macrophage phenotype. We first asked whether cells in the perihematomal area externalized PtdSer, and if so, which cell types did so. We found that the frequency of PtdSer exposure in the CD45–TER119+ erythrocyte population was much higher than the CD45+TER119– leukocyte population. The number of PtdSer-positive (eryptotic) erythrocytes was approximately 30-fold greater than that in the leukocytes at day 3 after ICH (Figure 3A).
Figure 3. Engulfment of eryptotic erythrocytes induces macrophage reparative phenotype.

(A) Left: Representative flow cytometry plots of TER119 and CD45 expression from brains at days 1 and 3 after ICH. Population TER119+CD45– and TER119–CD45+ quadrants representing eryptotic erythrocytes and apoptotic leukocytes, respectively, and their percentages are shown. Right: Quantification of absolute number of PtdSer-positive RBCs and WBCs in the brains at days 1 and 3 after ICH. n = 3/group. *P < 0.05 versus day 1 group by Student’s t test. (B) Representative flow cytometry shows LIVE/DEAD–annexin V+ population from non–heat-shocked erythrocytes (0 minutes) and 56°C heat-shocked (HS) erythrocytes (5 minutes), and their percentages are shown. n = 3/group. (C) Top: Representative immunofluorescence images show engulfment of PHK-26–labeled HS erythrocytes (red) in normal and thrombin-stimulated CD11b-positive (green) BMDMs with or without annexin V incubation, with higher magnification of the boxed area in the inset. Bottom: Quantification of n = 3/group; each independent experiment includes 2 technical replicates. *P < 0.05 versus control+HS group; #P < 0.05 versus thrombin+HS group by Student’s t test. (D) Gene expression for markers of proinflammatory (Tnf and Cd86) and reparative (Hmox1 and Clec7a) phenotypes from BMDMs with or without HS treatment under normal or thrombin-stimulated conditions. n = 3/group. *P < 0.05 versus thrombin group by 1-way ANOVA and Bonferroni’s post hoc test. (E) Representative phase contrast images showing control and thrombin-stimulated BMDMs treated with HS and beads, with inset of higher magnification of the boxed area showing engulfment. n = 3/group. (F) Gene expression of Tnf and Cd86 in thrombin-stimulated BMDMs is reduced after HS but not bead treatment. n = 3/group. *P < 0.05 versus control group; #P < 0.05 versus thrombin group by Student’s t test. An.V, annexin V; B, beads; C, control; T, thrombin.
We next asked whether engulfment of erythrocytes was dependent on PtdSer. We used in vitro stimuli that would replicate the initial macrophage inflammatory response to the complex milieu after ICH in vivo. This was achieved using a thrombin preparation that contained small amounts of LPS, as high-purity thrombin did not recapitulate the macrophage phenotype observed in vivo (Supplemental Figure 6, A and B). This finding is consistent with previous work demonstrating that both thrombin and TLR4 activation are critical initiators of the inflammatory response after ICH (30, 46–51). After stimulation, bone marrow–derived macrophages (BMDMs) were incubated with fluorescently labeled heat-shocked erythrocytes that externalized PtdSer (Figure 3B). Both thrombin-stimulated and unstimulated BMDMs engulfed erythrocytes; however, thrombin-stimulated BMDMs demonstrated less erythrophagocytosis than control BMDMs (Figure 3C). Importantly, the addition of annexin V as a competitive inhibitor of PtdSer-receptor interactions inhibited erythrophagocytosis, showing that the erythrophagocytosis is largely dependent on PtdSer (Figure 3C).
Next we asked whether engulfment of eryptotic erythrocytes induced changes in the phenotype of the stimulated macrophages. Erythrophagocytosis decreased proinflammatory markers Tnf and Cd86 and increased reparative markers heme oxygenase-1 (Hmox1) and dectin-1 (Clec7a) (Figure 3D). These effects were similar to the transcriptional changes in macrophages observed in vivo between days 1 and 3, when the hematoma is beginning to be cleared. To further determine whether erythrophagocytosis was specifically needed for the change in macrophage responses or if nonspecific phagocytosis would induce the same changes, stimulated BMDMs were incubated with eryptotic erythrocytes or carboxylate beads for 24 hours (Figure 3E). The gene expression of Tnf and Cd86 did not decrease in the BMDMs that engulfed beads (Figure 3F), demonstrating that signaling specific to erythrophagocytosis is necessary to reduce macrophage inflammatory gene expression.
Axl and Mertk deficiency reduces erythrophagocytosis and alternative activation in macrophages.
Once we determined that macrophage erythrophagocytosis directly modulated macrophage phenotype and was dependent on PtdSer, we next sought to determine whether AXL and MERTK were PtdSer receptors involved in this process. WT and Axl–/– Mertk–/– (AM DKO) BMDMs were stimulated and then exposed to eryptotic erythrocytes. AM DKO BMDMs engulfed significantly fewer erythrocytes than WT BMDMs in both the stimulated and control conditions (Figure 4, A and B), indicating a critical role for these receptors in erythrophagocytosis. In addition, AM DKO BMDMs had reduced Hmox1 expression after erythrocyte incubation (Figure 4C).
Figure 4. Axl/Mertk deficiency reduces erythrophagocytosis and macrophage reparative phenotype.

(A) Representative immunofluorescence images show engulfment of heat-shocked (HS) PHK-26–labeled erythrocytes (red) in CD11b-positive (green) WT and Axl–/– Mertk–/– double-knockout (AM DKO) BMDMs with or without thrombin stimulation. (B) Bar graph shows reduced erythrophagocytosis in AM DKO BMDMs compared with WT with or without thrombin stimulation. n = 3/group; each independent experiment includes 2 technical replicates. *P < 0.05 versus WT control; #P < 0.05 WT thrombin-stimulated by Student’s t test. (C) Hmox1 expression from WT and AM DKO BMDMs after 6-hour HS, thrombin, or thrombin+HS stimulation. n= 4/group. *P < 0.05 versus control; #P < 0.05 versus thrombin; †P < 0.05 versus WT by Student’s t test. (D) Hmox1 expression from WT and AM DKO BMDMs after 6-hour cobalt protoporphyrin (Copp) or sulforaphane (SFN) treatment with or without thrombin stimulation. n = 4 /group. *P < 0.05 versus control; #P < 0.05 versus thrombin by Student’s t test. Throughout, data are the mean ± SD. B, beads; C, control; T, thrombin.
Hmox1 expression is regulated by the transcription factor Nrf2 (52). We therefore examined whether Axl and Mertk deficiency impaired activation of Nrf2 signaling by BMDMs. The pharmacological direct Nrf2 activators cobalt protoporphyrin (CoPP) and sulforaphane (SFN) were able to induce Hmox1 upregulation equally in WT and AM DKO BMDMs (Figure 4D), confirming that the failure to upregulate Hmox1 was not due to disruption of the Nrf2/heme oxygenase-1 axis in AM DKO BMDMs. Rather, reduced erythrophagocytosis likely mediates the lower Hmox1 expression in the AM DKO BMDMs. Taken together, these results indicate that AXL and MERTK are critical for the efferocytosis of eryptotic erythrocytes and subsequent modulation of macrophage phenotype.
Axl/Mertk deficiency exacerbates ICH outcomes and reduces macrophage reparative phenotype.
To determine if AXL and MERTK-mediated erythrophagocytosis was important in vivo, ICH was induced in WT and AM DKO mice. We utilized MRI to quantify hemorrhage volumes in the brains at day 7 after ICH. Consistent with our findings of reduced erythrophagocytosis in the AM DKO BMDMs in vitro, the AM DKO mice had larger residual cerebral hematomas after ICH induction (Figure 5A). We then confirmed this finding histologically by Perls’ staining to detect ferrous iron deposition at this subacute stage after ICH. Compared with the WT mice, iron-positive cells were increased in the hemorrhagic tissue of AM DKO mice (Figure 5B). Meanwhile, AM DKO mice had more severe functional deficits than the WT animals at day 7 after ICH (Figure 5C).
Figure 5. Axl/Mertk deficiency impedes ICH brain recovery and reduces macrophage reparative phenotype.

(A) Left: Representative T2-weighted MR images and R2 maps delineating hematoma in the WT and Axl–/– Mertk–/– double-knockout (AM DKO) brains on day 7 after ICH show increased hemorrhage volume in the AM DKO mice. The hemorrhage in gray matter is shown in red and in white matter is shown in yellow. Total hematoma volume quantified in right panel, n =10/group. *P < 0.05 versus WT group by Student’s t test. (B) Representative Perls’ staining image shows iron deposition from WT and AM DKO coronal brain sections at day 7 after ICH. Dotted lines mark the needle track. (C) Cylinder test results from WT and AM DKO mice at days 1, 3, and 7 after ICH. n = 11 for WT and n = 10 for AM DKO. *P < 0.05 versus WT group by 1-way repeated-measures ANOVA and Bonferroni’s post hoc test. (D) Left: Representative histogram shows PKH-26–labeled RBC signal in monocyte-derived macrophages (MDMs) from control and WT and AM DKO ICH chimeras at day 3 after ICH. Right: Quantification of percentage of PKH-26–labeled RBC expression in MDMs. n = 3/group. *P < 0.05 versus WT chimeras by Student’s t test. (E) Left: Representative histograms show heme oxygenase-1 (HO-1), CD36, and TNF expression in the MDMs from brains of WT and AM DKO chimeras on day 7 after ICH, with quantifications in the right panels. n = 14 for WT chimeras and n = 15 for AM DKO chimeras. *P < 0.05 versus WT chimeras by Student’s t test. (F) Cylinder test in WT and AM DKO chimeras at days 1, 3, and 7 after ICH. n = 14 for WT chimeras and n = 15 for AM DKO chimeras. *P < 0.05 versus WT chimeras group by 1-way repeated-measures ANOVA and Bonferroni’s post hoc test. NS, no significant difference.
AXL and MERTK are expressed on both hematopoietic cells as well as multiple cell types in the CNS (53). We created bone marrow–chimeric mice in which WT (CD45.1) hosts were irradiated and the hematopoietic system reconstituted with either AM DKO or WT (CD45.2) bone marrow. We then modeled ICH by autologous blood injection in which the erythrocytes had been prelabeled with a fluorescent dye prior to injection. Mice were sacrificed at day 3 after ICH to quantify erythrophagocytosis by macrophages in vivo by flow cytometry. In line with our in vitro BMDM and in vivo MRI findings of diminished erythrophagocytosis in the absence of AXL and MERTK, AM DKO MDMs had reduced erythrophagocytosis in the perihematomal brain (Figure 5D). At day 7 after ICH induction, MDMs isolated from the perihematomal tissue of AM DKO bone marrow chimeras had decreased levels of heme oxygenase-1 and CD36 expression. There was no difference in TNF levels in the MDMs (Figure 5E), indicating that other pathways maintain TNF production in vivo. The basal level of CD36 expression did not differ between WT and AM DKO BMDMs (Supplemental Figure 7), suggesting that the failure to upregulate CD36 expression was downstream from reduced erythrophagocytosis in the AM DKO MDMs. The functional performance of AM DKO bone marrow chimeras was worse than the WT chimeras at days 3 and 7 after ICH induction (Figure 5F). Together the results indicate that AXL and MERTK on MDMs contribute to erythrocyte clearance from the brain, induce a tissue-specific macrophage reparative phenotype, and subsequent functional recovery after ICH.
Macrophage phenotypic modulation by eryptotic erythrophagocytosis is conserved in human macrophages.
To assess the translational relevance of our findings in patients, we first investigated whether human macrophages also phagocytose erythrocytes via PtdSer engagement. Similar to our murine results, the addition of annexin V decreased the engulfment of erythrocytes (Figure 6A). We then determined whether erythrophagocytosis modulated the phenotype of human macrophages after stimulation. Interestingly, the kinetics of the TNF response was much faster in the human macrophages, with robust TNF expression by 3 hours after stimulation and resolution by 14 hours, while the kinetics of the heme oxygenase-1 response was similar to the murine macrophages (Figure 6B). Similar to the murine cells, the engulfment of heat-shocked erythrocytes by stimulated macrophages reduced TNF gene expression and increased HMOX1 expression (Figure 6B). Furthermore, the modulation of macrophage phenotype was dependent on the PtdSer expression of the erythrocytes, as the addition of control erythrocytes that did not express PtdSer did not induce HMOX1 expression or the changes in macrophage inflammatory state (Figure 6C). To further determine whether engulfment of other apoptotic cells induces a reparative macrophage phenotype that benefits hematoma clearance and brain recovery after ICH, thrombin-stimulated macrophages were incubated with apoptotic neutrophils or T cells for 6 hours. Indeed, in agreement with previous findings (20, 54), the addition of apoptotic neutrophils or T cells decreased TNF expression in macrophages; however, HMOX1 expression was not increased by the engulfment of apoptotic leukocytes (Supplemental Figure 8, A and B). Thus, the tissue-specific reparative phenotype of macrophages after ICH is dependent on the efferocytosis of eryptotic erythrocytes.
Figure 6. Efferocytosis modulates human MDM phenotype and is associated with ICH recovery in patients.

(A) Left: Representative immunofluorescence images show engulfment of PHK-26–labeled control erythrocytes (R) and heat-shocked erythrocytes (HS) (red) in thrombin-stimulated CD11b-positive (green) MDMs with or without annexin V incubation. Right: Quantification of erythrophagocytosis. n = 3/group; each independent experiment includes 3 technical replicates. *P < 0.05 versus thrombin+R; #P < 0.05 versus thrombin+HS by 1-way ANOVA and Bonferroni’s post hoc test. (B) Gene expression of TNF and HMOX1 in human macrophages after thrombin, HS, and thrombin+HS stimulation for 3, 6, and 14 hours. n = 3/group. *P < 0.05 versus HS group by 1-way ANOVA and Bonferroni’s post hoc test. (C) TNF and HMOX1 gene expression in human macrophages after thrombin, thrombin+R, and thrombin+HS treatment for 3 hours (TNF) and 6 hours (HMOX1). n = 3/ group. *P < 0.05 versus thrombin group by Student’s t test. (D) Representative immunofluorescence images show MERTK (red), IBA1 (green), and AXL (pink) signals in the day 0 and day 3 ICH patient brain sections, with enlarged and merged image of the boxed area shown for colocalization. An.V, annexin V; C, control; T, thrombin.
Patients with ICH recruit AXL+MERTK+ leukocytes to the brain and recovery is associated with efferocytosis.
Next we sought to determine whether this process aids in the resolution of the inflammatory response in patients with ICH. Pathological specimens were obtained from 2 patients who died from ICH at different times from onset (Supplemental Figure 9). In the patient who died immediately after onset and thus had limited time for peripheral monocyte recruitment, we found that IBA1-positive cells largely expressed MERTK but not AXL. This is consistent with previous studies that have shown that MERTK is highly expressed in tissue-resident macrophages including microglia (55). In contrast, in the perihematomal tissue of the patient who died 3 days after ICH, we found increased AXL- and MERTK-positive signals that were colocalized with IBA1-positive cells. This observation suggests that AXL and MERTK double-positive macrophages are recruited to the perihematomal brain by day 3 after ICH in patients (Figure 6D).
In inflammatory tissues, AXL and MERTK can be cleaved from the plasma membrane. Higher extracellular levels of soluble receptors could result in reduced responsiveness of the MDMs to AXL and MERTK ligands, either by enhanced cleavage of receptor from the cell surface directly limiting the cell surface availability of the receptor or by cleaved receptor acting as a soluble decoy receptor directly competing for the ligands GAS6 and PROS. Interestingly, in the murine model, we found greater soluble AXL (sAXL) than sMERTK in the perihematomal tissues (Supplemental Figure 10, A–C) and in the thrombin-stimulated BMDM culture medium (Supplemental Figure 10, D and E). Elevated sAXL was also detected in the perihematomal tissue on day 3 (Supplemental Figure 10F) and in serum on days 3–28 (Supplemental Figure 10G) after ICH. Notably, when we induced ICH of varying severities, we found that sAXL in serum was directly correlated with functional disability after ICH at day 3 (Supplemental Figure 10H). This murine work demonstrates that AXL and MERTK are differentially cleaved after ICH and that the cleavage of AXL may impact recovery.
We next determined whether sAXL levels in patient plasma could give insight into recovery pathways activated after human ICH. In a prospective cohort study, we collected clinical data, plasma sAXL at 72 hours after ICH onset, and functional outcomes for 1 year. The characteristics of the cohort are shown in Table 1. There was no association of sAXL levels at 72 hours after ICH onset with patient age, ICH volume, warfarin use at ICH onset, or ICH score, the most commonly used prognostic score in clinical practice (56). We also found no association of sAXL at 72 hours with initial stroke severity as measured by the NIH Stroke Scale (NIHSS) score (Supplemental Figure 11), which differed from our results in the murine model, and likely reflects the multitude of patient factors that contribute to clinical severity. Strikingly, we found that elevations in plasma sAXL (and not sMERTK) were independently associated with poor functional outcome at 1 year after ICH even after adjustment for prognosis by the ICH score (Table 2 and Supplemental Table 1). Overall, the human data support the notion that efferocytosis is an important mediator of the resolution of inflammation in ICH patients.
Table 1. Characteristics of the patient cohort.
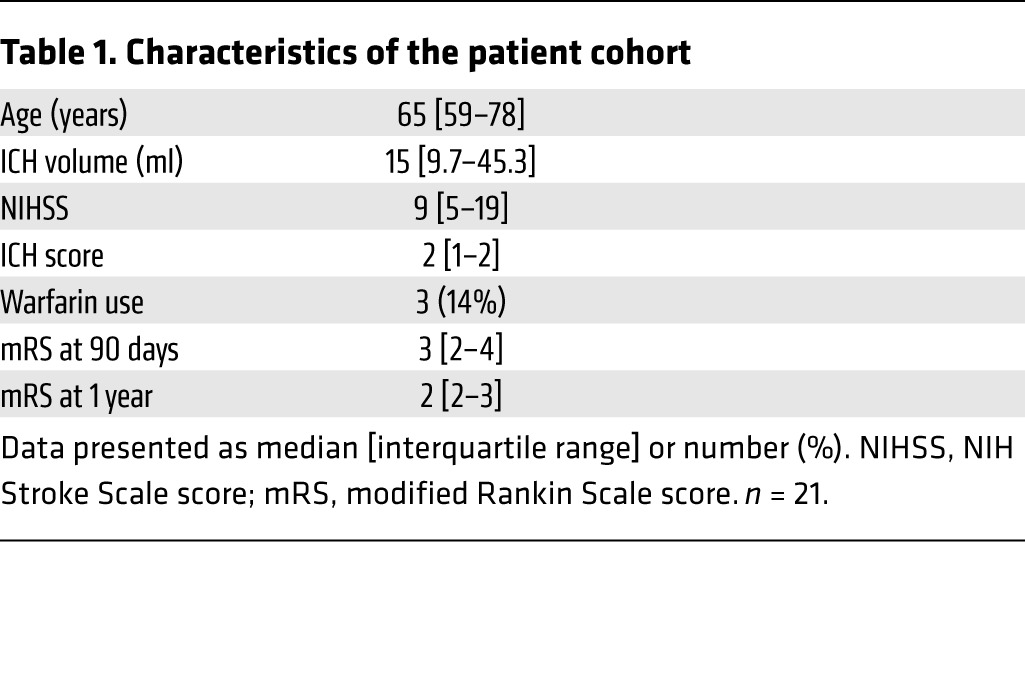
Table 2. Ordinal logistic regression of the association of circulating AXL levels and functional outcome by modified Rankin Scale score at 1 year, adjusting for ICH score.

Discussion
Our work demonstrates for the first time to our knowledge that MDMs contribute to recovery of ICH, redefining the role of these cells in disease progression. We specifically focused on the MDMs as a distinct population from microglia, the tissue-resident macrophages in the brain, and found that efficient hematoma clearance is dependent on MDMs. While we found that MDMs initially express inflammatory pathways and contribute to loss of neurological function, these cells rapidly change phenotype and upregulate molecules involved in phagocytosis. Strikingly, we found that the efferocytosis of eryptotic erythrocytes via the PtdSer receptors drives these transcriptional changes. Notably, this process downregulates proinflammatory cytokines and activates the antiinflammatory and antioxidant enzyme heme oxygenase-1, which has been shown to contribute to ICH recovery (16). Taken together, these results establish a fundamental link between hemorrhage clearance and the resolution of inflammation in the brain and provide a mechanism for remodeling of macrophage function to induce recovery after ICH.
In recent years a growing number of studies have examined the contribution of MDMs, once thought of as predominantly inflammatory cells, to wound healing and tissue repair (57–63). Examination of the particular role of these cells has been complicated by the lack of markers that clearly distinguish MDM from resident macrophage populations, particularly in inflamed tissue. Using a gating strategy that we have previously demonstrated consistently distinguishes MDMs and resident microglia after ICH (11, 64, 65), we are able to precisely follow the temporal evolution of macrophage transcriptional programs after an acute injury. Consistent with other disease models (66, 67), MDMs initially express an array of inflammatory genes upon arrival to the injured brain known to contribute to ICH pathology including Il1b, Tnf, Ccl2, and Nlrp3. Over time, MDMs downregulate these inflammatory genes and upregulate genes that are related to hemoglobin degradation, efferocytosis, and cholesterol transport such as Hmox1, Axl, CD63, ApoE, and Abcg1. This disease-specific reparative phenotype in the ICH brain supports the notion of on-site education of the macrophages in the injured tissue (68–70) and reinforces cues for developing a therapeutic strategy for ICH that enhances the macrophage contribution to brain repair.
Under physiological conditions, macrophages rapidly remove damaged and senescent erythrocytes from peripheral circulation to prevent the uncontrolled release of extracellular iron. Erythrocyte phagocytosis can be mediated by recognition of PtdSer on the erythrocyte plasma membrane by splenic macrophages (71) and Kupffer cells in liver (72). These cells catabolize and recycle iron-containing heme via heme oxygenase-1; disruption of this process causes splenic and hepatic fibrosis and death (73). We found that a similar process occurs in the brain after hemorrhage, where recognition of eryptotic erythrocytes by MDMs leads to hematoma clearance and reduces iron deposition. Our work builds on previous studies showing that acceleration of hematoma resolution prevents secondary injury in the hemorrhagic brain (12, 14, 32, 74). Recently, administration of GAS6, a ligand of AXL and MERTK, was shown to alleviate brain edema and improve behavioral performance in mice after ICH (75), but the cellular mediators of this protection were not explored. We determined that MDMs are a critical cell type in this process and reveal a mechanism by which erythrophagocytosis directly modulates MDM phenotype in both murine and human cells. Interestingly, the resultant phenotype of macrophages involves several distinct pathways, including upregulation of other scavenger receptors including CD36, which likely assist in further hematoma clearance, and upregulation of heme oxygenase-1 to degrade heme, provide antioxidant protection, and further reduce inflammatory pathway activation. The effects of a reparative macrophage phenotype are likely multifactorial, possibly impacting neuronal survival, glial scar, endothelial cell activation, and other pathways that improve functional recovery. This reparative MDM phenotype was distinct in both gene expression and temporal profile from the profiles we recently reported in microglia (65), as the microglial phenotype during recovery was dominated by TGF-β1–mediated pathways. As bleeding and hematoma formation are common phenomena in head trauma and hemorrhagic transformation of ischemic stroke, clearance of erythrocytes by MDMs may represent a conserved mechanism to prevent iron-mediated oxidative tissue damage and promote the resolution of inflammation in a wide range of acute brain injuries. The contribution of MDMs to hematoma resolution and the effect on disease progression requires further investigation in other models.
AXL and MERTK function are critical to immune homeostasis (20) and have been shown to promote immunoregulatory functions in infection (76), atherosclerosis (28), cancer (77), and autoimmune disease (78). Notably, these receptors have been implicated in controlling inflammatory responses in the CNS, including in multiple sclerosis (79) and Parkinson’s disease (55), suggesting that they may direct immune function in a wide range of neurological diseases. The ligands of the AXL and MERTK receptors, PROS1 and GAS6 (80), contain γ-carboxylated glutamic acid residues activated by vitamin K that allow them to bind the negatively charged phospholipid PtdSer expressed by apoptotic cells and activated platelets (81, 82). Activation of either AXL or MERTK leads to upregulation of the suppressor of cytokine signaling proteins SOCS1 and SOCS3. SOCS1 and SOCS3 inhibit the TLR, NF-κB, and JAK-STAT signaling pathways, leading to broad inhibition of inflammatory responses (20). It is not surprising that in the absence of AXL and MERTK there was still some ICH clearance, as many other phagocytic receptors are likely able to compensate. However, the reduced beneficial phenotypic changes in MDMs and worse behavioral deficits in the AM DKO mice highlight the importance of this pathway in the resolution of inflammation and neurological recovery. Further work is needed to elucidate the relative contributions of each receptor, as well as other PtdSer receptors that may contribute to efferocytosis after ICH.
Recent data have shed light on the role of receptor cleavage in downregulating the signaling pathway. Cleavage of MERTK and AXL by the metalloproteinases ADAM17 and ADAM10 leads to soluble forms of the receptors and incompetent receptor functioning at the cell surface (29, 83–85). Indeed, sAXL and sMERTK have been shown to inhibit macrophage efferocytosis (23). In multiple sclerosis lesions, increased sAXL and sMERTK was associated with reduced GAS6 levels, perhaps due to the soluble forms acting as decoy receptors and limiting ligand availability (79). A cleavage-resistant form of MERTK leads to enhanced resolution of inflammation in models of peritonitis, ischemia/reperfusion lung injury, and atherosclerosis (24). Both AXL and MERTK were highly expressed on macrophages, but only AXL transcription was rapidly upregulated between days 1 and 3 after ICH. Interestingly, we found cleavage of AXL, but not MERTK, in our experimental models and in the patient cohort, suggesting differential regulation of both gene transcription and the metalloproteinases between the two receptors. Our finding of poor neurological recovery in patients with elevated sAXL levels supports the detrimental role of soluble forms of the receptors in patients and underscores the therapeutic potential of enhancing efferocytosis-mediated signaling in macrophages.
Despite decades of effort, there remain no approved therapies for ICH. Modulating the immune response in hemorrhagic stroke has recently been suggested as a therapeutic strategy (86), but detailed understanding of the cellular and molecular players is needed before therapies can be effectively translated to the bedside. Our findings here suggest that while inhibiting leukocyte recruitment may limit initial neuronal damage after ICH, recruited MDMs play an important role in functional recovery. Therefore, manipulation of the immune response to promote reparative pathways may represent an optimal long-term approach for management of acute brain injury. Here, we show that efferocytosis of eryptotic erythrocytes not only limits iron deposition in the brain but also modulates macrophage function. Thus, therapeutically augmenting efferocytosis may serve to improve functional outcomes by both reducing tissue injury and promoting the development of reparative macrophage responses. Our findings shed new light on the immune mechanisms that have an impact on brain injury and have translationally relevant implications for enhancing patient recovery.
Methods
Mice
Male C57BL/6J (WT), B6.SJL-Ptprca Pepcb/BoyJ (WT CD45.1), and B6.129S4-Ccr2tm1Ifc/J (Ccr2–/–) mice were obtained from The Jackson Laboratory. AM DKO mice have been described previously (87). Ccr2−/− and AM DKO mice have been backcrossed for more than 9 generations to a C57BL/6J background. All mice were bred under specific-pathogen-free (SPF) conditions with a 12-hour light/dark cycle in a temperature-controlled environment and ad libitum access to water and food pellets. All experimental protocols were conducted in accordance with the NIH guidelines and were approved by the Yale Institutional Animal Care and Use Committee. Mice were randomly allocated to experimental groups by coin flip and investigators were blinded to group allocation and/or genotype until after data analysis. Group size calculation in ICH experiments is based on our experience with the variability in these models, accounting for a resulting effect size ƒ (by analysis of variance [ANOVA]) of 0.6 with α less than 0.05 and a power of 0.80.
ICH
Blood injection model.
After anesthetizing mice with 1%–3% isoflurane inhalation and ventilating with oxygen-enriched air (20%:80%), we injected a total of 25 μl autologous blood at the following coordinates relative to bregma: 2.5 mm lateral, and 3.0 mm deep at a 5° angle, as described previously (11, 65, 88). The craniotomy was sealed with bone wax, and the scalp was closed with tissue adhesive (3M Vetbond). Rectal temperature was maintained at 37.0 ± 0.5°C throughout the experimental and recovery periods (DC Temperature Controller 40-90-8D; FHC Inc.). All preclinical ICH surgeries were done by blood injection except when specifically noted otherwise.
Collagenase model.
We used the collagenase model of ICH for confirmatory experiments, as the injection of the bacterial enzyme results in the degradation of the vascular basement membrane, ongoing bleeding into the brain for at least several hours, and a more severe and persistent neurobehavioral deficit (89). Briefly, mice received the same initial and concluding procedures as during the blood injection model surgery; however, ICH was induced by injecting 0.5 μl of 0.75 U type VII collagenase (from Clostridium histolyticum, Sigma-Aldrich) at 0.1 μl/min into the right striatum, as described previously (11, 65).
Bone marrow chimeras
Eight-week-old WT CD45.1 mice were lethally irradiated with 600 cGy twice followed by retro-orbital injection of 106 donor bone marrow cells from WT, Ccr2−/−, or AM DKO mice (congenically marked CD45.2). Chimeras were maintained on sulfamethoxazole/trimethoprim antibiotics in their food pellets beginning 1 day before and continuing for 2 weeks following irradiation, and were used for ICH surgery 8 weeks after engraftment (11, 65).
Fresh ICH brain tissue sampling and hematoma volume measurement
Mice were euthanized by isoflurane overdose at various time points after ICH and transcardially perfused with ice-cold phosphate-buffered saline (PBS). Fresh 1-mm coronal slices across the whole brain were prepared based on our standard procedure (90). For the histological assessment of hematoma volume, images of the brain slices were digitalized by a scanner (600 dpi) and analyzed with ImageJ software (NIH). Hematoma volume in cubic millimeters was calculated as the summation of the hematoma areas multiplied by the interslice distance (1 mm). Alternatively, hemoglobin content in the hemorrhagic brains quantified hematoma volume (91, 92). Briefly, 4-mm coronal brain slices across the hemorrhagic territory were collected (90) and homogenized in 300 μl of distilled water. To generate a standard curve, whole blood was obtained by cardiac puncture of anaesthetized intact mice. Incremental volumes of this blood (0, 0.5, 1.0, 2.0, 4.0, and 8.0 μl) were then added to 300 μl lysate from a normal brain sample. After centrifugation at 12,000 g for 30 minutes, the supernatant was harvested, and 80 μl Drabkin’s reagent (Sigma-Aldrich) was added to a 20-μl aliquot of supernatant and allowed to incubate for 15 minutes at room temperature. The absolute optical density value of the solution was measured at a wavelength of 540 nm to assess the concentration of cyanomethemoglobin.
Behavioral tests
An experimenter blinded to genotype and treatment evaluated mice for neurological deficits and functional recovery by cylinder test, apomorphine turning test, neurologic deficit scoring system, and corner turn test at various days after ICH as previously described (11, 65, 92).
Cylinder test.
Mice were placed in a transparent glass cylinder and allowed to freely rear and place forelimb paws on the wall of the cylinder. The first forelimb placed (left, right, or both) was scored for a total of 20 rears. The laterality index was calculated as (right – left)/(right + left + both), in which a greater positive number indicates a more severe left hemiparesis, while a score of 0.0 indicates equal use of the forelimbs.
Apomorphine turning test.
Apomorphine, a dopamine agonist, was used to examine asymmetry of turning behavior. Apomorphine (58 μg/mouse; Sigma-Aldrich) was injected 5 minutes prior to a 20-minute testing session where mice were observed in a beaker for rotational activity. The number of right turns was recorded to quantify unilateral deficits in striatal function.
Neurologic deficit scoring system.
For general neurologic severity assessment, mice were evaluated for body symmetry, gait, climbing, circling behavior, front limb symmetry, and compulsory circling. Each test was graded from 0 to 4, establishing a maximum deficit score of 24.
Corner turn test.
The mice were allowed to proceed into a 30° corner and could freely turn either left or right to exit the corner. The choice of direction during 10 trials was recorded and the percentage of right turns was calculated.
In vivo peripheral monocyte depletion
Mice were randomly assigned to intraperitoneally receive 20 μg of rat anti–mouse CCR2 antibody MC-21 (provided by Matthias Mack) or rat IgG2b isotype control antibody dissolved in 100 μl PBS. Three depletion regimens (days 0–3, days 2–7, and days 3–12) are described in Supplemental Figure 2. This protocol ensures near-complete monocyte depletion based on previous studies in our lab and others (11, 93, 94).
Cell sorting and transcriptome profiling
ICH brain–sorted MDMs (CD45hiCD11b+CD3e–Ly6G–Ly6C+ cells) were simultaneously isolated from the same mouse cohort for which we previously reported the function of microglia (CD45intCD11b+ cells) after ICH (65). Briefly, mice were euthanized by isoflurane at days 1, 3, 7, and 10 after ICH surgery. After transcardial perfusion with 100 ml ice-cold PBS, 4-mm fresh coronal perihematomal tissue sections from 3 animals were pooled, and mechanically and enzymatically digested by DNaseI, collagenase, and dispase. The digested cell suspension was underlaid with a 30%/70% Percoll (GE Healthcare) gradient and then centrifuged at 500 g for 20 minutes to obtain the leukocyte-enriched fraction. The leukocytes were washed and stained with antibodies for cell surface markers (CD45 [30-F11], Ly6C [HK1.4], CD11b [M1/70], Ly6G [1A8], and CD3e [500A2]) (all BD Biosciences) for 20 minutes on ice. MDMs (CD45hiCD11b+CD3e–Ly6G–Ly6C+ cells) were sorted on a FACSAria directly into 4 μl RLT buffer (QIAGEN). RNA samples (10 μl) were directly hybridized with a pool of 780 custom capture probes and gene expression analyzed by nCounter Digital Analyzer (NanoString Technologies) according to the manufacturer’s instructions. The gene expression was normalized to positive controls and housekeeping genes and calculated as relative counts (65). Each replicate is composed of pooled MDMs from 3 ICH brains, with 3 biological replicates per time point.
Transcriptome analysis
Nanostring data were preprocessed according to the manufacturer’s instructions and then further analyzed using custom MATLAB scripts as previously described (65). Briefly, nCounter data were normalized to housekeeping genes and genes with expression below the threshold of detection at all time points were eliminated. Data were imported to MATLAB, Z score normalized, and filtered to remove genes that did not change significantly over time. Remaining genes were hierarchically clustered and PCA identified genes driving change over time, as previously described (65). Genes in the 90th percentile based on the magnitude of coefficients in the first and second components were used for downstream analysis. Heatmaps were created using MATLAB and Morpheus, a matrix-visualization software. Enrichment analysis was performed using the Cytoscape (v3.3.0) plugin GeneMania (3.4.0).
Flow cytometric analysis
To measure CD36, heme oxygenase-1, and TNF expression in/on MDMs in the perihematomal regions, mice were sacrificed at 7 days after autologous blood injection model surgery and samples were prepared as described above. Cells were stained for surface markers CD45 (30-F11), CD11b (M1/70), Ly6C (HK1.4), CD3e (145-2C11), CD19 (1D3), Ly6G (1A8), CD36 (CRF D-2712), and with viability dye (LIVE/DEAD Fixable Dead Cell Stain Kit; Invitrogen) for 20 minutes on ice and then fixed (BD CytoFix/CytoPerm; BD Biosciences) for 20 minutes at 4°C prior to being permeabilized. TNF (MP6-XT22) and heme oxygenase-1 (HO-1-2) antibodies (all sources of antibodies are listed in the supplemental material) were used to perform intracellular staining for 30 minutes at 4°C. To quantify PtdSer externalization, mice were euthanized at day 1 and 3 after surgery. Samples were prepared as described above. Cells were stained with CD45 (30-F11), TER119 (TER-119), annexin V, and viability dye. Apoptotic cells were defined as annexin V+LIVE/DEAD–. Control samples were taken from naive brain matching the 4-mm coronal tissue sections at the perihematomal region. In all experiments gates were set based on fluorescence-minus-one (FMO) controls.
Murine BMDMs
BMDMs were generated from WT and AM DKO mice as described previously (95). Briefly, bone marrow was isolated from femurs and tibias of 6- to 8-week-old male mice. To deplete adherent stromal cells, the harvested bone marrow was cultured at 37°C overnight in α-minimal essential medium (BioWhittaker Lonza) supplemented with 10% FBS, 100 U/ml penicillin plus 100 mg/ml streptomycin, and 2 mM L-glutamine. Nonadherent mononuclear cells were collected, RBCs were lysed, and cells were cultured for 7 days in the presence of 50 ng/ml recombinant murine M-CSF (R&D Systems) to generate BMDMs.
Human MDMs
Human peripheral blood mononuclear cells (PBMCs) were isolated from fresh, whole heparinized blood from healthy donors over a Ficoll-Paque PREMIUM (GE Healthcare) gradient using the SepMate-50 tube (STEMCELL Technologies). Monocytes were purified from PBMCs by magnetic cell separation using the EasySep Human CD14 Positive Selection Kit II (STEMCELL Technologies). Monocytes (95% CD14+ cells) were cultured at 5 × 10⁵ cells/ml for 7 days in complete RPMI 1640 supplemented with 100 ng/ml M-CSF (Tonbo Biosciences), at 37°C in a humidified atmosphere with 5% CO2. After 7 days, the monocytes had differentiated into macrophages (MDMs) and were used in further experiments.
Erythrocyte isolation, fluorescence labeling, and eryptosis induction
Whole blood (murine or human) was washed twice in PBS and then RBCs were isolated from the pellet after Ficoll gradient centrifugation in SepMate tubes (STEMCELL Technologies). We used the lipophilic fluorescent probe PKH-26 (acridine orange conjugated to a 26-carbon atom aliphatic chain) Red Fluorescent Cell Linker Kit (Sigma-Aldrich) to label erythrocytes according to the manufacturer’s instructions. Eryptosis was induced by 56°C heat shock in a water bath for 5 minutes.
In vitro erythrophagocytosis assay
BMDMs or MDMs (1 × 10⁵) were plated on round 12-mm glass coverslips on a 24-well plate for 7 days. Macrophages were incubated with 10 U/ml thrombin under serum-free conditions (α-minimal essential medium supplemented 100 U/ml penicillin plus 100 mg/ml streptomycin, 2 mM L-glutamine, and 50 ng/ml recombinant murine M-CSF) for 18 hours. The macrophages were then fed with fluorescently labeled erythrocytes (3 × 10⁶) at 37°C for 1 hour. Unengulfed erythrocytes were removed by PBS wash, the cells fixed, stained with FITC-labeled rat anti–mouse CD11b (M1/70) antibody, and mounted on a glass slide. The engulfed erythrocytes were observed by fluorescence microscopy. The phagocytosis index was calculated by the mean fluorescence intensity of engulfed erythrocytes per macrophage and expressed as percentage of control groups.
In vivo erythrophagocytosis assay
RBCs were isolated from whole blood of donor mice and labeled with fluorescent probe PKH-26 as described above. The PKH-26–labeled RBCs were then suspended in autologous plasma at 20% hematocrit (1:4 ratio of RBCs and plasma) and 25 μl RBCs plus plasma was injected in the brains of WT and AM DKO chimeras as in the blood injection ICH model. Mice were sacrificed at 3 days after injection and samples were prepared and analyzed by flow cytometry as described above. The LIVE/DEAD–CD45hiCD11b+Ly6G–Ly6C+PKH-RBC+ population was defined as MDMs that had engulfed RBCs. MDMs from naive brains matching the territory of the perihematomal region were used as control samples.
Efferocytosis of neutrophils and T cells
Human neutrophils and Jurkat T cells were used as sources of apoptotic cells. The neutrophils were prepared from human peripheral blood as previously described (96). For apoptosis induction, the neutrophils were suspended in IMDM (BioWhittaker Lonza) with 10% autologous serum and incubated for 24 hours at 37°C in 5% CO2. Cells were washed twice with HBSS without Ca2+ and Mg2+ and resuspended in IMDM without serum. The Jurkat T cells were cultured in RPMI medium containing 20% FBS, glutamine (2 mM), penicillin (100 U/ml), and streptomycin (100 mg/ml) at 37°C in 5% CO2. The culture was UV irradiated for 10 minutes to induce apoptosis as previously described (97). These protocols yielded populations containing approximately 60% apoptotic neutrophils or Jurkat T cells as determined by annexin V positivity by flow cytometry. Human MDMs (1 × 10⁵) were fed with apoptotic neutrophils or Jurkat T cells (5 × 10⁵) at 37°C for 6 hours and then the unengulfed cells were removed by 2 washes with media. Cells were then lysed by QIAzol Lysis Reagent (Qiagen) for RNA isolation.
RT-qPCR
Total RNA was isolated using the miRNeasy Micro Kit (Qiagen) according to the manufacturer’s protocol, and the first strand of cDNA was synthesized from 300 ng of RNA with the SuperScript VILO cDNA Synthesis Kit (Invitrogen). Real-time quantitative reverse-transcriptase PCR (RT-qPCR) analysis was performed with an ABI 7500 Fast Real-Time PCR system (Applied Biosystems). The primers and probes for mouse Tnf (TaqMan Gene Expression Assay ID Mm00443258_m1), Cd86 (Mm01344642_m1), Hmox1 (Mm00516005_m1), and Clec7a (Mm01183349_m1), as well as human TNF (HS01113624_g1) and HMOX1 (HS01110250_m1), were obtained from Thermo Fisher Scientific. The endogenous control was Gapdh (Mm99999915_g1) in mice and GAPDH (HS02758991_g1) in humans. The cycle time values of candidate genes were normalized to Gapdh in the same sample. The expression levels of mRNA were then presented as fold change versus the control group as previously described (91).
ELISA
Mice were euthanized at various time points after ICH surgery. Whole-cell extracts from equal weights of perihematomal brain tissue and serum from whole blood were collected and quantified by Bradford protein assay. Control and thrombin-stimulated BMDM culture medium and plasma from ICH patients were used for ELISA. AXL or MERTK was quantified from equal amounts of protein (1,000 μg in a total of 50 μl volume) and equal amounts of mouse serum, cell culture medium, or human plasma by ELISA (Mouse or Human AXL or MERTK DuoSet ELISA; R&D Systems). All samples and standards were assayed in duplicate.
Perls’ staining
Brain iron deposition was detected by 3,3′-diaminobenzidine (DAB)–enhanced Perls’ staining as previously described (92). Briefly, sections of perihematomal tissue were washed with PBS and incubated in freshly prepared Perls’ solution (5% potassium ferrocyanide/10% hydrochloric acid) for 30 minutes, followed by PBS washes. After DAB incubation for 1.5 minutes and hematoxylin counterstaining, iron accumulation was digitized by a Leica DMi8 and quantified with ImageJ software by observers blinded to genotype. Iron-positive cells were counted by sampling an area of 500 × 1,000 μm2 immediately adjacent to the hematoma in 3 randomly selected fields at ×400 magnification.
Immunofluorescence
Paraffin-embedded tissue sections (7 μm) of human brain were boiled for 40 minutes in citrate (pH 6.0) then blocked with 2% normal goat serum and rabbit serum for 1 hour at room temperature. Samples were stained with primary antibodies (see supplemental material) against anti-IBA1 (1:200), anti-MERTK (1:100), and biotinylated anti-AXL (1:100). Slides were washed and incubated with secondary antibodies labeled with Alexa 488 (1:1,000), Alexa 594 (1:1,000), and Cy5 (1:1,000) for 2 hours. After 3 washes, nuclei were stained with DAPI. The mouse brain sections were incubated overnight at 4°C with the following primary antibodies: anti-Iba1 (1:300), anti-GFAP (1:400), anti-NeuN (1:200), and anti-Dtk/Tyro3 (1:200). After being washed 3 times, the sections were incubated with Alexa 488– and Alexa 594–conjugated secondary antibodies (1:1,000) for 2 hours at 37°C. Nuclei were stained with DAPI after final washes. Sections were digitized on a Leica DMi8 using the provided Leica LAS X software by a blinded observer.
MRI
Animals were anesthetized with 3% isoflurane during induction; anesthesia was maintained at 1.5% isoflurane during MRI. The core body temperature was monitored using an optical fiber probe and maintained near 37°C with a temperature-controlled recirculated warm water bed. The transverse (R2) relaxation rate maps were obtained at 9.4 T using a Bruker horizontal-bore spectrometer with a 1H radio frequency (RF) surface coil of 12-mm diameter positioned on top of the animal head. R2 maps were obtained for 20 slices using a spin-echo pulse sequence with 128 × 64 in plane resolution, 0.5 mm slice thickness, a field of view (FOV) of 24 mm × 12 mm, and a repetition time (TR) of 6 seconds. Ten different echo time (TE) values in the range from 8 to 80 ms were used. The R2 value in each voxel was calculated using Matlab (MathWorks, Inc.) by fitting the MR intensity versus TE to a single exponential function. Measurement of hemorrhage volume was obtained from the R2 maps using BioImage Suite (http://www.bioimagesuite.org/) as follows. First, all slices in the R2 maps were resampled to 100 μm × 100 μm resolution, keeping the same slice thickness. Next, because R2 values are higher in the hemorrhage regions, a threshold value for selecting these regions was established by comparison with R2 values measured in the same regions on the contralateral side of the brain. However, because the R2 values in a normal brain are different in the gray matter (e.g., cortical and subcortical values) than in the white matter (e.g., corpus callosum), separate R2 thresholds were used for analysis of gray and white matter regions. Small variations in the overall R2 values in each animal prompted the use of a specific R2 threshold for each animal. Although these variations were relatively small (± 2 s–1), they provide a more accurate estimation of hemorrhage volume. Thus, the R2 threshold used for gray matter was between 24 and 26 s–1, while that used for white matter was between 27 and 30 s–1. Finally, the 3D hemorrhage volume was calculated by selecting the tissue volume with R2 values larger than the threshold value, for both gray and white matter regions.
Western blot analysis
Western blot analysis was performed as previously described (32). Fresh coronal perihematomal and contralateral tissue sections (4 mm) were lysed in T-PER (Thermo Fisher Scientific) containing Complete Mini Protease Inhibitor Cocktail (Roche Molecular Biochemicals). Total protein was quantified by the Bradford protein assay (Bio-Rad). Equal amounts of protein (20 μg protein per sample lane) were separated by 4%–20% sodium dodecyl sulfate-polyacrylamide gel electrophoresis (Bio-Rad) and transferred to 0.45-μm Immobilon-P membranes (Millipore). Membranes were blocked with 5% BSA in PBS-T (PBS containing 0.2% Tween-20) and probed with primary antibodies (see supplemental material) against AXL (R&D Systems), MERTK (R&D Systems), and α-tubulin (Santa Cruz Biotechnology) at 4°C overnight. After 3 washes in PBS-T, the membranes were then incubated with HRP-linked anti-goat secondary antibody (Millipore) for 1 hour. Membranes were washed again, and proteins were visualized with ECL Plus (Millipore). Images were digitized by a ChemiDoc Touch Imaging System (Bio-Rad). The relative intensity of AXL or MERTK signal was normalized to the corresponding α-tubulin (loading control) intensity. Expression was quantified as densitometric units with Image Lab 6.0 software (Bio-Rad).
Patient cohort study
Patients were identified from the inpatient census of the Neurological Intensive Care unit at Yale New Haven Hospital. Blood was collected by peripheral venipuncture into lithium heparin vacutainer tubes at 72 ± 6 hours after ICH symptom onset (or last known well) and centrifuged at 2,000 g for 10 minutes. Plasma supernatant was frozen at –80°C until analysis. Clinical data, including demographics, ICH size and location, clinical severity measures, concomitant medications, and complications were prospectively collected. Functional outcome was quantified by a modified Rankin Scale score during a structured telephone interview at 90 ± 14 days and 365 ± 30 days after ICH onset. All clinical data collection was performed by members of the clinical research team blinded to sAXL levels. Because of our interest in sAXL and functional recovery, patients who died prior to discharge from the hospital were excluded.
Statistics
Murine data and human in vitro data.
All in vivo figures present individual mouse data with a line indicating the mean of the group. Bar graphs are presented as mean ± standard deviation. Mean values were compared using Student’s t test for comparison between 2 groups, and 1-way or 2-way repeated-measures ANOVA with post-hoc Bonferroni test for multiple-group comparisons. All analyses were performed using SigmaStat 3.5 (Systat Software Inc.). A P value less than 0.05 was regarded as statistically significant.
Human cohort study data.
Univariate analyses were performed to determine associations of sAXL levels and clinical characteristics, including age, ICH volume, ICH location, NIHSS score, ICH score, and warfarin use. A multivariate ordinal logistic regression was performed to determine the independent association of sAXL levels on functional outcome at 1 year adjusted for ICH score, the most commonly used functional outcome predictive measure. The proportional odds assumption was confirmed. Statistics were performed using Stata/IC v13.1.
Study approvals
All murine procedures were approved by the Yale University Animal Care and Use Committee and were performed in strict compliance with the NIH Guide for the Care and Use of Laboratory Animals. The Human Investigations Committee (IRB) of Yale University approved the patient cohort study. Patients or their designated surrogates provided written informed consent according to the Declaration of Helsinki.
Author contributions
CFC designed, conducted, and analyzed the majority of experiments, and prepared the manuscript. BAG conducted the bioinformatics analyses and edited the manuscript. MHA, MDH, SCR, AFS, LHAC, MJL, YA, and HEB performed some experiments, analyzed data, and edited the manuscript. KNS, LHS, DMG, and AH contributed to the human cohort study and pathological analyses and edited the manuscript. DC and FH designed and analyzed MRI, and edited the manuscript. MM, SG, CVR, and JCL provided scientific insight, supervised some analyses, and edited the manuscript. LHS conceived and designed the study, supervised experiments, and prepared the manuscript.
Supplementary Material
Acknowledgments
This work was supported by NIH grants R01NS095993 (to LHS), R21NS088972 (to LHS), K08NS078110 (to LHS), P30NS052519 (to FH), R01AI089824 (to CVR), and R01CA212376 (to SG and CVR), and MOST/Taiwan grant 105-2917-I-564-082 (to CFC). CVR is a Howard Hughes Faculty Scholar. We thank the patients and families who graciously participated in the clinical study.
Version 1. 12/18/2017
Electronic publication
Version 2. 02/01/2018
Print issue publication
Funding Statement
CVR
Footnotes
Conflict of interest: The authors have declared that no conflict of interest exists.
Reference information: J Clin Invest. 2018;128(2):607–624.https://doi.org/10.1172/JCI95612.
Contributor Information
Che-Feng Chang, Email: che-feng.chang@yale.edu.
Michael H. Askenase, Email: michael.askenase@yale.edu.
Youxi Ai, Email: youxi.ai@yale.edu.
Matthias Mack, Email: matthias.mack@klinik.uni-regensburg.de.
Kevin N. Sheth, Email: kevin.sheth@yale.edu.
David M. Greer, Email: dgreer@bu.edu.
Anita Huttner, Email: anita.huttner@yale.edu.
Daniel Coman, Email: daniel.coman@yale.edu.
Fahmeed Hyder, Email: fahmeed.hyder@yale.edu.
Sourav Ghosh, Email: sourav.ghosh@yale.edu.
Carla V. Rothlin, Email: carla.rothlin@yale.edu.
J. Christopher Love, Email: clove@mit.edu.
References
- 1.Guilliams M, et al. Dendritic cells, monocytes and macrophages: a unified nomenclature based on ontogeny. Nat Rev Immunol. 2014;14(8):571–578. doi: 10.1038/nri3712. [DOI] [PMC free article] [PubMed] [Google Scholar]
- 2.Varol C, Mildner A, Jung S. Macrophages: development and tissue specialization. Annu Rev Immunol. 2015;33:643–675. doi: 10.1146/annurev-immunol-032414-112220. [DOI] [PubMed] [Google Scholar]
- 3.Mosser DM, Edwards JP. Exploring the full spectrum of macrophage activation. Nat Rev Immunol. 2008;8(12):958–969. doi: 10.1038/nri2448. [DOI] [PMC free article] [PubMed] [Google Scholar]
- 4.Murray PJ, et al. Macrophage activation and polarization: nomenclature and experimental guidelines. Immunity. 2014;41(1):14–20. doi: 10.1016/j.immuni.2014.06.008. [DOI] [PMC free article] [PubMed] [Google Scholar]
- 5.Liddiard K, Taylor PR. Understanding local macrophage phenotypes in disease: shape-shifting macrophages. Nat Med. 2015;21(2):119–120. doi: 10.1038/nm.3798. [DOI] [PubMed] [Google Scholar]
- 6.Hankey GJ. Stroke. Lancet. 2017;389(10069):641–654. doi: 10.1016/S0140-6736(16)30962-X. [DOI] [PubMed] [Google Scholar]
- 7.Zia E, Melander O, Björkbacka H, Hedblad B, Engström G. Total and differential leucocyte counts in relation to incidence of stroke subtypes and mortality: a prospective cohort study. J Intern Med. 2012;272(3):298–304. doi: 10.1111/j.1365-2796.2012.02526.x. [DOI] [PubMed] [Google Scholar]
- 8.Loftspring MC, McDole J, Lu A, Clark JF, Johnson AJ. Intracerebral hemorrhage leads to infiltration of several leukocyte populations with concomitant pathophysiological changes. J Cereb Blood Flow Metab. 2009;29(1):137–143. doi: 10.1038/jcbfm.2008.114. [DOI] [PMC free article] [PubMed] [Google Scholar]
- 9.Mracsko E, Javidi E, Na SY, Kahn A, Liesz A, Veltkamp R. Leukocyte invasion of the brain after experimental intracerebral hemorrhage in mice. Stroke. 2014;45(7):2107–2114. doi: 10.1161/STROKEAHA.114.005801. [DOI] [PubMed] [Google Scholar]
- 10.Hammond MD, Ambler WG, Ai Y, Sansing LH. α4 integrin is a regulator of leukocyte recruitment after experimental intracerebral hemorrhage. Stroke. 2014;45(8):2485–2487. doi: 10.1161/STROKEAHA.114.005551. [DOI] [PMC free article] [PubMed] [Google Scholar]
- 11.Hammond MD, et al. CCR2+ Ly6C(hi) inflammatory monocyte recruitment exacerbates acute disability following intracerebral hemorrhage. J Neurosci. 2014;34(11):3901–3909. doi: 10.1523/JNEUROSCI.4070-13.2014. [DOI] [PMC free article] [PubMed] [Google Scholar]
- 12.Zhao X, et al. Hematoma resolution as a target for intracerebral hemorrhage treatment: role for peroxisome proliferator-activated receptor gamma in microglia/macrophages. Ann Neurol. 2007;61(4):352–362. doi: 10.1002/ana.21097. [DOI] [PubMed] [Google Scholar]
- 13.King MD, McCracken DJ, Wade FM, Meiler SE, Alleyne CH, Dhandapani KM. Attenuation of hematoma size and neurological injury with curcumin following intracerebral hemorrhage in mice. J Neurosurg. 2011;115(1):116–123. doi: 10.3171/2011.2.JNS10784. [DOI] [PMC free article] [PubMed] [Google Scholar]
- 14.Zhao X, et al. Cleaning up after ICH: the role of Nrf2 in modulating microglia function and hematoma clearance. J Neurochem. 2015;133(1):144–152. doi: 10.1111/jnc.12974. [DOI] [PMC free article] [PubMed] [Google Scholar]
- 15.Fang H, et al. CD36-mediated hematoma absorption following intracerebral hemorrhage: negative regulation by TLR4 signaling. J Immunol. 2014;192(12):5984–5992. doi: 10.4049/jimmunol.1400054. [DOI] [PMC free article] [PubMed] [Google Scholar]
- 16.Zhang Z, et al. Distinct role of heme oxygenase-1 in early- and late-stage intracerebral hemorrhage in 12-month-old mice. J Cereb Blood Flow Metab. 2017;37(1):25–38. doi: 10.1177/0271678X16655814. [DOI] [PMC free article] [PubMed] [Google Scholar]
- 17.Hochreiter-Hufford A, Ravichandran KS. Clearing the dead: apoptotic cell sensing, recognition, engulfment, and digestion. Cold Spring Harb Perspect Biol. 2013;5(1):a008748. doi: 10.1101/cshperspect.a008748. [DOI] [PMC free article] [PubMed] [Google Scholar]
- 18.Li MO, Sarkisian MR, Mehal WZ, Rakic P, Flavell RA. Phosphatidylserine receptor is required for clearance of apoptotic cells. Science. 2003;302(5650):1560–1563. doi: 10.1126/science.1087621. [DOI] [PubMed] [Google Scholar]
- 19.Fadok VA, de Cathelineau A, Daleke DL, Henson PM, Bratton DL. Loss of phospholipid asymmetry and surface exposure of phosphatidylserine is required for phagocytosis of apoptotic cells by macrophages and fibroblasts. J Biol Chem. 2001;276(2):1071–1077. doi: 10.1074/jbc.M003649200. [DOI] [PubMed] [Google Scholar]
- 20.Rothlin CV, Carrera-Silva EA, Bosurgi L, Ghosh S. TAM receptor signaling in immune homeostasis. Annu Rev Immunol. 2015;33:355–391. doi: 10.1146/annurev-immunol-032414-112103. [DOI] [PMC free article] [PubMed] [Google Scholar]
- 21.Rothlin CV, Ghosh S, Zuniga EI, Oldstone MB, Lemke G. TAM receptors are pleiotropic inhibitors of the innate immune response. Cell. 2007;131(6):1124–1136. doi: 10.1016/j.cell.2007.10.034. [DOI] [PubMed] [Google Scholar]
- 22.Zagórska A, Través PG, Lew ED, Dransfield I, Lemke G. Diversification of TAM receptor tyrosine kinase function. Nat Immunol. 2014;15(10):920–928. doi: 10.1038/ni.2986. [DOI] [PMC free article] [PubMed] [Google Scholar]
- 23.Sather S, et al. A soluble form of the Mer receptor tyrosine kinase inhibits macrophage clearance of apoptotic cells and platelet aggregation. Blood. 2007;109(3):1026–1033. doi: 10.1182/blood-2006-05-021634. [DOI] [PMC free article] [PubMed] [Google Scholar]
- 24.Cai B, et al. MerTK cleavage limits proresolving mediator biosynthesis and exacerbates tissue inflammation. Proc Natl Acad Sci USA. 2016;113(23):6526–6531. doi: 10.1073/pnas.1524292113. [DOI] [PMC free article] [PubMed] [Google Scholar]
- 25.Seitz HM, Camenisch TD, Lemke G, Earp HS, Matsushima GK. Macrophages and dendritic cells use different Axl/Mertk/Tyro3 receptors in clearance of apoptotic cells. J Immunol. 2007;178(9):5635–5642. doi: 10.4049/jimmunol.178.9.5635. [DOI] [PubMed] [Google Scholar]
- 26.Scott RS, et al. Phagocytosis and clearance of apoptotic cells is mediated by MER. Nature. 2001;411(6834):207–211. doi: 10.1038/35075603. [DOI] [PubMed] [Google Scholar]
- 27.Camenisch TD, Koller BH, Earp HS, Matsushima GK. A novel receptor tyrosine kinase, Mer, inhibits TNF-alpha production and lipopolysaccharide-induced endotoxic shock. J Immunol. 1999;162(6):3498–3503. [PubMed] [Google Scholar]
- 28.Cai B, et al. MerTK receptor cleavage promotes plaque necrosis and defective resolution in atherosclerosis. J Clin Invest. 2017;127(2):564–568. doi: 10.1172/JCI90520. [DOI] [PMC free article] [PubMed] [Google Scholar]
- 29.Orme JJ, et al. Heightened cleavage of Axl receptor tyrosine kinase by ADAM metalloproteases may contribute to disease pathogenesis in SLE. Clin Immunol. 2016;169:58–68. doi: 10.1016/j.clim.2016.05.011. [DOI] [PMC free article] [PubMed] [Google Scholar]
- 30.Xi G, Keep RF, Hoff JT. Mechanisms of brain injury after intracerebral haemorrhage. Lancet Neurol. 2006;5(1):53–63. doi: 10.1016/S1474-4422(05)70283-0. [DOI] [PubMed] [Google Scholar]
- 31.Selim M. Deferoxamine mesylate: a new hope for intracerebral hemorrhage: from bench to clinical trials. Stroke. 2009;40(3 Suppl):S90–S91. doi: 10.1161/STROKEAHA.108.533125. [DOI] [PubMed] [Google Scholar]
- 32.Chang CF, Wan J, Li Q, Renfroe SC, Heller NM, Wang J. Alternative activation-skewed microglia/macrophages promote hematoma resolution in experimental intracerebral hemorrhage. Neurobiol Dis. 2017;103:54–69. doi: 10.1016/j.nbd.2017.03.016. [DOI] [PMC free article] [PubMed] [Google Scholar]
- 33.Xue M, Del Bigio MR. Intracerebral injection of autologous whole blood in rats: time course of inflammation and cell death. Neurosci Lett. 2000;283(3):230–232. doi: 10.1016/S0304-3940(00)00971-X. [DOI] [PubMed] [Google Scholar]
- 34.Gong C, Boulis N, Qian J, Turner DE, Hoff JT, Keep RF. Intracerebral hemorrhage-induced neuronal death. Neurosurgery. 2001;48(4):875–882; discussion 882. doi: 10.1097/00006123-200104000-00037. [DOI] [PubMed] [Google Scholar]
- 35.Boas FE, Forman L, Beutler E. Phosphatidylserine exposure and red cell viability in red cell aging and in hemolytic anemia. Proc Natl Acad Sci U S A. 1998;95(6):3077–3081. doi: 10.1073/pnas.95.6.3077. [DOI] [PMC free article] [PubMed] [Google Scholar]
- 36.de Back DZ, Kostova EB, van Kraaij M, van den Berg TK, van Bruggen R. Of macrophages and red blood cells; a complex love story. Front Physiol. 2014;5:9. doi: 10.3389/fphys.2014.00009. [DOI] [PMC free article] [PubMed] [Google Scholar]
- 37.Broderick JP, Brott TG, Duldner JE, Tomsick T, Huster G. Volume of intracerebral hemorrhage. A powerful and easy-to-use predictor of 30-day mortality. Stroke. 1993;24(7):987–993. doi: 10.1161/01.STR.24.7.987. [DOI] [PubMed] [Google Scholar]
- 38.Nakamura T, Keep RF, Hua Y, Nagao S, Hoff JT, Xi G. Iron-induced oxidative brain injury after experimental intracerebral hemorrhage. Acta Neurochir Suppl. 2006;96:194–198. doi: 10.1007/3-211-30714-1_42. [DOI] [PubMed] [Google Scholar]
- 39.Liao X, et al. Krüppel-like factor 4 regulates macrophage polarization. J Clin Invest. 2011;121(7):2736–2749. doi: 10.1172/JCI45444. [DOI] [PMC free article] [PubMed] [Google Scholar]
- 40.Nakayama M, et al. Tim-3 mediates phagocytosis of apoptotic cells and cross-presentation. Blood. 2009;113(16):3821–3830. doi: 10.1182/blood-2008-10-185884. [DOI] [PubMed] [Google Scholar]
- 41.Lu Q, Lemke G. Homeostatic regulation of the immune system by receptor tyrosine kinases of the Tyro 3 family. Science. 2001;293(5528):306–311. doi: 10.1126/science.1061663. [DOI] [PubMed] [Google Scholar]
- 42.Yvan-Charvet L, et al. ABCA1 and ABCG1 protect against oxidative stress-induced macrophage apoptosis during efferocytosis. Circ Res. 2010;106(12):1861–1869. doi: 10.1161/CIRCRESAHA.110.217281. [DOI] [PMC free article] [PubMed] [Google Scholar]
- 43.Lemke G, Lu Q. Macrophage regulation by Tyro 3 family receptors. Curr Opin Immunol. 2003;15(1):31–36. doi: 10.1016/S0952-7915(02)00016-X. [DOI] [PubMed] [Google Scholar]
- 44.Sharif MN, et al. Twist mediates suppression of inflammation by type I IFNs and Axl. J Exp Med. 2006;203(8):1891–1901. doi: 10.1084/jem.20051725. [DOI] [PMC free article] [PubMed] [Google Scholar]
- 45.Atagi Y, et al. Apolipoprotein E is a ligand for triggering receptor expressed on myeloid cells 2 (TREM2) J Biol Chem. 2015;290(43):26043–26050. doi: 10.1074/jbc.M115.679043. [DOI] [PMC free article] [PubMed] [Google Scholar]
- 46.Xi G, Keep RF, Hua Y, Xiang J, Hoff JT. Attenuation of thrombin-induced brain edema by cerebral thrombin preconditioning. Stroke. 1999;30(6):1247–1255. doi: 10.1161/01.STR.30.6.1247. [DOI] [PubMed] [Google Scholar]
- 47.Lei C, Wu B, Cao T, Liu M, Hao Z. Brain recovery mediated by Toll-like receptor 4 in rats after intracerebral hemorrhage. Brain Res. 2016;1632:1–8. doi: 10.1016/j.brainres.2015.11.045. [DOI] [PubMed] [Google Scholar]
- 48.Wang YC, et al. Toll-like receptor 2/4 heterodimer mediates inflammatory injury in intracerebral hemorrhage. Ann Neurol. 2014;75(6):876–889. doi: 10.1002/ana.24159. [DOI] [PubMed] [Google Scholar]
- 49.Wang YC, Wang PF, Fang H, Chen J, Xiong XY, Yang QW. Toll-like receptor 4 antagonist attenuates intracerebral hemorrhage-induced brain injury. Stroke. 2013;44(9):2545–2552. doi: 10.1161/STROKEAHA.113.001038. [DOI] [PubMed] [Google Scholar]
- 50.Sansing LH, Harris TH, Welsh FA, Kasner SE, Hunter CA, Kariko K. Toll-like receptor 4 contributes to poor outcome after intracerebral hemorrhage. Ann Neurol. 2011;70(4):646–656. doi: 10.1002/ana.22528. [DOI] [PMC free article] [PubMed] [Google Scholar]
- 51.Xiong XY, et al. Toll-like receptor 4/MyD88-mediated signaling of hepcidin expression causing brain iron accumulation, oxidative injury, and cognitive impairment after intracerebral hemorrhage. Circulation. 2016;134(14):1025–1038. doi: 10.1161/CIRCULATIONAHA.116.021881. [DOI] [PubMed] [Google Scholar]
- 52.Wu J, Hua Y, Keep RF, Nakamura T, Hoff JT, Xi G. Iron and iron-handling proteins in the brain after intracerebral hemorrhage. Stroke. 2003;34(12):2964–2969. doi: 10.1161/01.STR.0000103140.52838.45. [DOI] [PubMed] [Google Scholar]
- 53.Pierce AM, Keating AK. TAM receptor tyrosine kinases: expression, disease and oncogenesis in the central nervous system. Brain Res. 2014;1542:206–220. doi: 10.1016/j.brainres.2013.10.049. [DOI] [PMC free article] [PubMed] [Google Scholar]
- 54.Greenlee-Wacker MC. Clearance of apoptotic neutrophils and resolution of inflammation. Immunol Rev. 2016;273(1):357–370. doi: 10.1111/imr.12453. [DOI] [PMC free article] [PubMed] [Google Scholar]
- 55.Fourgeaud L, et al. TAM receptors regulate multiple features of microglial physiology. Nature. 2016;532(7598):240–244. doi: 10.1038/nature17630. [DOI] [PMC free article] [PubMed] [Google Scholar]
- 56.Hemphill JC, Bonovich DC, Besmertis L, Manley GT, Johnston SC. The ICH score: a simple, reliable grading scale for intracerebral hemorrhage. Stroke. 2001;32(4):891–897. doi: 10.1161/01.STR.32.4.891. [DOI] [PubMed] [Google Scholar]
- 57.Nahrendorf M, et al. The healing myocardium sequentially mobilizes two monocyte subsets with divergent and complementary functions. J Exp Med. 2007;204(12):3037–3047. doi: 10.1084/jem.20070885. [DOI] [PMC free article] [PubMed] [Google Scholar]
- 58.Ramachandran P, et al. Differential Ly-6C expression identifies the recruited macrophage phenotype, which orchestrates the regression of murine liver fibrosis. Proc Natl Acad Sci U S A. 2012;109(46):E3186–E3195. doi: 10.1073/pnas.1119964109. [DOI] [PMC free article] [PubMed] [Google Scholar]
- 59.Shechter R, et al. Recruitment of beneficial M2 macrophages to injured spinal cord is orchestrated by remote brain choroid plexus. Immunity. 2013;38(3):555–569. doi: 10.1016/j.immuni.2013.02.012. [DOI] [PMC free article] [PubMed] [Google Scholar]
- 60.Egawa M, et al. Inflammatory monocytes recruited to allergic skin acquire an anti-inflammatory M2 phenotype via basophil-derived interleukin-4. Immunity. 2013;38(3):570–580. doi: 10.1016/j.immuni.2012.11.014. [DOI] [PubMed] [Google Scholar]
- 61.Hilgendorf I, et al. Ly-6Chigh monocytes depend on Nr4a1 to balance both inflammatory and reparative phases in the infarcted myocardium. Circ Res. 2014;114(10):1611–1622. doi: 10.1161/CIRCRESAHA.114.303204. [DOI] [PMC free article] [PubMed] [Google Scholar]
- 62.Zigmond E, et al. Infiltrating monocyte-derived macrophages and resident Kupffer cells display different ontogeny and functions in acute liver injury. J Immunol. 2014;193(1):344–353. doi: 10.4049/jimmunol.1400574. [DOI] [PubMed] [Google Scholar]
- 63.Liu C, et al. Macrophages mediate the repair of brain vascular rupture through direct physical adhesion and mechanical traction. Immunity. 2016;44(5):1162–1176. doi: 10.1016/j.immuni.2016.03.008. [DOI] [PubMed] [Google Scholar]
- 64.Hammond MD, Ai Y, Sansing LH. Gr1+ macrophages and dendritic cells dominate the inflammatory infiltrate 12 hours after experimental intracerebral hemorrhage. Transl Stroke Res. 2012;3(1):s125–s131. doi: 10.1007/s12975-012-0174-9. [DOI] [PMC free article] [PubMed] [Google Scholar]
- 65.Taylor RA, et al. TGF-β1 modulates microglial phenotype and promotes recovery after intracerebral hemorrhage. J Clin Invest. 2017;127(1):280–292. doi: 10.1172/JCI88647. [DOI] [PMC free article] [PubMed] [Google Scholar]
- 66.Shaked I, et al. Transcription factor Nr4a1 couples sympathetic and inflammatory cues in CNS-recruited macrophages to limit neuroinflammation. Nat Immunol. 2015;16(12):1228–1234. doi: 10.1038/ni.3321. [DOI] [PMC free article] [PubMed] [Google Scholar]
- 67.Dal-Secco D, et al. A dynamic spectrum of monocytes arising from the in situ reprogramming of CCR2+ monocytes at a site of sterile injury. J Exp Med. 2015;212(4):447–456. doi: 10.1084/jem.20141539. [DOI] [PMC free article] [PubMed] [Google Scholar]
- 68.Lavin Y, et al. Tissue-resident macrophage enhancer landscapes are shaped by the local microenvironment. Cell. 2014;159(6):1312–1326. doi: 10.1016/j.cell.2014.11.018. [DOI] [PMC free article] [PubMed] [Google Scholar]
- 69.Gautier EL, et al. Gene-expression profiles and transcriptional regulatory pathways that underlie the identity and diversity of mouse tissue macrophages. Nat Immunol. 2012;13(11):1118–1128. doi: 10.1038/ni.2419. [DOI] [PMC free article] [PubMed] [Google Scholar]
- 70.Avraham-Davidi I, et al. On-site education of VEGF-recruited monocytes improves their performance as angiogenic and arteriogenic accessory cells. J Exp Med. 2013;210(12):2611–2625. doi: 10.1084/jem.20120690. [DOI] [PMC free article] [PubMed] [Google Scholar]
- 71.Schroit AJ, Madsen JW, Tanaka Y. In vivo recognition and clearance of red blood cells containing phosphatidylserine in their plasma membranes. J Biol Chem. 1985;260(8):5131–5138. [PubMed] [Google Scholar]
- 72.Lee SJ, Park SY, Jung MY, Bae SM, Kim IS. Mechanism for phosphatidylserine-dependent erythrophagocytosis in mouse liver. Blood. 2011;117(19):5215–5223. doi: 10.1182/blood-2010-10-313239. [DOI] [PubMed] [Google Scholar]
- 73.Kovtunovych G, Eckhaus MA, Ghosh MC, Ollivierre-Wilson H, Rouault TA. Dysfunction of the heme recycling system in heme oxygenase 1-deficient mice: effects on macrophage viability and tissue iron distribution. Blood. 2010;116(26):6054–6062. doi: 10.1182/blood-2010-03-272138. [DOI] [PMC free article] [PubMed] [Google Scholar]
- 74.Zhao X, Grotta J, Gonzales N, Aronowski J. Hematoma resolution as a therapeutic target: the role of microglia/macrophages. Stroke. 2009;40(3 Suppl):S92–S94. doi: 10.1161/STROKEAHA.108.533158. [DOI] [PubMed] [Google Scholar]
- 75.Tong LS, et al. Recombinant Gas6 augments Axl and facilitates immune restoration in an intracerebral hemorrhage mouse model. J Cereb Blood Flow Metab. 2017;37(6):1971–1981. doi: 10.1177/0271678X16658490. [DOI] [PMC free article] [PubMed] [Google Scholar]
- 76.Bhattacharyya S, et al. Enveloped viruses disable innate immune responses in dendritic cells by direct activation of TAM receptors. Cell Host Microbe. 2013;14(2):136–147. doi: 10.1016/j.chom.2013.07.005. [DOI] [PMC free article] [PubMed] [Google Scholar]
- 77.Ben-Batalla I, et al. Axl, a prognostic and therapeutic target in acute myeloid leukemia mediates paracrine crosstalk of leukemia cells with bone marrow stroma. Blood. 2013;122(14):2443–2452. doi: 10.1182/blood-2013-03-491431. [DOI] [PubMed] [Google Scholar]
- 78.Weinger JG, et al. Loss of the receptor tyrosine kinase Axl leads to enhanced inflammation in the CNS and delayed removal of myelin debris during experimental autoimmune encephalomyelitis. J Neuroinflammation. 2011;8:49. doi: 10.1186/1742-2094-8-49. [DOI] [PMC free article] [PubMed] [Google Scholar]
- 79.Weinger JG, Omari KM, Marsden K, Raine CS, Shafit-Zagardo B. Up-regulation of soluble Axl and Mer receptor tyrosine kinases negatively correlates with Gas6 in established multiple sclerosis lesions. Am J Pathol. 2009;175(1):283–293. doi: 10.2353/ajpath.2009.080807. [DOI] [PMC free article] [PubMed] [Google Scholar]
- 80.Stitt TN, et al. The anticoagulation factor protein S and its relative, Gas6, are ligands for the Tyro 3/Axl family of receptor tyrosine kinases. Cell. 1995;80(4):661–670. doi: 10.1016/0092-8674(95)90520-0. [DOI] [PubMed] [Google Scholar]
- 81.Hasanbasic I, Rajotte I, Blostein M. The role of gamma-carboxylation in the anti-apoptotic function of gas6. J Thromb Haemost. 2005;3(12):2790–2797. doi: 10.1111/j.1538-7836.2005.01662.x. [DOI] [PubMed] [Google Scholar]
- 82.Anderson HA, Maylock CA, Williams JA, Paweletz CP, Shu H, Shacter E. Serum-derived protein S binds to phosphatidylserine and stimulates the phagocytosis of apoptotic cells. Nat Immunol. 2003;4(1):87–91. doi: 10.1038/ni871. [DOI] [PubMed] [Google Scholar]
- 83.Thorp E, Vaisar T, Subramanian M, Mautner L, Blobel C, Tabas I. Shedding of the Mer tyrosine kinase receptor is mediated by ADAM17 protein through a pathway involving reactive oxygen species, protein kinase Cδ, and p38 mitogen-activated protein kinase (MAPK) J Biol Chem. 2011;286(38):33335–33344. doi: 10.1074/jbc.M111.263020. [DOI] [PMC free article] [PubMed] [Google Scholar]
- 84.Orme JJ, et al. Heightened cleavage of Axl receptor tyrosine kinase by ADAM metalloproteases may contribute to disease pathogenesis in SLE. Clin Immunol. 2016;169:58–68. doi: 10.1016/j.clim.2016.05.011. [DOI] [PMC free article] [PubMed] [Google Scholar]
- 85.O’Bryan JP, Fridell YW, Koski R, Varnum B, Liu ET. The transforming receptor tyrosine kinase, Axl, is post-translationally regulated by proteolytic cleavage. J Biol Chem. 1995;270(2):551–557. doi: 10.1074/jbc.270.2.551. [DOI] [PubMed] [Google Scholar]
- 86.Mracsko E, Veltkamp R. Neuroinflammation after intracerebral hemorrhage. Front Cell Neurosci. 2014;8:388. doi: 10.3389/fncel.2014.00388. [DOI] [PMC free article] [PubMed] [Google Scholar]
- 87.Lu Q, et al. Tyro-3 family receptors are essential regulators of mammalian spermatogenesis. Nature. 1999;398(6729):723–728. doi: 10.1038/19554. [DOI] [PubMed] [Google Scholar]
- 88.Sansing LH, Kasner SE, McCullough L, Agarwal P, Welsh FA, Kariko K. Autologous blood injection to model spontaneous intracerebral hemorrhage in mice. J Vis Exp. 2011;(54):2618. doi: 10.3791/2618. [DOI] [PMC free article] [PubMed] [Google Scholar]
- 89.Rosenberg GA, Mun-Bryce S, Wesley M, Kornfeld M. Collagenase-induced intracerebral hemorrhage in rats. Stroke. 1990;21(5):801–807. doi: 10.1161/01.STR.21.5.801. [DOI] [PubMed] [Google Scholar]
- 90.Chang CF, Cai L, Wang J. Translational intracerebral hemorrhage: a need for transparent descriptions of fresh tissue sampling and preclinical model quality. Transl Stroke Res. 2015;6(5):384–389. doi: 10.1007/s12975-015-0399-5. [DOI] [PMC free article] [PubMed] [Google Scholar]
- 91.Chang CF, Chen SF, Lee TS, Lee HF, Chen SF, Shyue SK. Caveolin-1 deletion reduces early brain injury after experimental intracerebral hemorrhage. Am J Pathol. 2011;178(4):1749–1761. doi: 10.1016/j.ajpath.2010.12.023. [DOI] [PMC free article] [PubMed] [Google Scholar]
- 92.Chang CF, Cho S, Wang J. (-)-Epicatechin protects hemorrhagic brain via synergistic Nrf2 pathways. Ann Clin Transl Neurol. 2014;1(4):258–271. doi: 10.1002/acn3.54. [DOI] [PMC free article] [PubMed] [Google Scholar]
- 93.Mack M, et al. Expression and characterization of the chemokine receptors CCR2 and CCR5 in mice. J Immunol. 2001;166(7):4697–4704. doi: 10.4049/jimmunol.166.7.4697. [DOI] [PubMed] [Google Scholar]
- 94.Mildner A, et al. Microglia in the adult brain arise from Ly-6ChiCCR2+ monocytes only under defined host conditions. Nat Neurosci. 2007;10(12):1544–1553. doi: 10.1038/nn2015. [DOI] [PubMed] [Google Scholar]
- 95.McCormick SM, Gowda N, Fang JX, Heller NM. Suppressor of cytokine signaling (SOCS)1 regulates interleukin-4 (IL-4)-activated insulin receptor substrate (IRS)-2 tyrosine phosphorylation in monocytes and macrophages via the proteasome. J Biol Chem. 2016;291(39):20574–20587. doi: 10.1074/jbc.M116.746164. [DOI] [PMC free article] [PubMed] [Google Scholar]
- 96.Byrne A, Reen DJ. Lipopolysaccharide induces rapid production of IL-10 by monocytes in the presence of apoptotic neutrophils. J Immunol. 2002;168(4):1968–1977. doi: 10.4049/jimmunol.168.4.1968. [DOI] [PubMed] [Google Scholar]
- 97.Fadok VA, Bratton DL, Konowal A, Freed PW, Westcott JY, Henson PM. Macrophages that have ingested apoptotic cells in vitro inhibit proinflammatory cytokine production through autocrine/paracrine mechanisms involving TGF-beta, PGE2, and PAF. J Clin Invest. 1998;101(4):890–898. doi: 10.1172/JCI1112. [DOI] [PMC free article] [PubMed] [Google Scholar]
Associated Data
This section collects any data citations, data availability statements, or supplementary materials included in this article.