

Abstract
Before insulin can stimulate myocytes to take up glucose, it must first move from the circulation to the interstitial space. The continuous endothelium of skeletal muscle (SkM) capillaries restricts insulin’s access to myocytes. The mechanism by which insulin crosses this continuous endothelium is critical to understand insulin action and insulin resistance; however, methodological obstacles have limited understanding of endothelial insulin transport in vivo. Here, we present an intravital microscopy technique to measure the rate of insulin efflux across the endothelium of SkM capillaries. This method involves development of a fully bioactive, fluorescent insulin probe, a gastrocnemius preparation for intravital microscopy, an automated vascular segmentation algorithm, and the use of mathematical models to estimate endothelial transport parameters. We combined direct visualization of insulin efflux from SkM capillaries with modeling of insulin efflux kinetics to identify fluid-phase transport as the major mode of transendothelial insulin efflux in mice. Model-independent experiments demonstrating that insulin movement is neither saturable nor affected by insulin receptor antagonism supported this result. Our finding that insulin enters the SkM interstitium by fluid-phase transport may have implications in the pathophysiology of SkM insulin resistance as well as in the treatment of diabetes with various insulin analogs.
Keywords: Metabolism, Vascular Biology
Keywords: Insulin, Skeletal muscle, endothelial cells
Introduction
Interorgan communication is essential for maintaining physiological homeostasis. One way organs communicate with each other is by sending molecular signals through the circulation. Before these signals can stimulate biological activity, they must be delivered appropriately to their target tissues through the microcirculation (1). In some organs, like skeletal muscle (SkM) and brain, capillaries are composed of endothelial cells (ECs) that are joined together by tight and adherens junctions. This continuous endothelium regulates the access of circulating macromolecules to the underlying tissue and, therefore, their ability to effect biological activity. The endothelial regulation of hormone delivery plays a significant role in both normal physiology and pathophysiology (2).
One hormone whose activity is controlled by the endothelium is insulin (3, 4). The ability of insulin to stimulate glucose uptake into SkM, the major site of insulin-stimulated glucose disposal, depends on the rate at which insulin traverses the endothelium (5). Furthermore, the delivery of insulin to SkM has been shown to be impaired in the setting of diet-induced insulin resistance (6–8). Despite the importance of transendothelial insulin efflux to insulin action and insulin resistance, the mechanism by which insulin transits the endothelium in SkM is unclear. King and colleagues demonstrated that insulin is taken up by cultured bovine aortic ECs through an insulin receptor–mediated process (9). Furthermore, experiments from Barrett’s group suggested that the clearance of insulin by SkM is saturable in vivo (10) and that intravenously injected insulin colocalizes with the insulin receptor on ECs (11). These studies support the hypothesis that insulin transits the SkM endothelium by a receptor-mediated process. On the other hand, Bergman and colleagues demonstrated that the movement of insulin from the plasma to the lymph, a surrogate for the interstitial fluid, is not saturable in vivo (12). Similarly, Vicent et al. showed that mice with an endothelial-specific deletion of the insulin receptor had normal glucose homeostasis (13), suggesting that transendothelial insulin transport is not receptor-mediated. Very recently, however, this same group described another mouse model lacking endothelial insulin receptors that displayed reduced SkM insulin signaling (14). The controversy regarding the mechanism of endothelial insulin transport may reflect the absence of direct measurements of insulin efflux across the endothelium in vivo.
Methods to measure the rates of molecular efflux across the capillary endothelium are lacking. Cultured EC monolayers, especially those using macrovascular ECs, lack several key characteristics of capillaries in a live organism (15, 16). On the other hand, in vivo interstitial sampling is limited because the number of capillaries feeding the space from which sampling is performed is unknown. Therefore, such techniques do not directly measure transendothelial molecular efflux. We sought to develop a method to directly measure capillary insulin efflux that could (a) be conducted in vivo with minimal physiological perturbations, (b) measure the concentration of insulin in both the intravascular and the adjacent interstitial spaces as a function of time, and (c) allow for determination of the capillary surface area feeding a given interstitial space.
For this purpose, we have developed a quantitative intravital microscopy technique to measure the transendothelial efflux rate of fluorescently labeled insulin in mice. To this end, we first developed a novel gastrocnemius preparation whereby we can visualize fluorescent insulin in SkM capillaries using confocal laser scanning microscopy. Next, we developed a fully automated image analysis algorithm, which allows us to obtain dynamic probe concentrations in the intravascular and interstitial spaces. We then fit these data to mathematical models to (a) determine the mechanism of transendothelial insulin transport (i.e., diffusion or facilitated transport) and (b) estimate appropriate endothelial transport parameters. Using both mathematical modeling and in vivo experiments, we show that transendothelial insulin efflux occurs by a nonsaturable process that does not involve the insulin receptor. With the use of intravital microscopy, we add critical insight to this important biological question, which has implications for the treatment of insulin resistance and diabetes.
Results
Site-specific conjugation of Alexa Fluor 647 to human insulin.
The most commonly used fluorescent insulin probes are FITC-insulin conjugates. These probes can contain a heterogeneous mixture of insulin conjugate species that have lower affinity for the insulin receptor than native insulin (17). Furthermore, the fluorescence intensity of FITC is sensitive to pH, falling off rapidly as the pH drops below 7 (18). Because various intracellular compartments display a range of pH values, the fluorescence intensity of FITC does not reliably reflect the concentration of the insulin probe. An ideal fluorescent insulin conjugate for in vivo imaging would be fully bioactive, have high signal-to-noise ratio in live tissue, and be unaffected by the microenvironment.
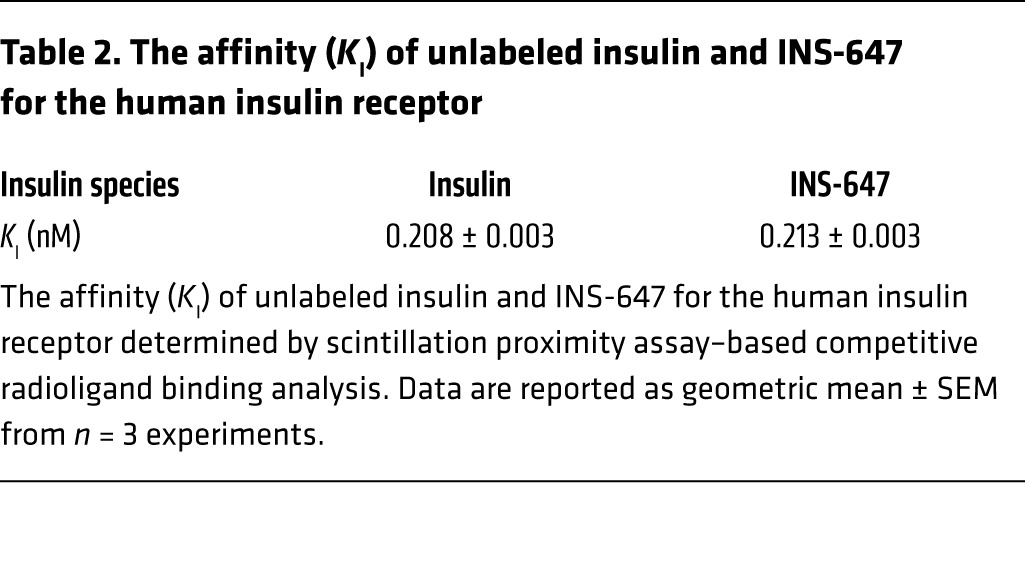
To achieve this goal, we labeled insulin in a site-specific manner with Alexa Fluor 647. We chose Alexa Fluor 647 because of its brightness and photostability (19), its insensitivity to pH (18), and the lack of tissue autofluorescence in the near-infrared wavelengths. Next, we selectively labeled the N-terminal phenylalanine of the B chain (B1) of human insulin (Figure 1A). We chose this site because conjugation of various molecules to B1 has little to no effect on the affinity of the resulting conjugate for the insulin receptor (17). To perform this labeling, we first blocked the reactivity of all free amines except the B1 phenylalanine using tert-butyloxycarbonyl (t-Boc) protection chemistry (Figure 1A). Then we conjugated the free amine on the unprotected B1 phenylalanine to Alexa Fluor 647 succinimidyl ester (Figure 1A). Finally, the t-Boc groups were removed with trifluoroacetic acid to complete the synthesis of the B1–Alexa Fluor 647–insulin conjugate (INS-647) (Figure 1A). Analysis of INS-647 using HPLC–mass spectrometry (LC-MS) revealed a single conjugate species with the appropriate mass (Figure 1, B and C, and Table 1). Most importantly, INS-647 has unaltered affinity for the insulin receptor as determined by scintillation proximity assay–based competitive radioligand binding analysis (Table 2). Moreover, during a 1-U/kg insulin tolerance test in vivo, INS-647 lowered blood glucose to the same extent as unlabeled insulin (Supplemental Figure 1, A and B; supplemental material available online with this article; https://doi.org/10.1172/JCI94053DS1) and fully stimulated muscle 2[14C]deoxyglucose accumulation (Supplemental Figure 1, C and D). To assess INS-647 at a more physiological insulin level, we performed hyperinsulinemic-euglycemic clamps with insulin and INS-647 (Figure 1, D–G). During steady-state hyperinsulinemia, there was no difference in the glucose infusion rate required to maintain euglycemia using insulin or INS-647 (Figure 1, D and E). Furthermore, the rates of insulin-stimulated peripheral glucose disposal (Figure 1F) and suppression of endogenous glucose production (Figure 1G) were not different using insulin or INS-647. Basal and clamp plasma insulin levels were also identical between groups (Supplemental Figure 2). These data indicate that INS-647 is fully bioactive at physiological concentrations. To determine whether the pharmacokinetic properties of INS-647 were similar to those of unlabeled insulin, we administered a 4-U/kg intravenous bolus of either insulin or INS-647. Measurements of arterial plasma insulin indicated that there was no difference in arterial kinetics between insulin and INS-647 (Supplemental Figure 3, A and B). INS-647 is also stable in the in vivo environment, with 90% of the dye remaining conjugated to insulin after 30 minutes in the circulation (Supplemental Figure 4D). In conclusion, we have synthesized a fully bioactive, optically optimized insulin conjugate that is well suited for in vivo imaging and other fluorescence-based applications.
Figure 1. Synthesis and characterization of a novel fluorescent insulin probe.

(A) Schematic depicting the chemical synthesis of INS-647. (B) Analytical RP-HPLC trace of INS-647. (C) Mass spectrum of INS-647. The labeled peaks indicate the 3 most abundant ions, (M+5H)5+, (M+6H)6+, and (M+7H)7+. (D–G) Bioactivity comparison of unlabeled insulin (n = 4) and INS-647 (n = 4) by hyperinsulinemic-euglycemic clamp. (D) Arterial glucose levels were clamped at approximately 150 mg/dl by variable venous infusion of 50% glucose. (E) The glucose infusion rate required to maintain euglycemia during hyperinsulinemia, a measure of insulin sensitivity. (F and G) Basal and insulin-stimulated rates of peripheral glucose disposal (Rd) and endogenous glucose production (endoRa) as determined by steady-state plasma levels of 3[3H]glucose. Groups were compared using unpaired Student’s t test. Boc-OSu, (butyloxycarbonyl)succinimide ester; DIPEA, N,N-diisopropylethylamine; DMF, dimethylformamide; m/z, mass/charge; NHS-AF647, Alexa Fluor 647–NHS ester; t-Boc, tert-butyloxycarbonyl; TFA, trifluoroacetic acid; TIPS, triisopropylsilane.
Table 1. Mass of INS-647 as calculated from the m/z of the 3 most abundant ions detected by mass spectrometry.
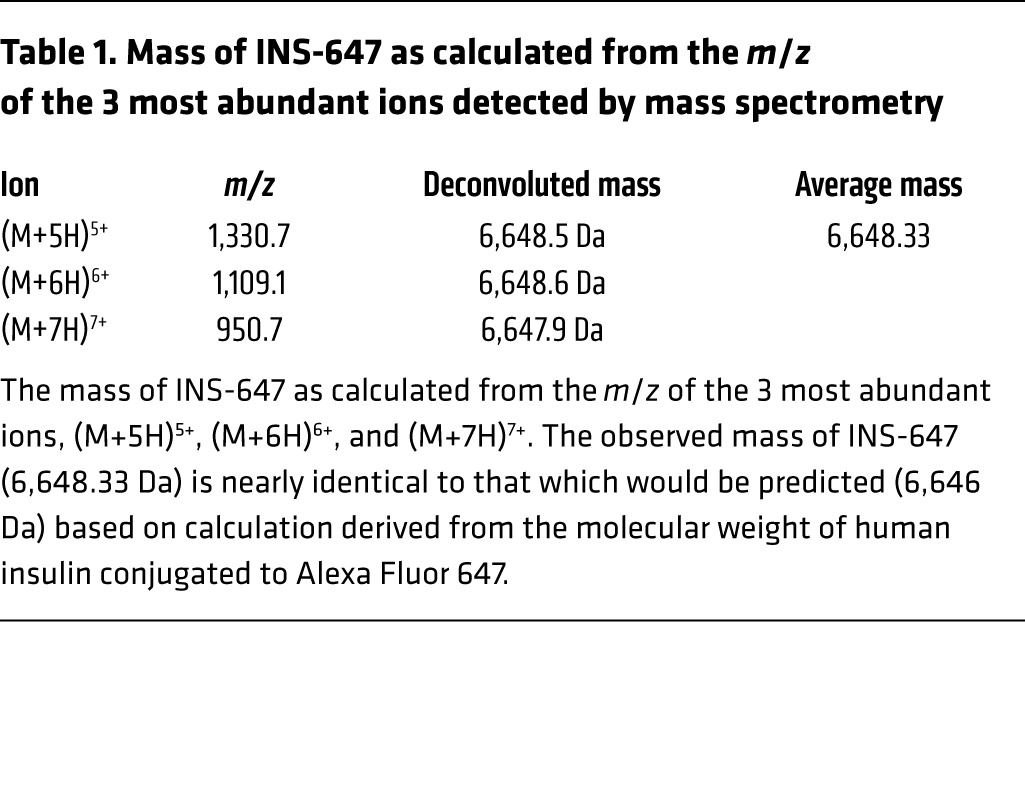
Table 2. The affinity (KI) of unlabeled insulin and INS-647 for the human insulin receptor.
Intravital microscopy of INS-647.
Previous in vivo imaging examinations of SkM vascular function have used thin, translucent muscles such as the cremaster or spinotrapezius (20, 21). We sought to develop a preparation of a representative SkM that required minimal perturbations to the tissue. Therefore, we chose to study the lateral gastrocnemius muscle because it is a major site of insulin-stimulated glucose disposal. The lateral gastrocnemius fibers are exposed by careful removal of the overlying skin and fascia. The anesthetized mouse can then be simply situated on its side so that the exposed gastrocnemius is positioned against a coverslip embedded in a custom stage mount (Figure 2A). We then tested whether our gastrocnemius preparation induced an inflammatory response that might affect our measurements of capillary function. In vivo imaging of leukocytes and platelets labeled with rhodamine 6G (about 90%–95% labeling efficiency of leukocytes; Supplemental Figure 5, A and B) revealed that very few leukocytes or platelets adhered to capillary walls during the course of the experiment (Figure 2B). Furthermore, Alexa Fluor 647–labeled BSA did not leak out from gastrocnemius capillaries (Figure 2C) as it would during an inflammatory response (22). These results show that our gastrocnemius preparation maintains SkM capillaries in a near-physiological state.
Figure 2. A novel gastrocnemius preparation for intravital fluorescence microscopy.

(A) Schematic showing the setup and mouse preparation for intravital microscopy. The left panel depicts the mouse situated on the stage mount with the necessary accessories. The inset shows a zoomed-in view of the exposed gastrocnemius fibers pressed against the coverglass and a diagram of the light path for confocal microscopy. The blue and green arrowheads indicate incident and emitted light, respectively. (B) In vivo imaging of leukocytes and platelets stained with rhodamine 6G. Background-subtracted representative images show rhodamine 6G+ structures during a typical experiment. Blue skeleton arrows and blue arrows indicate adherent and nonadherent leukocytes, respectively. Yellow arrows and skeleton arrows represent adherent and nonadherent platelets, respectively. Graphs show the number of adherent leukocytes and platelets before and after exposure to either no light (“No scans”; n = 3) or the same amount of light used during an insulin imaging experiment (“15 scans”; n = 4). (C) Imaging of albumin to test the stability of capillaries in the gastrocnemius preparation. Representative images are maximum intensity projections showing 2-megadalton tetramethylrhodamine-dextran (top) and Alexa Fluor 647–conjugated BSA (bottom) at the indicated time points following fluorescent albumin injection. (D) Insulin imaging with different light exposure doses to test for phototoxicity. Representative images are background-subtracted and contrast-enhanced maximum intensity projections showing INS-647 distribution at the indicated time points after 2 scans (top; n = 3) or after 15 scans (bottom; n = 5–6). Graph shows INS-647 intensity as a function of distance from the capillary at the indicated time points with varying light exposure doses. BSA-647, Alexa Fluor 647–labeled bovine serum albumin; PMT, photomultiplier tube; TMR-dex, tetramethylrhodamine-dextran.
To measure the rate of INS-647 transendothelial efflux, it is imperative to be able to resolve the intravascular and interstitial spaces. In order to demarcate the intravascular space, we infused 50 μg of a tetramethylrhodamine-labeled 2-megadalton dextran probe (rho-dex) through an indwelling jugular vein catheter (Figure 3A). Subsequently, the rho-dex is imaged using a confocal microscope (Zeiss LSM 780) to find a suitable region for imaging. After a field of view is selected, a 4-U/kg bolus of INS-647 is injected into the mouse through the indwelling catheter. 3D confocal images of both rho-dex and INS-647 are acquired every minute for the first 10 minutes and then at 12.5, 15, 20, and 30 minutes thereafter (Figure 3A).
Figure 3. INS-647 imaging, analysis, and quantitation.

(A) Representative images (maximum intensity projections) of an INS-647 imaging experiment. The top panel shows 2-megadalton tetramethylrhodamine-dextran and the bottom panel shows INS-647 at the indicated time points following INS-647 injection. (B) General workflow for image analysis. (C) Example 3D plot of INS-647 intensity (z axis) as a function of distance from the capillary (y axis) and time (x axis). (D) Schematic of the mathematical models used to estimate endothelial transport parameters. White pentagons represent insulin. In the plasma compartment (red/blue), insulin is shown exiting the capillary through interendothelial junctions or by a receptor-mediated process. The equations used to describe these behaviors are the diffusion equation (top), fluid-phase transport equation (middle), and Michaelis-Menten equation (bottom). See Methods for details regarding equations and symbols.
Imaging parameters (i.e., laser power, sampling frequency) were chosen to minimize both the photobleaching of INS-647 and phototoxicity caused by irradiation of live tissue with visible light (23). We set our imaging parameters so that photobleaching would account for at most approximately 5%–8% loss in INS-647 fluorescence intensity during an experiment (Supplemental Figure 4, A–C). Furthermore, the amount of light used during an INS-647 imaging experiment did not alter the intravascular or extravascular distribution of INS-647 (Figure 2D), accumulation of 2[14C]deoxyglucose (Supplemental Figure 6A), or leukocyte adhesion (Figure 2B). These findings suggest that our experimental imaging conditions do not induce any detectable photodamage. It is important to note that glucose falls during the experiment and reaches approximately 55 mg/dl by t = 30 minutes (Supplemental Figure 6B). While we considered clamping glucose during the imaging experiment, we found that it is neither logistically feasible nor necessarily preferable to do so. Namely, the repeated sampling and infusions required for glucose clamping can cause microcirculatory flow alterations and may result in additional mouse motion artifacts. Thus, we elected to retain in our experimental design the normal physiological effect of insulin on glucose lowering. It is notable that insulin efflux kinetics were unaffected by glucose levels (see Model selection below for further discussion). In summary, our quantitative, intravital image acquisition design allows us to collect spatial and temporal information regarding the levels of rho-dex and INS-647 in the gastrocnemius of live mice without causing any major perturbations to the tissue.
Quantitative image analysis.
To estimate endothelial transport parameters, the levels of INS-647 as a function of time in both intravascular and interstitial spaces must be measured. To obtain this information, we developed an Otsu-based (24) automated vascular and interstitial segmentation algorithm using ImageJ (Figure 3B and see Methods). This algorithm is used to generate intensity-time profiles of INS-647 in the intravascular and interstitial spaces (Figure 3C). To test the performance of our vascular segmentation algorithm, we compared it against a manual segmentation of 192 images. We found that while our algorithm was able to capture most of the vascular spaces outlined manually, it overestimated the area of vascular space by approximately 45% (Supplemental Figure 7, A and B). While this led to a slight underestimation of INS-647 levels (Supplemental Figure 7, C and D), it did not significantly alter any transport parameter estimates (Supplemental Figure 7, E–H), nor did it change model-independent efflux parameters (Supplemental Figure 7I). Because the method of image segmentation did not affect the final results, we think that the benefits of automating image analysis (enhanced reproducibility, removal of user bias, faster processing speeds) outweigh the small reduction in segmentation accuracy.
After obtaining the capillary and interstitial INS-647 curves, we sought to quantify the endothelial transport parameters that control the movement of INS-647 from the plasma to the interstitial space. The transport parameters of interest depend on the mechanism by which a molecule traverses the continuous endothelium. For instance, if INS-647 crosses the endothelium by a receptor-mediated process, as has been hypothesized for insulin (9, 10), then the parameters of interest are the Michaelis-Menten parameters, Km and Vmax. If instead INS-647 leaks out of capillaries through interendothelial junctions, then the parameters of interest are either permeability of the vessel to INS-647 (diffusion), or the mass transfer coefficient (fluid-phase transport).
To make this determination, we fit our experimental data to 3 different mathematical models. As the base model, we described INS-647 movement within the interstitial space by the diffusion equation and assumed first-order removal of INS-647 from this space (Figure 3D and see Methods for extended equations). A pertinent aspect of the model is the boundary condition describing movement of INS-647 from the plasma to the interstitial space. We described the boundary behavior of INS-647 with equations describing either diffusion (25), fluid-phase transport (26), or Michaelis-Menten kinetics. We then solved the diffusion equation with the different boundary conditions to generate models that described these potential mechanisms of INS-647 transport. Experimental data were fit to these models using weighted nonlinear least-squares regression in MATLAB. This allows us to estimate the following parameters: permeability for the diffusion model, mass transfer coefficient for the fluid-phase transport model, and Km and Vmax for the Michaelis-Menten model. All models allowed for estimation of the interstitial diffusion coefficient and removal constant of INS-647. Finally, the goodness of fit of the experimental data to the models was determined by analysis of the sum of the weighted residuals.
Model selection: INS-647 efflux data are best described by a fluid-phase transport model.
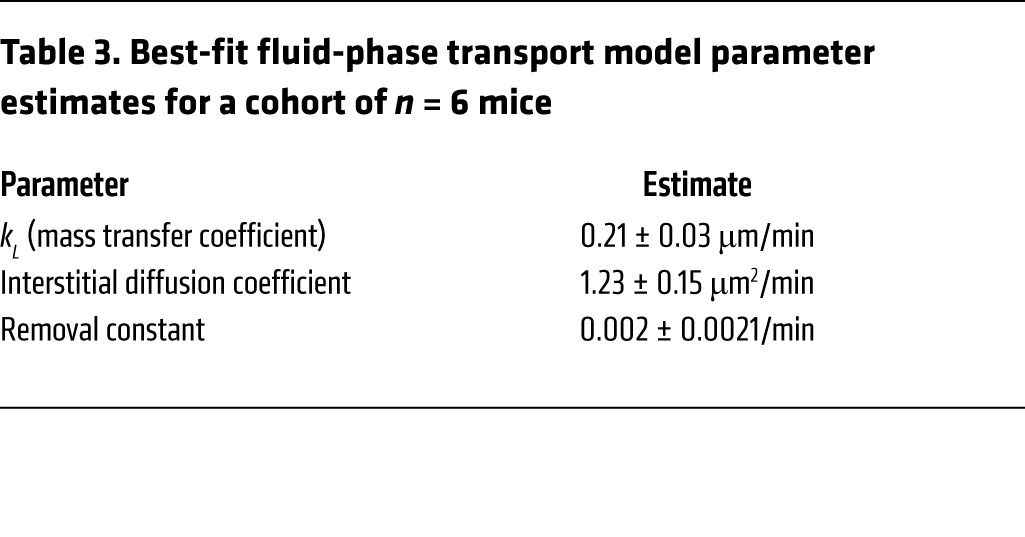
We fit our experimental INS-647 imaging data (Figure 4A) to models describing either transendothelial diffusion, fluid-phase transport, or Michaelis-Menten kinetics. Both visual (Figure 4, B–D) and residual (Figure 4E) analysis of best-fit model simulations revealed that INS-647 efflux kinetics fit the fluid-phase transport and Michaelis-Menten models better than the diffusion model. Therefore, we rejected the diffusion model. We then compared the fluid-phase transport model with the Michaelis-Menten model. The INS-647 imaging data fit the fluid-phase transport model slightly better than the Michaelis-Menten model (weighted sum of squared residuals: 81.6 fluid-phase transport vs. 88.0 Michaelis-Menten). Furthermore, the fluid-phase transport model contains 1 less variable parameter than the Michaelis-Menten model. Finally, the estimate of the Michaelis constant, Km (226 intensity units; Supplemental Figure 8), is 2-fold higher than INS-647 levels ever reach in the capillary plasma. This indicates that the Michaelis-Menten model essentially predicts a linear relationship between capillary INS-647 and INS-647 efflux rates. This relationship is more compatible with fluid-phase transport than a receptor-mediated process. A true receptor-mediated process would be expected to have a Km that is in the same range as the plasma levels of INS-647. Therefore, based on goodness of fit, the principle of parsimony, and the reasonability of parameter estimates, we rejected the Michaelis-Menten model in favor of the fluid-phase transport model. The best-fit fluid-phase model parameter estimates are shown in Table 3. The decision to reject the Michaelis-Menten model was substantiated by results described in the following section.
Figure 4. Mathematical modeling predicts that insulin exits SkM capillaries by fluid-phase transport.

(A) Data from an INS-647 imaging experiment. (B–D) Results from fitting experimental INS-647 imaging data to mathematical models describing diffusion, fluid-phase transport, or Michaelis-Menten transport kinetics. Plots are model simulations based on best-fit parameter estimates. (E) Weighted sum of squared residuals for each of the different model simulations as compared with the experimental data for a group of n = 6 mice. The number of variable parameters is indicated above the bar for each model. Param., parameters.
Table 3. Best-fit fluid-phase transport model parameter estimates for a cohort of n = 6 mice.
To test whether the changing levels of glucose or insulin had effects on insulin efflux kinetics, we modeled temporal subsets of our data. Namely, we modeled data from t = 0 to t = 5, 7, 10, 12.5, 15, 20, or 30 minutes (Supplemental Figure 9) to determine whether the mass transfer coefficient estimate varied at these time points. We found that the mass transfer coefficient estimate did not change when analysis was restricted to earlier time points, although the variability in the estimate did increase (Supplemental Figure 9). This suggests that the mass transfer coefficient is relatively constant over the course of the experiment. Because insulin (Supplemental Figure 11A) and glucose (Supplemental Figure 6B) change over the course of the experiment while the mass transfer coefficient remains stable, this implies that the mass transfer coefficient is independent of glucose and insulin levels. Moreover, these data provide a foundation for shortening the data acquisition time window in future experiments.
Transendothelial insulin efflux is nonsaturable and does not require the insulin receptor.
To test the model prediction that insulin efflux is not receptor-mediated, we treated mice with S961, a peptide insulin receptor antagonist that has nearly the same affinity for the insulin receptor as insulin (27). Ten minutes before the INS-647 bolus, mice were treated with 168 nmol/kg of S961 (7-fold molar excess over insulin). Subsequently, in vivo imaging of INS-647 was performed as described above. S961 effectively blocked both the insulin-induced lowering of blood glucose (Supplemental Figure 10A) and insulin-stimulated muscle 2[14C]deoxyglucose uptake (Supplemental Figure 10B), suggesting that insulin receptors were successfully inhibited. However, we found that S961 had no effect on insulin efflux kinetics (Figure 5A). Namely, S961 had no effect on the mass transfer coefficient estimate (Figure 5B), the dissipation of the capillary/interstitial insulin gradient following INS-647 injection (model-independent parameter; Figure 5C), nor the capillary and interstitial behavior of INS-647 (Supplemental Figure 11, A–D). These findings demonstrate that the insulin receptor does not mediate the transit of insulin across the capillary wall in SkM.
Figure 5. Transendothelial insulin efflux does not require the insulin receptor.

(A) Representative INS-647 images (maximum intensity projections) from mice pretreated either with (4 U/kg INS-647 + S961; bottom) or without (4 U/kg INS-647; top) an insulin receptor antagonist. (B) Best-fit fluid-phase transport model estimates of the mass transfer coefficient in mice treated with (INS-647 + S961; n = 5) or without (INS-647; n = 6) the insulin receptor antagonist. (C) The ratio of plasma to interstitial INS-647 as a function of time following injection. Interstitial INS-647 is defined as the average INS-647 intensity at 1–3 μm from the capillary wall. Graph at right shows the exponential decay constant of the plasma-to-interstitial ratio, a model-independent descriptor of insulin efflux. Groups were compared using Student’s t test.
We then tested whether the movement of insulin across the endothelium was saturable. To do this, we treated mice with either 0.5 U/kg INS-647, 1 U/kg INS-647, 2 U/kg INS-647, 4 U/kg INS-647, 4 U/kg INS-647 plus 4 U/kg unlabeled insulin, or 4 U/kg INS-647 plus 12 U/kg of unlabeled insulin (Figure 6A). If insulin efflux were saturable, we would predict that (a) the rate at which plasma insulin equilibrates with the interstitial space would decrease with increasing doses of insulin and (b) unlabeled insulin would compete for the saturable transport machinery and reduce the apparent transport of INS-647. However, we found that the dissipation kinetics of the capillary/interstitial INS-647 gradient were the same regardless of the dose of insulin used (Figure 6, B and C). Furthermore, the mass transfer coefficient was not different for any of the doses that were amenable to mathematical modeling (Supplemental Figure 12; 2 U/kg and above). Notably, low signal-to-noise ratio at doses below 2 U/kg prevented stable, unique estimates of model parameters at these doses. The kinetics of INS-647 in the capillary varied depending on dose (Supplemental Figure 13A), with higher doses of insulin being cleared more quickly than lower ones. These differences were also reflected in the interstitial INS-647 kinetics (Supplemental Figure 13B). This finding is consistent with the notion that insulin appearance in the interstitial space is a linear function of the levels of insulin in the plasma (i.e., fluid-phase transport). In total, these results demonstrate that transendothelial insulin efflux is not saturable.
Figure 6. Transendothelial insulin efflux is not saturable.

(A) Representative INS-647 images (maximum intensity projections) from mice treated with either 0.5 U/kg INS-647 (n = 7), 1 U/kg INS-647 (n = 7), 2 U/kg INS-647, 4 U/kg INS-647 (n = 6), 4 U/kg INS-647 + 4 U/kg unlabeled insulin (n = 6), or 4 U/kg INS-647 + 12 U/kg unlabeled insulin (n = 6). (B) The ratio of plasma to interstitial INS-647 as a function of time following injection. (C) The exponential decay constant of the plasma/interstitial gradient plotted as a function of insulin dose.
Method validation.
The rate of transendothelial efflux of molecules decreases with increasing molecular size (28). To validate our measurements and demonstrate that we can reproduce this phenomenon with our technique, we imaged fluorescently labeled dextrans of sizes 3 kDa and 10 kDa (Figure 7A). Visually, one can see that the smaller molecules leak out of capillaries much faster than the larger ones (Figure 7A). Mathematical modeling showed that the extravasation of these probes occurred by fluid-phase transport (Supplemental Figure 14, A–D). Mass transfer coefficient estimates show that efflux rates decrease as probe molecular weight increases (Figure 7B). Furthermore, the kinetics of capillary/interstitial gradient dissipation were slower with increasing molecular weight, as predicted (Figure 7C). Therefore, we are confident in the accuracy of our measurements and our ability to resolve differences in transendothelial efflux parameters.
Figure 7. Validation of intravital fluorescence microscopy for resolving differences in transendothelial molecular efflux.

(A) Representative images (maximum intensity projections) of 3-kDa dextran–Alexa Fluor 680 (n = 6), INS-647 (n = 6), and 10-kDa dextran–Alexa Fluor 647 (n = 6) distribution at the indicated time points following injection. (B) Best-fit model estimates of the mass transfer coefficient for the probes in A displayed as a function of molecular weight. (C) Ratio of plasma/interstitial fluorescence intensity as a function of time following injection for the indicated probes. Groups were compared using ANOVA with a Bonferroni correction for multiple comparisons.
Discussion
We have developed an intravital imaging technique to measure the flux of insulin across the endothelium of individual SkM capillaries. To accomplish this, we (a) synthesized a fluorescent, bioactive insulin probe, (b) developed a novel gastrocnemius preparation, (c) developed an automated vascular segmentation algorithm, and (d) fit data to mathematical models to estimate transport parameters. Notably, our measurement of the steady-state plasma/interstitial insulin gradient with intravital microscopy is similar to measurements made by both lymph sampling (12) and microdialysis (29). This observation supports the accuracy of our method. Using this technique, we show that transendothelial insulin transport in SkM capillaries is dominated by a process that is not saturable and does not require the insulin receptor.
One of insulin’s key functions is to stimulate muscle glucose uptake (MGU). Before insulin can stimulate MGU it must first cross the endothelial barrier separating the plasma from myocytes. Previous studies have shown that insulin-stimulated MGU depends on the ability of insulin to cross this endothelial barrier (30). Furthermore, experiments in insulin-resistant subjects have shown that impaired insulin delivery is a feature of muscle insulin resistance (6–8), which is associated with type 2 diabetes. Therefore, characterizing the mechanism of capillary endothelial insulin transport is critical to understanding the progression of insulin resistance (31). With the use of our in vivo imaging technique, we advance the understanding of transendothelial insulin efflux by showing that insulin moves across the endothelium by fluid-phase transport. Our findings extend those of Bergman and colleagues, who previously showed that the delivery of insulin to SkM is not saturable in dogs (12). Furthermore, we demonstrate that the insulin receptor is not required for the movement of insulin across the endothelium. This result is supported by experiments by Kahn and colleagues, who showed that mice lacking insulin receptors on ECs are fully insulin-sensitive (13).
Fluid-phase transport may be accomplished by either convective movement of insulin through interendothelial junctions, a nonspecific vesicular process, or a combination of both. Notably, Bendayan et al. used immunoelectron microscopy to show that insulin can be localized inside endothelial vesicles (32), suggesting the importance of the latter mechanism. Caveolar vesicles, which can mediate the transendothelial movement of macromolecules, have also been implicated in the endothelial transport of insulin (33). Future experiments will be aimed at deconvolution of these mechanisms.
One potential limitation of the current technique is measurement sensitivity. Namely, the lowest dose of INS-647 administered (0.5 U/kg) produces somewhat higher than physiological plasma insulin levels. Thus, we cannot rule out the existence of a low-capacity, Michaelis-Menten–like insulin transport mechanism that operates at lower insulin levels. Such a process would be non–insulin receptor–mediated, as neither insulin receptor antagonism nor unlabeled insulin had any effect on insulin efflux. As yet, there is no evidence for the existence of such a process in vivo or its significance. However, it is possible that there is some vesicular compartment (e.g., caveolae) that transports insulin at low concentrations via Michaelis-Menten kinetics.
Many investigators have observed a delay between the rise in plasma insulin levels and the stimulation of glucose uptake in SkM (3). This delay has largely been attributed to the continuous endothelium of SkM capillaries, which limits the access of macromolecules to the interstitial space. Our findings regarding the mechanism of transendothelial insulin efflux lend insight into the characterization of the endothelial barrier. Namely, the movement of insulin from the plasma to the interstitial space may be limited by the presence of the glycocalyx, the size of interendothelial junctions or pores, the transmission of convective forces to the capillary, the kinetics of vesicular trafficking, or the rate at which insulin can promote capillary recruitment. A better understanding of the variables controlling transendothelial insulin movement will lead to improved therapeutic strategies aimed at reversing SkM insulin resistance. Such strategies might include small molecules that can enhance insulin delivery to SkM or, for diabetics, the synthesis of novel insulin analogs that can more readily access muscle.
The mechanism of endothelial insulin transport has been controversial. Studies using cultured monolayers of ECs have shown that transendothelial insulin efflux is a saturable, insulin receptor–mediated transport process (9, 11). In contrast, we convincingly demonstrate that insulin movement across the endothelium is nonsaturable and does not require the insulin receptor in vivo. The contrasting results likely reflect the difference in behavior between ECs in culture and capillaries in vivo. EC monolayers are 100 times more permeable to proteins than are intact vessels (15) and lack the physiological milieu that profoundly influences endothelial function in live animals (16). Furthermore, cultured EC experiments typically use macrovascular ECs such as umbilical vein or aortic ECs, whereas molecular exchange occurs in the microvasculature in vivo. The phenotypic contrast between microvascular and macrovascular ECs (34) creates difficulties in interpretation. In fact, the mechanism by which insulin is taken up by ECs depends on the type of EC used (35).
In vivo examinations of insulin delivery to the SkM interstitial fluid have similarly produced conflicting results (7, 10, 12–14). Some studies have used interstitial fluid sampling methods such as microdialysis and lymph sampling or measured indices of total SkM insulin delivery. These techniques are limited because the number of capillaries feeding the space from which sampling is performed is unknown. Therefore, such techniques do not directly measure transendothelial molecular efflux but rather measure a combination of both microvascular perfusion and endothelial transport. That is to say, any change in SkM insulin availability could be due to a change in (a) the number of perfused capillaries, (b) insulin efflux across the endothelium, or (c) a combination of both. For instance, Konishi et al. recently reported that a mouse model lacking EC insulin receptors has delayed SkM insulin signaling following an insulin bolus (14). The implication is that insulin delivery to SkM is slowed. It is impossible to know whether such an effect is due to impaired insulin-stimulated perfusion or insulin efflux from capillaries. Given that insulin receptor antagonism has no effect on insulin efflux (Figure 5), and the compelling work from several laboratories that shows that insulin stimulates SkM perfusion (36–38), it is likely that the delay in SkM insulin signaling in these mice is due to a reduction in insulin-stimulated capillary recruitment. However, it is impossible to directly deconvolve perfusion and efflux from this approach. With intravital imaging, we measure insulin efflux at the level of individual capillaries, which allows us to directly measure transendothelial insulin efflux.
Our in vivo imaging technique makes major advances in other key areas. INS-647 is a suitable fluorescent insulin probe in that it is homogenous, fully bioactive, insensitive to changes in pH, photostable, and stable in the in vivo environment. This is an improvement over the use of FITC-insulins, which do not bind the insulin receptor with the same affinity as insulin, are very sensitive to changes in pH, and spectrally overlap with endogenous tissue fluorescence. Finally, our novel gastrocnemius preparation does not require any exteriorization or major manipulation of the tissue and maintains the SkM capillaries in a near-physiological state.
In summary, we provide a detailed description of an intravital microscopy technique to assess insulin transport by the capillary endothelium in live mice. To image insulin in vivo, we have developed a novel fluorescent insulin probe that is fully bioactive as well as a gastrocnemius preparation that lacks any detectable inflammatory response. Furthermore, we have optimized imaging parameters to prevent photobleaching of INS-647 and phototoxicity. To measure dynamic INS-647 levels in vascular and interstitial compartments, we developed an automated and validated image analysis algorithm. Subsequently, we used mathematical model–dependent and model-independent analysis of insulin efflux rates to show that SkM capillary insulin efflux occurs by a nonsaturable fluid-phase transport process over a 32-fold range of insulin doses. These findings may have implications in the pathophysiology of SkM insulin resistance as well as in the treatment of diabetes with various insulin analogs.
Methods
Mice.
Mice were housed in a humidity-controlled facility and kept on a 12-hour light/dark cycle. Male C57BL/6J mice (Jackson Laboratory) aged 11–13 weeks fed a standard chow diet (5001 Laboratory Rodent) were used for all experiments. Mice were fasted for 5 hours before all imaging and metabolic phenotyping experiments.
INS-647 synthesis and analysis.
The conjugation of Alexa Fluor 647 to insulin follows a modified version of a procedure described previously (39). Diisopropylethylamine (DIPEA; 7 mmol, 1.22 ml, 40 Eq) was initially added to a solution of biosynthetic human insulin (BHI; 0.2 mmol, 1.16 g) dissolved in DMSO (15 ml). (Butyloxycarbonyl)succinimide ester (Boc-OSu; 0.445 mmol, 95.7 mg, 2.5 Eq) was then dissolved in DMSO (2 ml) and added slowly to the BHI solution over 5 minutes. After 40 minutes, the reaction was quenched with trifluoroacetic acid (TFA; 100 μl) and diluted with 0.1 N HCl (150 ml). The reaction mixture was purified by reverse-phase HPLC (RP-HPLC; Waters 19 × 300 mm SymmetryPrep C18) using gradients of acetonitrile in water with 0.1% TFA. Fractions containing the desired product as determined by LC-MS were pooled and lyophilized to provide a white powder (647.3 mg). The calculated molecular weight was 6,007.8 Da, and the electrospray mass spectrometry observed average mass was 6,006.7 Da. This intermediate product was a BHI conjugate containing t-Boc protecting groups on the A1 and B29 position of BHI (A1,B29-Bis-Boc-BHI).
To conjugate Alexa Fluor 647 to the protected BHI intermediate, Alexa Fluor 647–NHS ester (2 mg; Life Technologies) was dissolved in DMSO (20 μl) and added slowly to a dimethylformamide solution (500 μl) containing A1,B29-Bis-Boc-BHI (20 mg) and DIPEA (17 μl, 30 Eq). The reaction mixture was wrapped in aluminum foil, agitated for 5 hours, and then quenched with acetic acid (200 μl), diluted with water (10 ml), and lyophilized. The Boc groups were removed by treatment with a mixture of TFA/water/triisopropylsilane (92:4:4, vol/vol) for 1 hour at room temperature, and the material was then precipitated with cold diethyl ether and centrifuged at 2,147 x g for 5 minutes. The blue pellet was resuspended in acetonitrile/water (1:1, vol/vol) and purified to 98.9% by RP-HPLC (Waters 7.8 × 300 mm SymmetryPrep C18) using gradients of 0.01% HCl/acetonitrile in water. Fractions containing the desired product, INS-647, were pooled and lyophilized to provide a blue powder (8 mg). The calculated molecular weight was 6,646.6 Da, and the electrospray mass spectrometry observed average mass was 6,648.3 Da. The location of the Alexa Fluor 647 label was confirmed at the B1 position by digestion of 100 μg of product with Glu-C endoproteinase (P6181-50UG, Sigma-Aldrich; 10 μg) and analysis of the fragments by LC-MS.
Insulin receptor–binding assay.
To determine the affinity of INS-647 for the insulin receptor, we used a scintillation proximity assay (SPA) as previously described (40). Briefly, membranes were prepared from HEK293 cells overexpressing the human insulin receptor. Membranes were then immobilized on polyvinyltoluene polyethyleneimine–treated Type A wheat germ agglutinin–coupled SPA beads (GE Healthcare). Subsequently the abilities of INS-647 and BHI to compete with 125I-insulin binding to insulin receptors were assessed. 125I-insulin binding to the SPA beads was detected with a scintillation counter (PerkinElmer MicroBeta Trilux). IC50 values for unlabeled insulin and INS-647 were calculated from 4-parameter logistic nonlinear regression analysis. IC50 values were then converted to affinity values (KI) using the Cheng-Prussoff equation KI = IC50/(1 + L/Kd), where L is the concentration of radioligand used in the experiment and Kd is the equilibrium binding affinity for the radioligand for the human insulin receptor (0.218 nM as determined by saturation analysis). Three independent experiments were conducted with the geometric mean and SEM reported.
Insulin tolerance tests.
We performed insulin tolerance tests (ITTs) to assess the in vivo bioactivity of INS-647. ITTs were performed under anesthesia to mimic the conditions of the in vivo imaging experiment. At least 5 days before the day of the study, mice had indwelling catheters implanted in the jugular vein for infusions of insulin, isotopic glucose tracers, and anesthetics (41). After a 5-hour fast, mice were anesthetized with an intravenously administered ketamine/xylazine/acepromazine (KXA) cocktail (7.9/1.6/0.2 mg/kg). Booster doses of KXA were given as needed throughout the remainder of the study. Depth of anesthesia was ensured by checking of the response to a toe pinch. Basal glucose was measured (Accu-Chek Aviva) from the tail vein at 15 and 5 minutes prior to the start of the experiment. At t = 0 minutes a 1-U/kg bolus of either insulin or INS-647 along with 2[14C]deoxyglucose (2[14C]DG; 13 μCi; PerkinElmer) was administered. Subsequently, glucose was measured at t = 3, 6, 9, 12, 15, 20, 25, and 30 minutes. Mice were euthanized by cervical dislocation immediately following the experiment, and tissues were harvested for further analysis. Glucose disappearance rate was calculated as the rate of fall of glucose over the first 15 minutes of the experiment (42).
Measurement of isotopic glucose tracer accumulation.
The rate of 2[14C]DG-phosphate (2[14C]DGP) tissue accumulation is proportional to the rate of glucose uptake (43). To determine the tissue level of 2[14C]DGP, tissues were mechanically homogenized (Bullet Blender, Next Advance) in 0.5% perchloric acid. After centrifugation at 16,000 x g for 5 minutes, homogenate pH was neutralized to 7.5 with potassium hydroxide. In 1 aliquot of the neutralized homogenate, radioactivity was counted using Ultima Gold scintillation cocktail (PerkinElmer) and a Tri-Carb 2900TR liquid scintillation counter (Packard). The radioactivity in this aliquot represents the combined levels of both 2[14C]DG and 2[14C]DGP. A separate aliquot was treated with Ba(OH)2 and ZnSO4 to remove 2[14C]DGP and any radioactivity incorporated into glycogen. This aliquot was then counted to measure levels of 2[14C]DG alone. The tissue levels of 2[14C]DGP were calculated as the difference between the first (2[14C]DG + 2[14C]DGP) and second (2[14C]DG) aliquots.
Hyperinsulinemic-euglycemic clamps.
Hyperinsulinemic-euglycemic clamps were performed in conscious, unstressed, chronically catheterized mice as described previously (41). Mice were fasted for 5 hours before starting of the insulin clamp. At t = –90 minutes, a 3[3H]glucose (0.04 μCi/min; PerkinElmer) infusion was started to determine rates of endogenous glucose appearance (endoRa) and glucose disappearance (Rd). At t = 0 minutes, continuous insulin (4 mU/kg/min; Humulin R, Eli Lilly) or INS-647 (4 mU/kg/min) and variable glucose (D50 + 50 μCi 3[3H]glucose) infusions were initiated. From t = 0 to 120 minutes, arterial glucose was measured every 10 minutes, with the exogenous glucose infusion rate (GIR) adjusted to maintain euglycemia (130–150 mg/dl). Steady-state GIR and 3[3H]glucose kinetics were determined from t = 80 to 120 minutes. Arterial blood samples were taken at baseline (basal) and during steady state (clamp) to measure insulin levels.
Analysis of plasma and tissue samples from hyperinsulinemic-euglycemic clamps and insulin pharmacodynamic studies.
Plasma insulin was measured by a double antibody radioimmunoassay (44). Plasma 3[3H]glucose was measured using liquid scintillation counting as described previously (45). EndoRa and Rd were calculated using steady-state equations (46).
Insulin and INS-647 pharmacodynamics.
Insulin pharmacodynamic studies were performed in mice containing indwelling jugular vein and carotid artery catheters. Following a 5-hour fast, mice were anesthetized with (7.9/1.6/0.2 mg/kg) KXA through the venous catheter and placed on a heating pad. After a baseline arterial blood sample was taken, mice received a 4-U/kg intravenous bolus of insulin or INS-647. Subsequently, arterial blood samples were collected at t = 1, 3, 5, 10, 15, and 30 minutes following the bolus.
INS-647 stability in vivo.
To assess the stability of INS-647 in vivo, we first injected a bolus of INS-647 into anesthetized mice through an indwelling jugular vein catheter. Thirty minutes later, tail vein blood was collected into heparinized capillary microtubes. Plasma was separated from erythrocytes by centrifuging of whole blood at 16,000 x g for 1 minute. Plasma was then diluted 25× with 0.9% NaCl, and the total plasma fluorescence was measured in a quartz cuvette (Sterna Cells) with a FluoroMax-4 Spectrofluorometer (Horiba). Samples were excited at 633 nm, and emission spectra were collected from 650 to 750 nm. Fluorescence intensity for a sample was calculated as the intensity area under the curve from 650 to 750 nm. Background fluorescence was measured in unlabeled mouse plasma and subtracted from samples containing INS-647. After measurement of total fluorescence, the plasma was separated into low–molecular weight (<3 kDa) and high–molecular weight (>3 kDa) fractions using centrifugal filters with a 3-kDa cutoff (Amicon Ultra, Millipore). Fluorescence was then measured in the 2 fractions as described above, with fractionated unlabeled mouse plasma serving as the background. Finally, the percentage of fluorescence in each fraction was calculated. Any fluorescence in the low–molecular weight fraction was interpreted as Alexa Fluor 647 that had become separated from insulin over the course of the experiment.
INS-647 photostability.
The rate of INS-647 photobleaching was measured in untreated glass capillary tubes on an LSM 780 laser scanning confocal microscope (Zeiss). INS-647 was imaged continuously for 5 minutes using a 633-nm HeNe laser with powers ranging from 348 to 435 μW. Image acquisition parameters (i.e., size, scan speed) were set to the same values as used during in vivo imaging experiments. Photomultiplier tube (PMT) gain and offset were set so that the histogram of intensity values was centered in the full dynamic range for each laser power. From images for each of the different laser powers, we calculated the exponential decay constant of intensity as a function of scan number (i.e., exposure time). We then calculated the percentage loss of fluorescence per scan as a function of laser power. Finally, we set a threshold of acceptable percentage loss of fluorescence to photobleaching (about 5%–8%) and then calculated the laser power necessary to stay below this level of photobleaching during an experiment.
Probe preparation and storage.
2,000,000-MW tetramethylrhodamine-dextran, 3,000-MW Alexa Fluor 680–dextran, 10,000-MW Alexa Fluor 647–dextran, and Alexa Fluor 647–BSA were all purchased from Life Technologies. Lyophilized INS-647 was solubilized in a buffer containing 16 mg/ml glycerol, 2 mg/ml m-cresol, 20 mM Tris-HCl, and 1% Triton X-100 to a final concentration of 1 mg/ml. This is similar to the buffer used in pharmaceutical insulin preparations, which maintains the stability and prevents aggregation of INS-647. All other probes were dissolved in sterile 0.9% injectable saline to a concentration of 10 mg/ml. All probes were mixed vigorously and sonicated in a water bath sonicator (Branson 2510) for 1 hour. Subsequently, probes were centrifuged for 20 minutes at 16,000 x g to remove any insoluble material. Finally, probes were visually inspected under a microscope to ensure that no aggregate structures were visible.
Gastrocnemius preparation.
Mice were first anesthetized with (7.9/1.6/0.2 mg/kg) KXA through an indwelling venous catheter and placed on a heating pad. After an appropriate depth of anesthesia was assured, hair was removed from the left leg with an electric razor. A small notch was made in the skin covering the lateral ankle. The skin was then removed from the lower leg to reveal the lateral gastrocnemius. Finally, the fascia covering the lateral gastrocnemius was carefully removed to uncover the fibers of the lateral gastrocnemius. Extensive care was taken to minimize perturbations to the muscle fibers and to avoid severing any blood vessels. After preparation of the lateral gastrocnemius, the mouse was transferred to the custom stage mount for subsequent imaging.
Custom stage mount construction.
Stage mounts were constructed with the lid of a standard plastic 96-well plate and a coverglass. Briefly, a rectangular opening was cut into the 96-well plate lid with a heated scalpel. Then, a 22 × 50 mm #1.5 coverglass (Thermo Fisher Scientific) was sealed on top of the rectangular opening using nail polish and silicone medical adhesive (Factor II Inc.). A 1- to 200-μl pipette tip was fixed onto the stage mount with the silicone adhesive to serve as a port for removing fluids off of the coverslip.
Physiological monitoring and maintenance.
Body temperature was measured with a rectal probe and maintained at 37°C using a feedback controller system connected to an electric blanket (Harvard Apparatus). To maintain the hydration and physiological stability of the exposed gastrocnemius, the tissue was continuously irrigated with a bicarbonate-buffered physiological saline solution (PSS) composed of (in mmol/l) 132 NaCl, 4.7 KCl, 2 MgSO4, 1.2 CaCl2, and 18 NaHCO3. This solution was maintained at 37°C and bubbled continuously with 95% N2/5% CO2 to maintain pH at 7.4. PSS was continuously circulated over the exposed tissue with a peristaltic pump (inflow) and a vacuum trap (outflow).
Selection of imaging region.
The quality of the gastrocnemius preparation was visualized using tissue autofluorescence. Light from a 120-W mercury arc lamp (XCite 120) was sent through a bandpass filter (Zeiss Filter Set 10; excitation: 450–490 nm; beam splitter: 510 nm; emission: 515–565 nm) onto the exposed gastrocnemius. With this filter, blood vessels were visible as dark structures against autofluorescence emanating from the tissue. First, we ensured that fibers were sufficiently exposed and that no hairs were in potential fields of view. After the quality of the preparation was ensured, 50 μg rho-dex was infused into the animal. The filter set was then switched (Zeiss Filter Set 43 HE; excitation: 550/25 nm; beam splitter: 570 nm; emission: BP 605/70) to visualize rho-dex fluorescence emanating from blood vessels. The field of view was selected from a capillary bed emanating from the external sural artery and based on the following criteria: (a) the presence of a sufficient number of clearly visible capillaries, (b) the absence of large vessels in the nearby area, and (c) the absence of capillaries immediately adjacent to one another.
Molecular efflux imaging.
All imaging was performed on an inverted Zeiss LSM 780 microscope (ZEN software) with a ×20 0.8NA Plan-Apochromat air objective. For imaging of transendothelial molecular efflux (INS-647, BSA-647, dextrans), rho-dex fluorescence was excited using light from a 561-nm solid-state laser and detected on a multichannel PMT. The near-infrared fluorophores were excited using a helium-neon 633-nm laser, and emitted light was detected using a GaAsP detector. For both rho-dex and the near-infrared fluorophores, excitation and emission light were passed through an MBS 488/561/633 dichroic mirror. A confocal pinhole was set to give an optical section of 8 μm (±4 μm about the focal plane). Imaging of the rho-dex and near-infrared fluorophores was performed using 2-channel sequential excitation and detection to prevent bleed-through. Switching between channels occurred every line to minimize channel mis-registration due to intrascan motion artifacts. Eight-bit-intensity, 1,024-by-1,024-pixel images were acquired with unidirectional scanning. For each time point, a 4-slice Z-stack was acquired in each channel using a step size of 4 μm to avoid aliasing. PMT settings were adjusted to maximize the dynamic range of the image and kept constant for each given experiment to allow for quantitative comparisons.
After the selection of an imaging region but before administration of the probes, a background image was acquired. Subsequently, INS-647, 3kDa-680, 10kDa-647, or BSA-647 was infused through the indwelling vein catheter and followed with a 20-μl pulse of saline. Images were then acquired using the procedure described above at t = 0, 1, 2, 3, 4, 5, 6, 7, 8, 9, 10, 12.5, 15, 20, and 30 minutes after probe injection. For mice receiving 2 U/kg INS-647, images were collected every minute for 15 minutes.
The image acquisition procedure for mice receiving 0.5 U/kg or 1 U/kg INS-647 was slightly modified in order to increase sensitivity. Namely, the laser power was doubled to image the low level of INS-647. In order to keep the total laser dose similar to that in the other INS-647 imaging experiments, we reduced the number of scans per experiment. To do this, we acquired only 2 slices per Z-stack and reduced the number of time points at which images were collected (t = 0, 1, 2, 3, 4, 5, 7.5, 10, 15 minutes after injection). Furthermore, the pixel dwell time for each scan was increased to enhance signal detection.
Image analysis.
Intravascular and extravascular spaces were segmented in raw images using a custom ImageJ (NIH) macro (available on request). A mask of vascular structures in the rho-dex channel was created using Otsu thresholding (24). This mask was then closed (dilation then erosion) and opened (erosion then dilation) with mathematical morphometric techniques. We then applied a median filter (radius = 4 pixels) to remove any remaining noise. Object recognition was then performed with the ImageJ Particle Analyzer to select vessel structures that were larger than 50 μm2 in area and had circularity from 0 to 0.5. The final mask of these vascular structures was then applied to the INS-647 channel to measure the intravascular intensity of INS-647. The mask was then dilated in steps of 0.5 μm out to 3 μm from the capillary wall to segment the interstitial spaces immediately adjacent to the capillary. The intensity of INS-647 was then measured in all of these extravascular segments. The contribution of INS-647 from multiple vessels to a single interstitial segment was avoided by (a) imaging of regions in which capillaries were not immediately adjacent to one another (i.e., >15 μm apart in most cases) and (b) restriction of analysis of the interstitial space to 3 μm from the capillary.
Following the extraction of intravascular and extravascular INS-647 intensity versus time profiles, a number of postprocessing steps were performed. First, data were background-subtracted using intensity values from background images collected during imaging experiments. Subsequently, the loss of fluorescence due to photobleaching was corrected for each scan in the interstitial spaces. We chose not to correct the intravascular space for photobleaching because intravascular INS-647 is circulating through the capillary blood stream and therefore most likely does not reside in the field of view long enough to undergo significant bleaching. The intensities from the 4 slices of the Z-stack were averaged to give a single value at each point in time and space. At this point, the contribution of free Alexa Fluor 647 to the observed kinetics of INS-647 was subtracted assuming that 10% of observed fluorescence kinetics was due to free Alexa Fluor 647 (Supplemental Figure 4D). Importantly, neither the photobleaching nor the free Alexa Fluor 647 corrections had a detectable effect on subsequent calculations. At the end of image processing, we obtained a 3D matrix describing the intensity of a given probe as a function of time after injection and distance from the capillary wall. These matrices were then used for endothelial transport parameter estimation as described below.
Mathematical modeling.
To model molecular efflux kinetics, we initially assumed that probes move through the interstitial space by diffusion. Therefore, as a base model we used the diffusion equation, a second-order partial differential equation, to describe the movement of probes through the interstitial space (Equation 1). While movement of INS-647 in the interstitial space occurs in 3 dimensions, we restricted our analysis and subsequent modeling to 1 dimension. We chose to make this dimensional reduction because it is not technically feasible to precisely measure the movement of INS-647 in the z plane in a live animal. Therefore, we assume that the transport parameters governing INS-647 movement in 1 dimension generalize or extend to 3 dimensions. We also assumed that probes are removed from the interstitial space by a first-order, concentration-dependent process (Equation 1). The initial condition (IC) and boundary conditions (BC) to the diffusion equation are as follows: (IC) Before administration of the INS-647 bolus (i.e., t = 0), INS-647 intensity is 0 for all x. (BC1) At points infinitely far from the capillary wall, INS-647 intensity is 0 for all t. (BC2) The boundary condition describing movement of INS-647 from the plasma into the interstitial space was set to either (a) the modified Fick equation to describe diffusion (Equation 2A), (b) an equation describing fluid-phase transport (Equation 2B), or (c) the Michaelis-Menten equation (Equation 2C). The diffusion equation (Equation 1) was solved with the aforementioned boundary and initial conditions using Laplace transforms (47) to give equations describing either diffusion (Equation 3A), fluid-phase transport (Equation 3B), or saturable transport (Equation 3C) across the endothelium. The inputs to the equation are the independent variables x and t, the plasma INS-647 intensity as a function of time cp(t), and the adjustable parameters D, k, and P (diffusion model); D, k, and kL (fluid-phase transport model); D, k, kL, and P (diffusion-fluid-phase transport model); or D, k, Vmax, and Km (Michaelis-Menten model).
(Equation 1)
(Equations 2A–2C)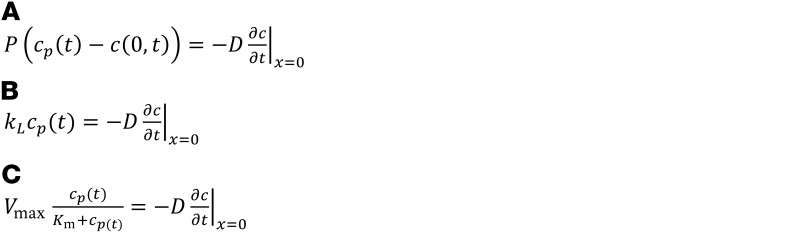
(Equations 3A–3C)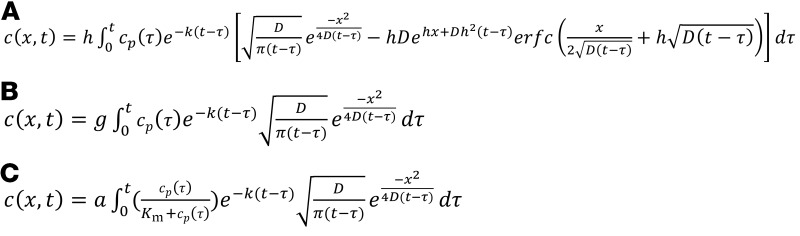
where c = INS-647 intensity, t = time, D = interstitial diffusion coefficient, x = distance from the capillary, k = interstitial removal constant, P = permeability, kL = the fluid-phase mass transfer coefficient, cp(t) = plasma INS-647 intensity as a function of time, c(0,t) = the interstitial INS-647 intensity immediately adjacent to the abluminal side of the capillary wall, Vmax = the maximum rate of reaction, Km = the concentration of substrate at half Vmax, h = P/D, g = kL/D, a = Vmax/D, and t – τ = the convolution integral time shift.
To estimate these adjustable parameters, INS-647 intensity profiles were simulated from Equations 3A–3C. Parameters were estimated by minimizing of the weighted sum of squared residuals (WSSR) between simulated and experimental measurements. Weighting was performed by division of residuals by the inverse of the intragroup standard deviation of intensity at each point in space and time. The effect of this scheme was to give more weight to the residuals at points where the confidence in the measurement was higher (i.e., low standard deviation) and vice versa. A multistart approach was used to generate random initial parameter estimates. A trust-region-reflective search algorithm was then used to minimize the WSSR by adjusting the parameters. Goodness of fit between experimental and simulated measurements was determined by several analyses including the sum of squares of the weighted residuals and visual analysis of the residuals. Goodness of fit was deemed to be acceptable if the WSSR fell within the 95% confidence interval of the χ2 distribution for a certain number of degrees of freedom. Parameter estimation and goodness-of-fit analyses were performed using custom MATLAB (MathWorks) scripts and functions (available upon request).
In vivo imaging of capillary leukocyte and platelet adhesion.
The gastrocnemius preparation for in vivo imaging was performed as described above. Rhodamine 6G (0.2 mg/kg; Sigma-Aldrich) was injected into mice and allowed to circulate for 5 minutes to accumulate in leukocytes (48). At this time, images were acquired to determine the basal level of capillary leukocyte adhesion. Rhodamine 6G fluorescence was excited with light from a 514-nm argon laser passed through an MBS 458/514 dichroic beam splitter. Emitted light was passed through an open pinhole (145 μm) and detected with a multichannel PMT. 512-by-512-pixel single-plane images were acquired at 8-bit intensity depth using unidirectional scanning. Images were acquired continuously for a period of 2.61 minutes. To test whether the laser illumination caused an increase in leukocyte adhesion, the gastrocnemius was either illuminated using the same scheme as during INS-647 imaging or not illuminated at all. Subsequently, a second round of rhodamine 6G imaging was performed as described above. Rhodamine 6G+ structures were labeled leukocytes if they were greater than 8 μm in diameter and platelets if they were less than 5 μm in diameter. Leukocytes and platelets were deemed “adherent” if they remained in the same location along the vessel wall for more than 30 seconds (49).
Efficiency of rhodamine 6G labeling of leukocytes.
To determine the efficiency with which circulating blood cells were labeled by rhodamine 6G in vivo, anesthetized mice were injected with 0.2 mg/kg rhodamine 6G through an indwelling jugular vein catheter. Blood samples were collected from an indwelling arterial catheter before and 5 and 30 minutes after rhodamine 6G injection. Red blood cells were lysed with ACK lysis buffer (K·D Medical). After a wash step with cold FACS buffer (PBS, 1% FBS, 2 mM EDTA), the remaining leukocytes were incubated in an anti-CD45 Alexa Fluor 647 antibody (2.5 μg/ml; BioLegend, catalog 103123, Clone 30-F11) for 30 minutes at room temperature. Cells were then washed twice and resuspended in cold FACS buffer containing 0.2 μg/ml DAPI. Appropriate single-color controls were also prepared (unstained, DAPI, rhodamine 6G, Alexa Fluor 647 only). Samples were injected into a 5-laser BD LSRII flow cytometer following daily Cytometer Setup and Tracking quality control. Samples were analyzed using FACS DiVa software version 8.
Phototoxicity.
To determine whether the light exposure dose affected the efflux kinetics of INS-647, an experiment was performed in which images were only acquired at t = 0 and 30 minutes, thereby reducing the laser dose by approximately 87%. The fractional distribution of INS-647 in the intravascular and extravascular spaces was then measured at t = 30 minutes under normal INS-647 conditions and under the reduced light exposure conditions.
S961 experiment.
To test whether INS-647 traverses the endothelium by a receptor-mediated process, mice were treated with 168 nmol/kg of S961 (Phoenix Pharmaceuticals), a peptide antagonist of the insulin receptor, 10 minutes before the start of INS-647 imaging. A bolus of 13 μCi of 2[14C]DG was then given in conjunction with INS-647 to determine the effects of S961 on SkM glucose uptake.
Statistics.
Outliers were detected by Grubbs’ test (GraphPad) and subsequently removed. All data were presented as mean ± SEM, unless otherwise specified. Statistical analyses were performed using Prism (version 7.0, GraphPad). Statistical significance was defined as a 2-tailed P value less than 0.05. Comparisons between groups were performed using either unpaired Student’s t tests or ANOVA with Tukey’s post hoc test or Bonferroni correction for multiple comparisons.
Study approval.
The Vanderbilt Institutional Animal Care and Use Committee approved all animal procedures.
Author contributions
The project was conceived by IMW, KSW, and DHW. Experiments were designed by IMW, ARM, JDY, DR, KSW, and DHW. Experiments were performed by IMW, FAV, and SDK. The manuscript was written by IMW and DHW. Manuscript edits and discussions were contributed by FAV, SDK, ARM, JDY, DR, and KSW.
Supplementary Material
Acknowledgments
The authors thank D. Bracy and F. James for performing catheterization surgeries; R. Mernaugh for his assistance with fluorescent probe characterization and handling; K. Weller and D. Flaherty for assistance with flow cytometry analysis of leukocytes; P. McClatchey for his helpful discussions regarding image segmentation; W. Calcutt for his assistance with HPLC–mass spectrometry analysis of fluorescent probes; and C. Webb for his initial intravital microscopy experiments. The authors gratefully acknowledge the use of services provided by the Vanderbilt Cell Imaging Shared Resource, Mouse Metabolic Phenotyping Center, Flow Cytometry Core, Hormone Assay Core, and Mass Spectrometry Research Center. This work was supported by NIH grants R01DK054902 and U24DK059637 to DHW; F31DK109594 to IMW; and T32DK007563 to IMW. The Diabetes Research Training Center is also acknowledged (DK020593).
Version 1. 01/08/2018
Electronic publication
Version 2. 02/01/2018
Print issue publication
Footnotes
Conflict of interest: While this study was being conducted, F.A. Valenzuela, S.D. Kahl, and A.R. Mezo were employees and shareholders of Eli Lilly and Co., a pharmaceutical company.
Reference information: J Clin Invest. 2018;128(2):699–714.https://doi.org/10.1172/JCI94053.
Contributor Information
Doraiswami Ramkrishna, Email: ramkrish@ecn.purdue.edu.
David H. Wasserman, Email: david.wasserman@vanderbilt.edu.
References
- 1.Mehta D, Malik AB. Signaling mechanisms regulating endothelial permeability. Physiol Rev. 2006;86(1):279–367. doi: 10.1152/physrev.00012.2005. [DOI] [PubMed] [Google Scholar]
- 2.Kolka CM, Bergman RN. The barrier within: endothelial transport of hormones. Physiology (Bethesda) 2012;27(4):237–247. doi: 10.1152/physiol.00012.2012. [DOI] [PMC free article] [PubMed] [Google Scholar]
- 3.Barrett EJ, Wang H, Upchurch CT, Liu Z. Insulin regulates its own delivery to skeletal muscle by feed-forward actions on the vasculature. Am J Physiol Endocrinol Metab. 2011;301(2):E252–E263. doi: 10.1152/ajpendo.00186.2011. [DOI] [PMC free article] [PubMed] [Google Scholar]
- 4.Meijer RI, Gray SM, Aylor KW, Barrett EJ. Pathways for insulin access to the brain: the role of the microvascular endothelial cell. Am J Physiol Heart Circ Physiol. 2016;311(5):H1132–H1138. doi: 10.1152/ajpheart.00081.2016. [DOI] [PMC free article] [PubMed] [Google Scholar]
- 5.Yang YJ, Hope ID, Ader M, Bergman RN. Insulin transport across capillaries is rate limiting for insulin action in dogs. J Clin Invest. 1989;84(5):1620–1628. doi: 10.1172/JCI114339. [DOI] [PMC free article] [PubMed] [Google Scholar]
- 6.Broussard JL, et al. Insulin access to skeletal muscle is impaired during the early stages of diet-induced obesity. Obesity (Silver Spring) 2016;24(9):1922–1928. doi: 10.1002/oby.21562. [DOI] [PMC free article] [PubMed] [Google Scholar]
- 7.Kubota T, et al. Impaired insulin signaling in endothelial cells reduces insulin-induced glucose uptake by skeletal muscle. Cell Metab. 2011;13(3):294–307. doi: 10.1016/j.cmet.2011.01.018. [DOI] [PubMed] [Google Scholar]
- 8.Sjöstrand M, Gudbjörnsdottir S, Holmäng A, Lönn L, Strindberg L, Lönnroth P. Delayed transcapillary transport of insulin to muscle interstitial fluid in obese subjects. Diabetes. 2002;51(9):2742–2748. doi: 10.2337/diabetes.51.9.2742. [DOI] [PubMed] [Google Scholar]
- 9.King GL, Johnson SM. Receptor-mediated transport of insulin across endothelial cells. Science. 1985;227(4694):1583–1586. doi: 10.1126/science.3883490. [DOI] [PubMed] [Google Scholar]
- 10.Majumdar S, Genders AJ, Inyard AC, Frison V, Barrett EJ. Insulin entry into muscle involves a saturable process in the vascular endothelium. Diabetologia. 2012;55(2):450–456. doi: 10.1007/s00125-011-2343-x. [DOI] [PMC free article] [PubMed] [Google Scholar]
- 11.Wang H, Liu Z, Li G, Barrett EJ. The vascular endothelial cell mediates insulin transport into skeletal muscle. Am J Physiol Endocrinol Metab. 2006;291(2):E323–E332. doi: 10.1152/ajpendo.00047.2006. [DOI] [PubMed] [Google Scholar]
- 12.Steil GM, Ader M, Moore DM, Rebrin K, Bergman RN. Transendothelial insulin transport is not saturable in vivo. No evidence for a receptor-mediated process. J Clin Invest. 1996;97(6):1497–1503. doi: 10.1172/JCI118572. [DOI] [PMC free article] [PubMed] [Google Scholar]
- 13.Vicent D, et al. The role of endothelial insulin signaling in the regulation of vascular tone and insulin resistance. J Clin Invest. 2003;111(9):1373–1380. doi: 10.1172/JCI15211. [DOI] [PMC free article] [PubMed] [Google Scholar]
- 14.Konishi M, et al. Endothelial insulin receptors differentially control insulin signaling kinetics in peripheral tissues and brain of mice. Proc Natl Acad Sci U S A. 2017;114(40):E8478–E8487. doi: 10.1073/pnas.1710625114. [DOI] [PMC free article] [PubMed] [Google Scholar]
- 15.Albelda SM, et al. Permeability characteristics of cultured endothelial cell monolayers. J Appl Physiol. 1988;64(1):308–322. doi: 10.1152/jappl.1988.64.1.308. [DOI] [PubMed] [Google Scholar]
- 16.Durr E, et al. Direct proteomic mapping of the lung microvascular endothelial cell surface in vivo and in cell culture. Nat Biotechnol. 2004;22(8):985–992. doi: 10.1038/nbt993. [DOI] [PubMed] [Google Scholar]
- 17.Hentz NG, Richardson JM, Sportsman JR, Daijo J, Sittampalam GS. Synthesis and characterization of insulin-fluorescein derivatives for bioanalytical applications. Anal Chem. 1997;69(24):4994–5000. doi: 10.1021/ac970726m. [DOI] [PubMed] [Google Scholar]
- 18.Chen AK, Cheng Z, Behlke MA, Tsourkas A. Assessing the sensitivity of commercially available fluorophores to the intracellular environment. Anal Chem. 2008;80(19):7437–7444. doi: 10.1021/ac8011347. [DOI] [PMC free article] [PubMed] [Google Scholar]
- 19.Berlier JE, et al. Quantitative comparison of long-wavelength Alexa Fluor dyes to Cy dyes: fluorescence of the dyes and their bioconjugates. J Histochem Cytochem. 2003;51(12):1699–1712. doi: 10.1177/002215540305101214. [DOI] [PubMed] [Google Scholar]
- 20.Bagher P, Segal SS. The mouse cremaster muscle preparation for intravital imaging of the microcirculation. J Vis Exp. 2011;52(52):2874. doi: 10.3791/2874. [DOI] [PMC free article] [PubMed] [Google Scholar]
- 21.Poole DC, Musch TI, Kindig CA. In vivo microvascular structural and functional consequences of muscle length changes. Am J Physiol. 1997;272(5 pt 2):H2107–H2114. doi: 10.1152/ajpheart.1997.272.5.H2107. [DOI] [PubMed] [Google Scholar]
- 22.Lee JF, et al. Balance of S1P1 and S1P2 signaling regulates peripheral microvascular permeability in rat cremaster muscle vasculature. Am J Physiol Heart Circ Physiol. 2009;296(1):H33–H42. doi: 10.1152/ajpheart.00097.2008. [DOI] [PMC free article] [PubMed] [Google Scholar]
- 23.Magidson V, Khodjakov A. Circumventing photodamage in live-cell microscopy. Methods Cell Biol. 2013;114:545–560. doi: 10.1016/B978-0-12-407761-4.00023-3. [DOI] [PMC free article] [PubMed] [Google Scholar]
- 24.Otsu N. A threshold selection method from gray-level histograms. IEEE Trans Syst Man Cybern. 1979;9(1):62–66. doi: 10.1109/TSMC.1979.4310076. [DOI] [Google Scholar]
- 25.Huxley VH, Curry FE, Adamson RH. Quantitative fluorescence microscopy on single capillaries: alpha-lactalbumin transport. Am J Physiol. 1987;252(1 pt 2):H188–H197. doi: 10.1152/ajpheart.1987.252.1.H188. [DOI] [PubMed] [Google Scholar]
- 26.Baxter LT, Jain RK. Transport of fluid and macromolecules in tumors. I. Role of interstitial pressure and convection. Microvasc Res. 1989;37(1):77–104. doi: 10.1016/0026-2862(89)90074-5. [DOI] [PubMed] [Google Scholar]
- 27.Schäffer L, et al. A novel high-affinity peptide antagonist to the insulin receptor. Biochem Biophys Res Commun. 2008;376(2):380–383. doi: 10.1016/j.bbrc.2008.08.151. [DOI] [PubMed] [Google Scholar]
- 28.Lieu ZZ, Gleeson PA. Endosome-to-Golgi transport pathways in physiological processes. Histol Histopathol. 2011;26(3):395–408. doi: 10.14670/HH-26.395. [DOI] [PubMed] [Google Scholar]
- 29.Sjöstrand M, Holmäng A, Lönnroth P. Measurement of interstitial insulin in human muscle. Am J Physiol. 1999;276(1 pt 1):E151–E154. doi: 10.1152/ajpendo.1999.276.1.E151. [DOI] [PubMed] [Google Scholar]
- 30.Yang YJ, Hope ID, Ader M, Bergman RN. Importance of transcapillary insulin transport to dynamics of insulin action after intravenous glucose. Am J Physiol. 1994;266(1 pt 1):E17–E25. doi: 10.1152/ajpendo.1994.266.1.E17. [DOI] [PubMed] [Google Scholar]
- 31.Lee WL, Klip A. Endothelial transcytosis of insulin: does it contribute to insulin resistance? Physiology (Bethesda) 2016;31(5):336–345. doi: 10.1152/physiol.00010.2016. [DOI] [PubMed] [Google Scholar]
- 32.Bendayan M, Rasio EA. Transport of insulin and albumin by the microvascular endothelium of the rete mirabile. J Cell Sci. 1996;109(pt 7):1857–1864. doi: 10.1242/jcs.109.7.1857. [DOI] [PubMed] [Google Scholar]
- 33.Wang H, Wang AX, Barrett EJ. Caveolin-1 is required for vascular endothelial insulin uptake. Am J Physiol Endocrinol Metab. 2011;300(1):E134–E144. doi: 10.1152/ajpendo.00498.2010. [DOI] [PMC free article] [PubMed] [Google Scholar]
- 34.Aird WC. Phenotypic heterogeneity of the endothelium: I. Structure, function, and mechanisms. Circ Res. 2007;100(2):158–173. doi: 10.1161/01.RES.0000255691.76142.4a. [DOI] [PubMed] [Google Scholar]
- 35.Azizi PM, et al. Clathrin-dependent entry and vesicle-mediated exocytosis define insulin transcytosis across microvascular endothelial cells. Mol Biol Cell. 2015;26(4):740–750. doi: 10.1091/mbc.E14-08-1307. [DOI] [PMC free article] [PubMed] [Google Scholar]
- 36.Laakso M, Edelman SV, Brechtel G, Baron AD. Decreased effect of insulin to stimulate skeletal muscle blood flow in obese man. A novel mechanism for insulin resistance. J Clin Invest. 1990;85(6):1844–1852. doi: 10.1172/JCI114644. [DOI] [PMC free article] [PubMed] [Google Scholar]
- 37.Rattigan S, Clark MG, Barrett EJ. Hemodynamic actions of insulin in rat skeletal muscle: evidence for capillary recruitment. Diabetes. 1997;46(9):1381–1388. doi: 10.2337/diab.46.9.1381. [DOI] [PubMed] [Google Scholar]
- 38.Vincent MA, et al. Skeletal muscle microvascular recruitment by physiological hyperinsulinemia precedes increases in total blood flow. Diabetes. 2002;51(1):42–48. doi: 10.2337/diabetes.51.1.42. [DOI] [PubMed] [Google Scholar]
- 39.Liu F, Kohn WD, Mayer JP. Site-specific fluorescein labeling of human insulin. J Pept Sci. 2012;18(5):336–341. doi: 10.1002/psc.2405. [DOI] [PubMed] [Google Scholar]
- 40.Kohn WD, et al. pI-shifted insulin analogs with extended in vivo time action and favorable receptor selectivity. Peptides. 2007;28(4):935–948. doi: 10.1016/j.peptides.2007.01.012. [DOI] [PubMed] [Google Scholar]
- 41.Ayala JE, et al. Hyperinsulinemic-euglycemic clamps in conscious, unrestrained mice. J Vis Exp. 2011;(57):3188. doi: 10.3791/3188. [DOI] [PMC free article] [PubMed] [Google Scholar]
- 42.Ayala JE, et al. Standard operating procedures for describing and performing metabolic tests of glucose homeostasis in mice. Dis Model Mech. 2010;3(9–10):525–534. doi: 10.1242/dmm.006239. [DOI] [PMC free article] [PubMed] [Google Scholar]
- 43.Kraegen EW, James DE, Jenkins AB, Chisholm DJ. Dose-response curves for in vivo insulin sensitivity in individual tissues in rats. Am J Physiol. 1985;248(3 pt 1):E353–E362. doi: 10.1152/ajpendo.1985.248.3.E353. [DOI] [PubMed] [Google Scholar]
- 44.Morgan CR, Lazarow A. Immunoassay of pancreatic and plasma insulin following alloxan injection of rats. Diabetes. 1965;14(10):669–671. doi: 10.2337/diab.14.10.669. [DOI] [PubMed] [Google Scholar]
- 45.Williams IM, Otero YF, Bracy DP, Wasserman DH, Biaggioni I, Arnold AC. Chronic angiotensin-(1-7) improves insulin sensitivity in high-fat fed mice independent of blood pressure. Hypertension. 2016;67(5):983–991. doi: 10.1161/HYPERTENSIONAHA.115.06935. [DOI] [PMC free article] [PubMed] [Google Scholar]
- 46.Steele R, Wall JS, De Bodo RC, Altszuler N. Measurement of size and turnover rate of body glucose pool by the isotope dilution method. Am J Physiol. 1956;187(1):15–24. doi: 10.1152/ajplegacy.1956.187.1.15. [DOI] [PubMed] [Google Scholar]
- 47. Crank J. The Mathematics Of Diffusion. Oxford, United Kingdom: Oxford University Press; 1975. [Google Scholar]
- 48.Baatz H, Steinbauer M, Harris AG, Krombach F. Kinetics of white blood cell staining by intravascular administration of rhodamine 6G. Int J Microcirc Clin Exp. 1995;15(2):85–91. doi: 10.1159/000178955. [DOI] [PubMed] [Google Scholar]
- 49.Mempel TR, Scimone ML, Mora JR, von Andrian UH. In vivo imaging of leukocyte trafficking in blood vessels and tissues. Curr Opin Immunol. 2004;16(4):406–417. doi: 10.1016/j.coi.2004.05.018. [DOI] [PubMed] [Google Scholar]
Associated Data
This section collects any data citations, data availability statements, or supplementary materials included in this article.