

Abstract
Objective
To provide guidance on selecting the most appropriate price index for adjusting health expenditures or costs for inflation.
Data Sources
Major price index series produced by federal statistical agencies.
Study Design
We compare the key characteristics of each index and develop suggestions on specific indexes to use in many common situations and general guidance in others.
Data Collection/Extraction Methods
Price series and methodological documentation were downloaded from federal websites and supplemented with literature scans.
Principal Findings
The gross domestic product implicit price deflator or the overall Personal Consumption Expenditures (PCE) index is preferable to the Consumer Price Index (CPI‐U) to adjust for general inflation, in most cases. The Personal Health Care (PHC) index or the PCE health‐by‐function index is generally preferred to adjust total medical expenditures for inflation. The CPI medical care index is preferred for the adjustment of consumer out‐of‐pocket expenditures for inflation. A new, experimental disease‐specific Medical Care Expenditure Index is now available to adjust payments for disease treatment episodes.
Conclusions
There is no single gold standard for adjusting health expenditures for inflation. Our discussion of best practices can help researchers select the index best suited to their study.
Keywords: Health care costs, expenditures, health care prices, inflation, cost‐of‐illness, cost‐effectiveness
Comparing health expenditures across years generally requires adjusting for inflation to dollars of equivalent purchasing power. However, researchers confront an array of available price indexes. Selecting the right index is not trivial and can have substantial effects on estimates and research findings. For instance, estimates could be quite different if one adjusts for economy‐wide inflation, rather than inflation specific to medical care. This paper seeks to provide guidance to health services researchers and economic evaluators on selecting the most appropriate price indexes for adjusting for inflation in studies involving health expenditures or costs from different years. A particular focus is on inflation‐adjusted estimates of condition‐specific costs for use in cost‐of‐illness and cost‐effectiveness studies. For example, what would it cost today to provide care for a person with a condition (e.g., spina bifida) for which historical data on health care use and expenditures have previously been analyzed (Grosse et al. 2016)?
Measures of Price Inflation
Inflation indexes differ in formulas, scope, and sources of data. The scope of which goods and services are included in price indexes is underappreciated as an explanation for differences in measures of inflation. Indexes of general price inflation can include all economic sectors, just consumption, or just consumption funded directly by households. Similarly, health care inflation indexes can encompass all health care goods and services or just those that are funded by specific payers.
The two major types of formulas used in inflation indexes are Laspeyres and Fisher. A Laspeyres price index is calculated as an arithmetic mean of a fixed bundle of goods and services, periodically adjusted to reflect changes in consumption and production patterns. Laspeyres indexes hold previous period quantities fixed and may not fully reflect changing consumption patterns. They tend to overstate inflation because people may substitute away from goods and services whose prices rise more rapidly (Braithwait 1980). A Fisher index is the geometric mean of a Laspeyres index that prices a fixed quantity in the base period, and a Paasche index that prices a fixed bundle of current‐period goods and services. By taking into consideration price changes for bundles of goods and services in the base period and current period, the Fisher index tends to reduce substitution bias (Landefeld and Parker 1997).
Another important price index concept is “chaining.” Rather than selecting a single base period, a chained index is formed by continually updating weights on the bundle of goods and services being priced. An advantage of chaining is that it reduces substitution bias by shifting items in the bundle as consumption patterns change.
General Inflation
Three major types of general price indexes are widely used (Table 1). The gross domestic product (GDP) implicit price deflator prepared by the Bureau of Economic Analysis (BEA) includes all sectors of economic activity: consumption, business investment, and public services. As with all BEA aggregate price indexes, the GDP implicit price deflator is a Fisher chain price index with the average change in prices weighted by the composition of products and service bundles at the beginning and end of each quarter (Chapter 4, NIPA Handbook). Two other price indexes focus on goods and services consumed by households, the Consumer Price Index (CPI) prepared by the Bureau of Labor Statistics (BLS) and the Personal Consumption Expenditures (PCE) price index prepared by BEA.
Table 1.
Summary of Major Price Indices
| Acronym | Name | Producer | Type | Coverage and Limitations | Appropriate Uses |
|---|---|---|---|---|---|
| General inflation | |||||
| GDP | Gross Domestic Product implicit price deflator | BEA | Fisher | Includes all sectors of economic activity including business investment and government expenditures. | Adjusting for purchasing power changes from societal perspective. |
| CPI‐U | Consumer Price Index—all urban consumers | BLS | Laspeyres | Excludes business investment and government spending, consumption paid on behalf of consumers by others (e.g., third‐party payers). Excludes rural consumers. | Adjusting for purchasing power changes in out‐of‐pocket only expenditures. |
| PCE | Personal Consumption Expenditure price index | BEA | Fisher chain | Excludes business and government investment. Includes consumption paid on behalf of consumers by others (e.g., third‐party payers). | Adjusting for purchasing power changes on personal consumption expenditures. |
| Medical inflation | |||||
| PHC | Personal Health Care price index | CMS | Fisher | Includes personal health expenditures (out‐of‐pocket and third‐party) only. Excludes government administration, net cost of insurance, noncommercial research, and private capital investment. Built from component CPI and PPI components. | Adjusting for general medical price changes. CMS NHE price index can be used if including administration, research, and capital investment. |
| PCE health | Personal Consumption Expenditure health component price index by function | BEA | Fisher | Includes personal health expenditures (out‐of‐pocket and third‐party) only. Excludes government administration, net cost of insurance, noncommercial research, and private capital investment. Built from component CPI and PPI components. | Adjusting for general medical price changes. Nearly identical to the PHC deflator. Contains more historical data than the PHC index. |
| MCPI | Consumer Price Index Medical Care component | BLS | Laspeyres | Includes consumer out‐of‐pocket expenditures, private plan, and Medicare Part B payments (other third‐party payments excluded). | Adjusting for out‐of‐pocket medical price changes. |
| Component medical cost inflation | |||||
| CPI component | Consumer Price Index (Prescription drugs, nonprescription drugs and supplies, professional services, hospital and related service) | BLS | Laspeyres | Includes consumer out‐of‐pocket expenditures private plan and Medicare Part B payments (other third‐party payments such as Medicare Part A and Medicaid excluded). | Adjusting for out‐of‐pocket medical price changes for specific services. |
| PPI component | Producer Price Index components | BLS | Laspeyres | Includes third‐party payments. | Adjusting for medical prices changes for specific services. |
BEA, Bureau of Economic Analysis; BLS, Bureau of Labor Statistics; CMS, Centers for Medicare and Medicaid Services; Laspeyres index = fixed basket, prior period weights (systematic upward bias); Paasche index = fixed basket, current period weights (systematic downward bias); Fisher chain index = geometric mean of Laspeyres & Paasche index.
The CPI for all urban consumers (CPI‐U) measures changes in prices for a bundle of 211 goods and services (e.g., breakfast cereal) in 38 geographic areas (Church 2016). It is calculated based on monthly surveys of retail establishments in 87 urban areas. The BLS estimates prices paid by consumers based on what establishments report (Song et al. 2009; BLS 2015a). The amounts reported by consumers are used to calculate weights for each good and service.
For most components, the traditional CPI is a Laspeyres index. The fixed bundle can overstate inflation, although that has diminished over time as the frequency of recalculation of weights has increased (Lebow and Rudd 2003). Since 2002, the composition of the market bundle used by BLS to estimate the regular CPI‐U has been updated every 2 years, with a 3‐year lag (McCully, Moyer, and Stewart 2007a). In addition, since 2002, BLS also publishes a “chained” CPI‐U, which is updated quarterly (BLS 2015b).
The PCE price index is a Fisher index that is formed using an identical method to the GDP deflator, but it excludes expenditures made by businesses, governments, and foreigners. The PCE also differs from the CPI in the scope of goods and services included (Triplett 1997; BEA 2010). In addition to spending by households, the PCE includes medical, education, religious, and welfare spending on behalf of households as well as the imputed value of services (Church 2016). About one‐quarter of PCE included in the PCE is excluded from the CPI, notably personal health care expenditures by employers and governments (e.g., Medicaid and Medicare Part A) (Clark 1999). Conversely, housing comprises roughly twice as large a share of the CPI than the PCE, which makes the CPI more sensitive to changes in housing prices.
Price changes in the fixed weight CPI have historically exceeded changes in the PCE price index, although differences have narrowed since 2002 (Meyer 2011). One reason for observed differences is the application of different formulas. Recall that the PCE applies a chained Fisher index, while the CPI applies a fixed‐bundle Laspeyres with weights updated biannually. The “formula effect” and the “weight effect” of different composition (e.g., housing) together largely account for the typically higher growth in the CPI (Hakkio 2008). Conversely, the “scope effect” of the exclusion of most medical services from the CPI lowers growth in the CPI relative to the PCE. The CPI is also more sensitive to swings in oil and natural gas prices (Ajmera, Kook, and Crilley 2012).
The PCE is now used by a variety of institutions, including the Board of Governors of the Federal Reserve System and the Congressional Budget Office (2014). In particular, the Federal Reserve uses the PCE excluding energy and food prices as its primary measure of core inflation in consumer prices (Fischer 2015).
The three measures give fairly similar estimates of price inflation in recent years, with the PCE and GDP deflators tracking each other most closely (see Figure 1, Table S1).
Figure 1.
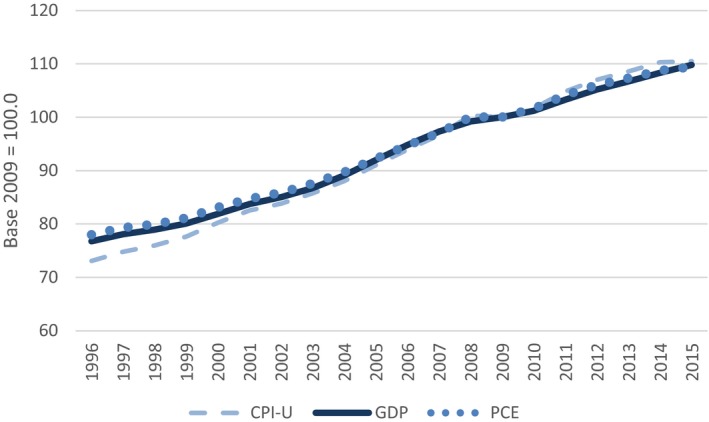
General Price Indices, 1996–2015
- Note. CPI‐U, Consumer Price Index—all urban consumers; GDP, gross domestic product; PCE, personal consumption expenditures. [Color figure can be viewed at wileyonlinelibrary.com]
Overall Medical Inflation
Three major medical price indexes are commonly used: the Personal Health Care (PHC) deflator, the PCE health‐by‐function index, and the Medical Care CPI (MCPI) (Table 1). The PHC deflator is calculated by the Centers for Medicare and Medicaid Services (CMS) as a price index for PHC spending, including hospital, physician and clinical, dental, other professional, home health care, nursing care, and other health, residential, and personal care services, as well as sales of retail medical products, for example, over‐the‐counter drugs (Bernard et al. 2012; Martin et al. 2016). Similar to BEA indexes, the PHC deflator is a Fisher price index (Hartman et al. 2013).
The PHC deflator uses sector‐specific Producer Price Index (PPI) estimates published by BLS (2015c) together with sector‐specific CPI estimates in some instances. The PPI estimates are calculated based on selling prices received by producers for goods and services sold to consumers, including medical care services paid by third‐party payers (Weinhagen 2014). CMS uses the PPI for hospitals, offices of physicians, medical and diagnostic laboratories, home health care services, and nursing care facilities; and uses CPIs for other professional services, dental services, personal care, prescription drugs, durable medical equipment, and nondurable medical products (CMS 2015).
An alternative to the PHC deflator is BEA's PCE health‐by‐function (PCE health) price index. The PCE health index is BEA's price index for health care consumption.1 Similar to the PHC, it draws underlying prices from the PPI and CPI. The PCE health index also includes expenditures by third‐party payers. Like the PHC and GDP deflator, the PCE health index is a chained Fisher index. There are some minor differences in the National Health Expenditure Accounts (NHEA) and BEA measures of health care consumption (Hartman et al. 2010). However, the PCE health index and the PHC index are formed similarly and are practically identical in value. The correlation in annual growth rates between 1996 and 2014 is over 97 percent and the total growth rate over this period is 59 percent for both indexes.
The overall medical care component of the CPI (MCPI) “covers only that part of healthcare commodities, services and health insurance premiums that consumers pay for ‘out of pocket’” (BLS 2015a). Like the overall CPI, the MCPI is a Laspeyres index.
BLS measures the MCPI as the weighted average of changes in transaction prices for medical care items—medications, professional services, hospital services, and health insurance—using consumer expenditures as expenditure weights. Average transaction prices as reported to BLS by sellers and providers include the sum of self‐payments and insurance payments from eligible payers. Because the CPI weights expenditures that consumers pay out‐of‐pocket, BLS only collects transaction prices that consumers typically pay out‐of‐pocket. For example, BLS collects information on hospital payments from private plans, but it does not collect information on Medicare Part A or Medicaid expenditures. The prices of hospital care used in the CPI in the past consisted mostly of charges (Catron and Murphy 1996). Since 2003, BLS has emphasized the collection of transaction prices and limited the use of hospital charges to self‐pay patients (BLS 2015a).
For a price index that covers health care spending more broadly defined, CMS reports National Health Expenditures (NHE) index, which includes PHC spending, government administration, net administrative and other costs of private and public health insurance plans, government public health activities, noncommercial biomedical research (commercial research is already implicitly included in PHC spending), and expenditures by health care establishments on structures and equipment (Heffler, Nuccio, and Freeland 2009; CMS 2015). The CMS Office of the Actuary makes available on an annual basis a chain‐weighted NHE deflator (Martin et al. 2016).
The indexes just mentioned are available from the websites of the corresponding organizations of the BEA, BLS, and CMS. In addition, the Agency for Healthcare Research and Quality on its Medical Expenditure Panel Survey (MEPS) website posts values of the various deflators.2
Component Medical Cost Inflation
Aggregate medical care price indexes are built from component indexes for specific health care goods and services. BLS produces a CPI for four specific categories of medical care expenditures from the perspective of the consumer's out‐of‐pocket price: prescription and nonprescription drugs, medical equipment and supplies, professional services, and hospital and related services, as well as several subcomponents.
BLS also produces PPI measures for specific types of medical care services (e.g., hospital or physician services) calculated from the provider perspective using actual transaction prices. The PPI incorporates price quotes for all types of payers (specifically, Medicare, Medicaid, third‐party private insurers, and uninsured consumers), weighted by their size.
There are important methodological differences between the PPI for medical care services and the CPI including the weights applied to each payer type (the CPI excludes Medicaid and Medicare Part A), substitution in the types of services provided, and the inclusion of ancillary services in the PPI but not in the CPI (Catron and Murphy 1996). These methodological differences lead to important differences in growth rates. For example, between 2002 and 2015, the CPI for hospital services rose by 115 percent, whereas the PPI for hospital services rose by 48.2 percent (Figure 2, Table S2). The component payer‐specific PPIs increased by 74.8 percent for private health plans, 39.9 percent for Medicare Part A, and 14.4 percent for Medicaid during this period. A major contributor to the more rapid growth in the hospital services CPI is the exclusion of Medicaid and Medicare Part A payments, which grew more slowly than private insurance reimbursements. The more rapid growth in the hospital services CPI, relative to the hospital PPI, may also reflect the relative importance of hospital charges from self‐pay patients in the CPI.
Figure 2.
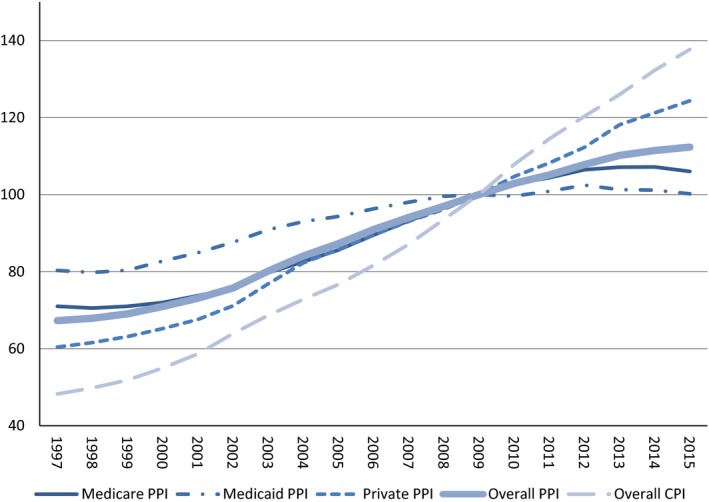
Hospital PPI and Hospital CPI
- Note. PPI, Producer Price Index; CPI, Consumer Price Index. [Color figure can be viewed at wileyonlinelibrary.com]
CMS also produces component measures of inflation in provider input costs (not shown in Table 1). The Medicare Hospital Inpatient Prospective Payment System market basket measures the relative proportions of all hospital input costs and combines them with estimates of wage inflation and PPI measures for most nonlabor inputs to calculate weighted changes in hospital prices. The Medicare Economic Index is a similarly constructed index of physicians’ input costs. National Institutes of Health economists, for example, used these to adjust Medicare cancer cost estimates for inflation separately for Part A and Part B expenditures (Mariotto et al. 2011).
Which Price Index to Apply?
One question to consider is whether any index should be applied. For some economic applications, we are actually interested in nominal expenditures. For instance, if we are calculating the share of economy‐wide expenditures devoted to health care, we would focus on nominal spending.
In most applications where there is a dollar‐value comparison across years, it is important for health expenditure analyses to use a measure of inflation to assure comparability of estimates. The first choice is whether to adjust for general price inflation or medical price inflation. The choice depends on the purpose of the analysis. Cost‐of‐illness (COI) analyses of the economic burden of diseases and cost‐effectiveness analyses (CEAs) of the value of interventions can have multiple intended uses. A general price index is most appropriate in comparing the social value of interventions across health and nonhealth sectors (Kokoski 2010). To compare the amount of societal resources expended in different periods (i.e., opportunity cost), the preferred index is the GDP implicit price deflator, which captures overall economic activity rather than consumer spending. However, if the purpose is to compare across time consumers’ out‐of‐pocket spending on health care services, either in aggregate or for specific services, the CPI‐U is the more appropriate index.
In COI and CEA studies, it is common practice to use medical cost or expenditure data from previous years to project expected medical costs for a current or more recent year. If the goal is to predict medical expenditures in 2016 based on 2010 expenditure data, an index of medical price inflation is appropriate. Similarly, if an analysis requires pooling multiple years of data to achieve sufficient power, a medical price index is appropriate to present estimates as representing a single year.
That leaves the question of which index of medical price inflation to use. COI and CEA studies usually employ either the societal or health care sector perspectives, and estimates are intended to reflect resource or opportunity costs. It is common practice to assume that average all‐payer reimbursements or expenditures are a proxy for underlying resource costs. It is essential here to use a price measure that captures information on expenditures by all payers. In this case, either the PCE health index or the PHC index would be the most appropriate. In contrast, analyses that are done from the payer or budget‐holder perspective should use a payer‐specific measure. For example, an analysis done from the perspective of a state Medicaid program that wishes to project the state's Medicaid costs should focus on Medicaid reimbursement rates, rather than focus on all‐payer price trends. The BLS reports payer‐specific PPIs for certain service categories, such as hospitals and, more recently, for physician services.
Prominent economists have long argued that exclusion of expenditures by third‐party payers in the MCPI makes it an incomplete and biased indicator of overall medical cost inflation that is unsuitable for most health economic evaluations (Berndt 2001; Newhouse 2001). As noted above, the hospital services CPI rose much faster than average reimbursements by third‐party payers, particularly Medicaid and Medicare.
The growth in the overall MCPI has outpaced the rate of U.S. medical inflation over the past two decades compared to the PHC and PCE, which capture payments from all payers (Figure 3, Table S3). The compound annual growth rate for the MCPI exceeded that of the PHC and PCE health indexes by about one percentage point per year, 3.7 percent versus 2.6 percent. The gap was larger before 2003, when BLS introduced major changes to CPI methods, but it remains sizeable. One important implication is that estimates of the growth in real medical expenditures are substantially larger using the PHC or PCE measures than using the MCPI. For example, real U.S. health spending from 1983 to 2014 increased by 87 percent when deflated using the MCPI and 138 percent when adjusted for inflation using the PCE health index.
Figure 3.
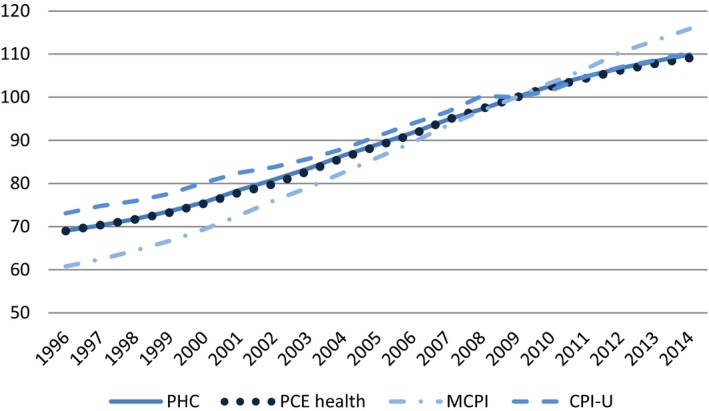
Medical Price Measures and CPI‐U, 1996–2014
- Notes. PHC and PCE Health indices track nearly identically. GDP, gross domestic product; PHC, Personal Health Care price index; PCE health, Personal Consumption Expenditures health component price index; MCPI, Consumer Price Index Medical Care component; CPI‐U, Consumer Price Index—all urban consumers. [Color figure can be viewed at wileyonlinelibrary.com]
The two alternatives to the MCPI as measures of aggregate medical price inflation, the PHC and PCE health, are interchangeable for practical purposes. The major advantage of the PCE index is that it is available online on an annual basis from 1929 onwards. The PCE health index measure is also part of a broader system of national accounts and can be compared across industries. The PHC deflator has the advantage of being based on the NHEA, which is often used by health researchers. For most applications, we suggest that researchers preparing COI or CEA estimates use either the PHC or PCE health measures to adjust overall medical cost estimates for inflation because they reflect weighted trends in payments for all payers. Although the PHC or PCE indexes are more appropriate for most COI or CEA applications, the MCPI remains widely used in U.S. COI and CEA studies. For example, a manual search of articles in three leading field journals3 published during 2015 revealed that 7 of 10 articles that documented methods of adjustment of U.S. medical costs for inflation used the MCPI. In 1996, the first U.S. Panel on Cost‐Effectiveness in Health and Medicine recommended that researchers use the MCPI in adjusting medical costs from different years (Gold et al. 1996). However, using the MCPI to adjust total disease‐specific costs for inflation leads to overestimates of medical expenditures compared to adjusting with the PHC or PCE measures.
To illustrate, a published economic assessment of the impact of folic acid fortification in the United States calculated the avoided cost associated with reduction of live‐born cases of spina bifida (Grosse et al. 2016). The paper estimated a lifetime medical cost in 2014 U.S. dollars of $513,500 (rounded to nearest $500), based in part on an estimate in 2002 U.S. dollars (Waitzman, Romano, and Grosse 2005) adjusted using the PCE health index. If the MCPI had been used instead, lifetime medical cost per live‐born child with spina bifida would have been estimated as $573,000 and the estimated health care impact of the policy would have been 11 percent greater. The estimate using the MCPI is biased upward because the goal was to adjust total expenditures for inflation, not out‐of‐pocket expenditures.
Price Indexes by Category
Some researchers may be interested in indexes for specific goods and services in health care. For instance, to determine how the quantity of physician services has changed over time, a price index for physician services could be used to deflate physician expenditures. One option is to use the PPI price indexes that are also inputs in PCE health and PHC components. Parallel to the discussion above, the PPI component price indexes are typically the preferred indexes for adjusting total expenditures because they reflect trends in payments for all payers. However, there are important exceptions.
The component CPI indexes may be preferred to the component PPIs when the focus is on out‐of‐pocket expenditures. There are also instances where the PPI is not available historically, in particular, dental and other professional services categories. Finally, the CPI is preferred to the PPI for prescription drugs because of differences in how generic drug substitution is handled. Both indexes treat generic drugs as substitutes to their branded counterparts allowing for price reductions when generic drugs enter the market (BLS 2011). Not accounting for generic substitution would lead to upward biases (Berndt, Cockburn, and Griliches 1996; Griliches and Cockburn 1994). However, the PPI includes only domestically manufactured prescription drugs (excluding Puerto Rico), while the CPI includes all prescription drugs dispensed by pharmacies. The large share of generics produced abroad implies that lower prices from generic substitution will more often be reflected in the CPI than the PPI. This distinction has a measurable impact on these indexes, with the CPI for prescription drugs growing at an annual rate of 3.1 percent and the PPI growing at a rate of 5.3 percent between 2002 and 2012. The PCE health and PHC indexes both use the CPI index for pharmaceutical products.
The component price indexes for PHC and PCE health indexes are available on the BEA and CMS websites, respectively. Alternatively, one can download the component BLS price indexes, from which the PHC and PCE indexes are built, directly from the BLS website, which includes additional levels of detail, such as the hospital price indexes by payer type shown previously.
Disease‐Based Cost Indexes
Economists have advocated for the development of alternative indicators of medical inflation that reflect changes in the costs of treating episodes of disease rather than more traditional “goods‐and‐services” approach used in BLS price indexes (Berndt et al. 2001; Rosen and Cutler 2009; Aizcorbe et al. 2012). Such an approach was first proposed and tested by Scitovsky (1967). The rationale is that a patient is presumed to care more about the total cost of an episode than the price of a particular visit. An advantage of this approach is that it tracks the cost of treatment as services move across settings (e.g., inpatient to outpatient). Also, many economists believe disease‐based indexes may be more amenable to adjustments in quality, relative to more traditional indexes. This approach received renewed attention in the late 1990s with studies that found substantially lower rates of price growth compared with traditional measures of medical price inflation in single conditions, such as heart attacks, cataracts, and depression (Cutler et al. 1998; Frank, Berndt, and Busch 1999; Shapiro, Shapiro, and Wilcox 2001).
Many experts have advocated for statistics to be developed using a more comprehensive list of conditions (Berndt et al. 2001; Mackie and Schultze 2002; Wunderlich 2010). In response, studies were conducted to measure the cost of disease treatment using a “Medical Care Expenditure Index” (MCE) (Berndt et al. 2001). The MCE is an index of the cost of disease treatment over time, including insurers and consumers. It measures the average cost (or price times quantity) of treating an individual for a condition relative to the cost of treating that condition in a base period (e.g., heart attack in 2016 relative to 2009). The change in the cost of treatment is computed across numerous conditions, and price index formulas are used to arrive at an overall change.
Several papers have conducted studies measuring the cost of treatment over time using either MEPS data or claims data for a comprehensive list of medical conditions (e.g., Aizcorbe et al. 2013; Bradley 2013; Bradley et al. 2010; Rosen et al. 2013; Roehrig and Rousseau 2011; Starr, Dominiak, and Aizcorbe 2014; Aizcorbe and Nestoriak 2011; Dunn et al. 2013, 2014; Dunn, Leibman, and Shapiro 2015). BEA recently released a Health Care Satellite Account (HCSA) that reports spending and associated cost indexes by disease condition (Dunn, Rittmueller, and Whitmire 2015, 2016). National spending and price indexes by disease category 2000 to 2012 are available online (http://www.bea.gov/national/health_care_satellite_account.htm) and are updated annually. Although currently in the experimental stage, the account continues to be improved with additional research in this area.
The MCE may grow faster or slower than the PCE health index for three reasons. First, the growth rate of the MCE will differ from the PCE index as technologies shift across settings (e.g., from inpatient hospital to outpatient hospital). Second, the growth rates may differ if there is a shift in the utilization of services for that condition (e.g., from 15‐minute office visit to a surgical procedure performed in the office). Third, the growth rates may differ if individuals shift across plan types (e.g., from PPO to HMO). Dunn, Rittmueller, and Whitmire (2015) find that the MCE in the HCSA count grew by 4.1–4.4 percent per year between 2000 and 2010, compared to 3.1 percent per year for the official PCE health index. Most of this difference occurred early in the decade.
The faster growth rate in the MCE reported in the satellite account is consistent with findings from other studies covering a similar period (Roehrig and Rousseau 2011; Aizcorbe and Highfill 2015). However, Aizcorbe and Highfill (2015) show that the MCE may grow faster or slower than the PCE health index depending on the time period studied. For the 1980–1987 period, the change in medical inflation was similar across both measures, whereas between 1987 and 1996, growth in the weighted MCE was less than one‐half as fast as in the PCE deflator. Between 1996 and 2006, the relative trends reversed, and growth in the MCE was roughly twice as fast as in the PCE health index.
This discussion has focused primarily on the aggregate MCE index, but it is important to highlight that growth in the MCEs can differ markedly at the disease level. Rosen et al. (2013) found that 10 percent of the conditions account for 82.5 percent of spending growth based on commercial claims data from 2003 to 2007. Large differences in growth rates are also found at the disease‐category level using BEA's HCSA data.
Deflating by a disease‐based index is distinct from traditional medical price indexes. Deflating by a traditional index provides a comparable measure of the quantity of goods and services across time periods. Deflating by an MCE index provides a comparable measure of the quantity of patients treated for a condition (irrespective of the goods and services used). Whether an MCE is an appropriate deflator depends on the particular application. Those who want a deflator that allows for technologies and treatment patterns to change over time may prefer an MCE index. An MCE may be more appropriate for adjusting bundled payments, but it is likely inappropriate for adjusting fee‐for‐service reimbursement rates.
The estimates in BEA's experimental satellite account have several limitations. Currently, the BEA measure does not adjust for patient severity. Dunn, Rittmueller, and Whitmire (2015) find that severity adjustment would tend to reduce MCE inflation. The MCE index is currently produced with a 3‐year lag. Similar to most traditional price indexes, the MCE does not adjust for changes in quality.4
Conclusions
There is no single gold standard for adjusting health expenditures for inflation; the most appropriate deflator depends on the research question. However, it is possible to describe best practices. In particular, both the PHC deflator and PCE health index appear to provide the most appropriate measures of inflation in medical prices in the United States, both overall and as an average measure of inflation in disease‐specific treatment costs. Both measures reveal a rate of medical inflation that is approximately one percentage point per year lower than that calculated using the medical CPI. If the objective is to quantify the changes in average cost of treating patients rather than the prices of the services, MCE measures are more appropriate.
In summary, we offer the following suggestions to health services researchers:
To adjust health expenditures in terms of purchasing power, use the GDP implicit price deflator or overall PCE measure. The PCE measure is suitable for personal consumption. The GDP deflator is more appropriate for the societal perspective.
To adjust overall consumer out‐of‐pocket spending in terms of consumer purchasing power or out‐of‐pocket burden relative to income, the CPI‐U can be used.
To convert average expenditures to care for a specific disease for price changes from 1 year to a different year, either the PHC deflator or the PCE health index can be used. Because of exclusions of some payers in its weights, the MCPI may not be appropriate to adjust all‐payer expenditures or payments by employers, Medicaid, and Medicare Part A for medical inflation.
To convert average consumer out‐of‐pocket health care expenditures from 1 year to a different year, the MCPI can be used.
To adjust estimates of costs of inpatient services from different years, the PPI for inpatient services appears currently to be the best option.
Using the MCE as a deflator of expenditures provides a measure of the average cost for patients, rather than the average cost for specific services. Whether MCE is the more appropriate deflator depends on the researcher's particular application.
Supporting information
Appendix SA1: Author Matrix.
Table S1. Gross Domestic Product Implicit Price Deflator, Personal Consumption Expenditures Index, and Consumer Price Index for All Urban Consumers, 1996–2014 (2009 = 100).
Table S2. Hospital PPI Indexes and Hospital CPI Indexes (2009 = 100).
Table S3. Personal Health Care Deflator, Personal Consumption Expenditures Health Care Price Index, and Medical Care Consumer Price Index, 1996–2014 (2009 = 100).
Table S4. Comparison of Consumer Price Index for Hospital Services and Producer Price Index for Hospitals, 1997–2015 (2009 = 100).
Acknowledgments
Joint Acknowledgment/Disclosure Statement: A version of this paper was presented at the Eastern Economic Association conference, New York, NY, March 1, 2015. Helpful comments were received from Ana Aizcorbe, Brian Armour, Abay Getahun Asfaw, Derek Brown, Tim Bushnell, Jerry Donahoe, Jamison Pike, Steve Hill, Tom Selden, Steve Machlin, and Clarence Zuvekas. In particular, we appreciate thoughtful comments from John Bieler, Fahad Fahimullah, Kelley Katchadourian, Crystal Konny, and Ken Stewart of the Bureau of Labor Statistics; Kyle Brown, Jason Chute, and Brendan Leary of the Bureau of Economic Analysis; and Aaron Catlin, Micah Hartman, Stephen Heffler, and John Poisal of the Center for Medicare and Medicaid Services. We also thank two anonymous referees for helpful comments.
Disclosures: None.
Disclaimers: The findings and conclusions in this report are those of the authors and do not necessarily represent the official position of the Centers for Disease Control and Prevention, the Agency for Healthcare Research & Quality, or the Bureau of Economic Analysis.
Notes
The PCE health‐by‐function index should not be confused with the PCE index for health care services, which includes only medical care services and excludes pharmaceutical products. The PCE account is organized by function, rather than product, and groups medical care services and pharmaceutical products together within the PCE health‐by‐function category.
AHRQ (2014). Available at https://meps.ahrq.gov/about_meps/Price_Index.shtml
American Journal of Preventive Medicine, Health Services Research, and Medical Care
This is an important limitation because medical care quality has arguably improved greatly over the past several decades (Cutler and McClellan 2001). BLS does make limited quality adjustments in their hospital price index based on process measures from the hospital compare data, but the adjustments have only a minimal impact.
References
- AHRQ . 2014. “Using Appropriate Price Indices for Analyses of Health Care Expenditures or Income across Multiple Years” [accessed March 16, 2016]. Available at http://meps.ahrq.gov/mepsweb/about_meps/Price_Index.shtml
- Aizcorbe, A. , and Highfill T.. 2015. “Medical Care Expenditure Indexes for the US, 1980‐2006. Bureau of Economic Analysis.” No. 0121 [accessed March 16, 2016]. Available at http://www.bea.gov/papers/pdf/medical-care-expenditure-indexes-for-the-us-1980-2006.pdf
- Aizcorbe, A. , and Nestoriak N.. 2011. “Changing Mix of Medical Care Services: Stylized Facts and Implications for Price Indexes.” Journal of Health Economics 30 (3): 568–74. [DOI] [PubMed] [Google Scholar]
- Aizcorbe, A. , Liebman E., Pack S., Cutler D. M., Chernew M. E., and Rosen A. B.. 2012. “Measuring Health Care Costs of Individuals with Employer‐Sponsored Health Insurance in the US: A Comparison of Survey and Claims Data.” Statistical Journal of the International Association for Official Statistics 28 (1): 43–51. [DOI] [PMC free article] [PubMed] [Google Scholar]
- Aizcorbe, A. , Bradley R., Greenaway‐McGrevy R., Herauf B., Kane R., Liebman E., Pack S., and Rozental L.. 2013. “Alternative Price Indexes for Medical Care: Evidence from the MEPS Survey” [accessed March 16, 2016]. Available at http://citeseerx.ist.psu.edu/viewdoc/download?doi=10.1.1.399.8507&rep=rep1&type=pdf
- Ajmera, R. , Kook N., and Crilley J.. 2012. “Impact of Commodity Price Movements on CPI Inflation.” Monthly Labor Review April: 29–43. [Google Scholar]
- BEA . 2010. “What Accounts for the Differences in the PCE Price Index and the Consumer Price Index?” [accessed March 16, 2016]. Available at http://bea.gov/faq/index.cfm?faq_id=555
- Bernard, D. , Cowan C., Selden T., Cai L., Catlin A., and Heffler S.. 2012. “Reconciling Medical Expenditure Estimates from the MEPS and NHEA, 2007.” Medicare & Medicaid Research Review 2 (4): E1–19. [DOI] [PMC free article] [PubMed] [Google Scholar]
- Berndt, E. R. 2001. “Price Indexes for Medical Care Goods and Services: An Overview of Measurement Issues” In Medical Care Output and Productivity, edited by Cutler D. M. and Berndt E. R., pp. 141–98. Chicago, IL: University of Chicago Press. [Google Scholar]
- Berndt, E. R. , Cockburn I., and Griliches Z.. 1996. “Pharmaceutical Innovations and Market Dynamics: Tracking Effects on Price Indexes for Antidepressant Drugs.” Brookings Papers on Economic Activity: Microeconomics 2: 133–88. [Google Scholar]
- BLS . 2011. “The Pharmaceutical Industry: An Overview of CPI, PPI, and IPP Methodology” [accessed July 7, 2016]. Available at http://www.bls.gov/ppi/pharmpricescomparison.pdf
- BLS . 2015a. “The Consumer Price Index (updated 6/2015)” [accessed March 16, 2016]. Available at www.bls.gov/opub/hom/pdf/homch17.pdf
- BLS . 2015b. “CPI Detailed Report. Data for December 2014” [accessed March 16, 2016]. Available at http://www.bls.gov/cpi/cpid1412.pdf
- BLS . 2015c. “Producer Price Index” [accessed March 16, 2016]. Available at http://www.bls.gov/ppi/data.htm
- Bradley, R. 2013. “Feasible Methods to Estimate Disease Based Price Indexes.” Journal of Health Economics 32 (3): 504–14. [DOI] [PubMed] [Google Scholar]
- Bradley, R. , Cardenas E., Ginsburg D. H., Rozental L., and Velez F.. 2010. “Producing Disease‐Based Price Indexes.” Monthly Labor Review 133 (2): 20–8. [Google Scholar]
- Braithwait, S. D. 1980. “The Substitution Bias of the Laspeyres Price Index: An Analysis Using Estimated Cost‐of‐Living Indexes.” American Economic Review 70 (1): 64–77. [Google Scholar]
- Catron, B. , and Murphy B.. 1996. “Hospital Price Inflation: What Does the New PPI Tell Us?” Monthly Labor Review 119 (7): 124–31. [PubMed] [Google Scholar]
- Church, J. D. 2016. “Comparing the Consumer Price Index with the Gross Domestic Product Price Index and Gross Domestic Product Implicit Price Deflator.” Monthly Labor Review April. [Google Scholar]
- Clark, T. E. 1999. “A Comparison of the CPI and the PCE Price Index.” Federal Reserve Bank of Kansas City Economic Review 1999 (Third Quarter): 15–29. [Google Scholar]
- CMS . 2015. “National Health Expenditures Accounts: Methodology Paper, 2014, Definitions, Sources, and Methods” [accessed March 16, 2016]. Available at http://www.cms.gov/Research-Statistics-Data-and-Systems/Statistics-Trends-and-Reports/NationalHealthExpendData/downloads/dsm-14.pdf
- Congressional Budget Office . 2014. “The Distribution of Household Income and Federal Taxes, 2011” [accessed March 16, 2016]. Available at https://www.cbo.gov/publication/49440
- Cutler, D. M. , and McClellan M.. 2001. “Is Technological Change in Medicine Worth It?” Health Affairs 20 (5): 11–29. [DOI] [PubMed] [Google Scholar]
- Cutler, D. M. , McClellan M., Newhouse J. P., and Remler D.. 1998. “Are Medical Prices Declining? Evidence from Heart Attack Treatments.” Quarterly Journal of Economics 113 (4): 991–1024. [Google Scholar]
- Dunn, A. , Liebman E., and Shapiro A. H.. 2015. “Implications of Utilization Shifts on Medical‐Care Price Measurement.” Health Economics 24 (5): 539–57. [DOI] [PubMed] [Google Scholar]
- Dunn, A. , Rittmueller L., and Whitmire B.. 2015. “Introducing the New BEA Health Care Satellite Account.” Survey of Current Business 95 (1): 1–21. [Google Scholar]
- Dunn, A. , Rittmueller L., and Whitmire B.. 2016. “Health Care Spending Slowdown from 2000 to 2010 Was Driven by Lower Growth in Cost per Case, According to a New Data Source.” Health Affairs 35 (1): 132–40. [DOI] [PubMed] [Google Scholar]
- Dunn, A. , Liebman E., Pack S., and Shapiro A. H.. 2013. “Medical Care Price Indexes for Patients with Employer‐Provided Insurance: Nationally Representative Estimates from MarketScan Data.” Health Services Research 48 (3): 1173–90. [DOI] [PMC free article] [PubMed] [Google Scholar]
- Dunn, A. , Liebman, E. , Rittmuller L., and Shapiro A. H.. 2014. “Defining Disease Episodes and the Effects on the Components of Expenditure Growth.” Unpublished [accessed March 16, 2016]. Available at http://204.14.133.132/papers/pdf/definingdisease.pdf
- Fischer, S. 2015. “US Inflation Developments.” In Remarks at the Federal Reserve Bank of Kansas City Economic Policy Symposium, Jackson Hole, WY [accessed on August 27, 2016]. Available at http://www.federalreserve.gov/newsevents/speech/fischer20151112a.htm?version=meter+at+null&module=meter-Links&pgtype=article&contentId=&mediaId=&referrer=&priority=true&action=click&contentCollection=meter-links-click
- Frank, R. G. , Berndt E. R., and Busch S. H.. 1999. “Price Indexes for the Treatment of Depression” In Measuring the Prices of Medical Treatments, edited by Triplett J. E., pp. 72–102. Washington, DC: Brookings Institution Press; [accessed March 16, 2016]. Available at http://www.nber.org/papers/w6417 [Google Scholar]
- Gold M. R., Siegel J. E., Russell L. B., and Weinstein M. C. (eds). 1996. Cost‐Effectiveness in Health and Medicine. New York: Oxford University Press. [Google Scholar]
- Griliches, Z. , and Cockburn I.. 1994. “Generics and New Goods in Pharmaceutical Price Indexes.” American Economic Review 84 (5): 1213–32. [Google Scholar]
- Grosse, S. D. , Berry R. J., Tilford J. M., Kucik J. E., and Waitzman N. J.. 2016. “Retrospective Assessment of Cost Savings From Prevention: Folic Acid Fortification and Spina Bifida in the U.S.” American Journal of Preventive Medicine 50 (5 Suppl 1): S74–80. [DOI] [PMC free article] [PubMed] [Google Scholar]
- Hakkio, C. S. 2008. “PCE and CPI Inflation Differentials: Converting Inflation Forecasts.” Federal Reserve Bank of Kansas City Economic Review 51 (1): 52–3. [Google Scholar]
- Hartman, M. , Martin A., Nuccio O., Catlin A., and the National Health Expenditure Accounts Team . 2010. “Health Spending Growth at a Historic Low in 2008.” Health Affairs 29 (1): 147–55. [DOI] [PubMed] [Google Scholar]
- Hartman, M. , Martin A. B., Benson J., Catlin A., and the National Health Expenditure Accounts Team . 2013. “National Health Spending in 2011: Overall Growth Remains Low, But Some Payers and Services Show Signs of Acceleration.” Health Affairs 32 (1): 87–99. [DOI] [PubMed] [Google Scholar]
- Heffler, S. , Nuccio O., and Freeland M.. 2009. “An Overview of the NHEA with Implications for Cost Analysis Researchers.” Medical Care 47 (7 Suppl 1): S37–43. [DOI] [PubMed] [Google Scholar]
- Kokoski, M. 2010. “Getting Real: Price Deflation of Nominal Values.” Journal of Benefit‐Cost Analysis 1 (1): 1–11. [Google Scholar]
- Landefeld, J. S. , and Parker R. P.. 1997. “BEA's Chain Indexes, Time Series, and Measures of Long‐Term Economic Growth.” Survey of Current Business 77 (5): 58–68. [Google Scholar]
- Lebow, D. E. , and Rudd J. B.. 2003. “Measurement Error in the Consumer Price Index: Where Do We Stand?” Journal of Economic Literature 41 (1): 159–201. [Google Scholar]
- Mackie C., and Schultze C. L. (eds.). 2002. At What Price? Conceptualizing and Measuring Cost‐of‐Living Indexes. Washington, DC: National Academy Press. [Google Scholar]
- Mariotto, A. B. , Yabroff K. R., Shao Y., Feuer E. J., and Brown M. L.. 2011. “Projections of the Cost of Cancer Care in the United States: 2010‐2020.” Journal of the National Cancer Institute 103 (2): 117–28. [DOI] [PMC free article] [PubMed] [Google Scholar]
- Martin, A. B. , Hartman M., Benson J., Catlin A., and National Health Expenditure Accounts Team . 2016. “National Health Spending In 2014: Faster Growth Driven By Coverage Expansion and Prescription Drug Spending.” Health Affairs 35 (1): 150–60. [DOI] [PubMed] [Google Scholar]
- McCully, C. P. , Moyer B. C., and Stewart K. J.. 2007a. “Comparing the Consumer Price Index and the Personal Consumption Expenditures Price Index.” Survey of Current Business 87 (11): 26–33. [Google Scholar]
- McCully, C. P. , Moyer B. C., and Stewart K. J.. 2007b. “A Reconciliation between the Consumer Price Index and the Personal Consumption Expenditures Price Index” [accessed March 16, 2016]. Available at http://bea.gov/papers/pdf/cpi_pce.pdf
- Meyer, B. 2011. “What's Up with the Gap between the Core PCE and the Core CPI?” Federal Reserve Bank of Cleveland; [accessed March 16, 2016]. Available at https://www.clevelandfed.org/newsroom-and-events/publications/economic-trends/economic-trends-archives/2010-economic-trends/et-20101102-whats-up-with-the-gap-between-the-core-pce-and-the-core-cpi.aspx [Google Scholar]
- Newhouse, J. P. 2001. “Medical Care Price Indices: Problems and Opportunities/The Chung‐Hua Lectures.” NBER Working Paper No. 8168, March [accessed March 16, 2016]. Available at http://www.nber.org/papers/w8168
- Roehrig, C. S. , and Rousseau D. M.. 2011. “The Growth in Cost per Case Explains Far More of US Health Spending Increases Than Rising Disease Prevalence.” Health Affairs 30 (9): 1657–63. [DOI] [PubMed] [Google Scholar]
- Rosen, A. B. , and Cutler D. M.. 2009. “Challenges in Building Disease‐Based National Health Accounts.” Medical Care 47 (7 Suppl 1): S7–13. [DOI] [PMC free article] [PubMed] [Google Scholar]
- Rosen, A. B. , Aizcorbe A., Ryu A. J., Nestoriak N., Cutler D. M., and Chernew M. E.. 2013. “Policy Makers Will Need a Way to Update Bundled Payments that Reflects Highly Skewed Spending Growth of Various Care Episodes.” Health Affairs 32 (5): 944–51. [DOI] [PMC free article] [PubMed] [Google Scholar]
- Scitovsky, A. A. 1967. “Changes in Costs of Treatment of Selected Illnesses, 1951‐65.” American Economic Review 57 (5): 1182–95. [Google Scholar]
- Shapiro, I. , Shapiro M., and Wilcox D.. 2001. “Measuring the Value of Cataract Surgery” In Medical Care Output and Productivity, edited by Cutler D. M. and Berndt E. R., pp. 411–38. Chicago, IL: University of Chicago Press; [accessed March 16, 2016]. Available at http://www.nber.org/chapters/c7636.pdf [Google Scholar]
- Song, X. , Marder W., Houchens R., Conklin J. E., and Bradley R.. 2009. “Can a Disease Based Price Index Improve the Estimation of the Medical CPI?” In Price Index Concepts and Measurement, edited by Diewert W. E., Greenlees J. S., and Hulten C. R., pp. 329–72. Chicago, IL: University of Chicago Press; [accessed on March 16, 2016]. Available at http://www.nber.org/chapters/c5083.pdf [Google Scholar]
- Starr, M. , Dominiak L., and Aizcorbe A.. 2014. “Decomposing Growth in Spending Finds Annual Cost of Treatment Contributed Most to Spending Growth, 1980‐2006.” Health Affairs 33 (5): 823–31. [DOI] [PubMed] [Google Scholar]
- Triplett, J. E. 1997. “Measuring Consumption: The Post‐1973 Slowdown and the Research Issues.” Federal Reserve Bank of St. Louis Review 79 (3): 9–42. [Google Scholar]
- Waitzman, N. J. , Romano P. S., and Grosse S. D.. 2005. “Half‐Life of Cost of Illness Estimates: The Case of Spina Bifida” In Neural Tube Defects: From Origin to Treatment, edited by Wyszynski D. F., pp. 342–51. New York: Oxford University Press. [Google Scholar]
- Weinhagen, J. C. 2014. “Comparing New Final‐Demand Producer Price Indexes with other Government Price Indexes.” Monthly Labor Review January. [Google Scholar]
- Wunderlich, G. S. 2010. Improving Health Care Cost Projections for the Medicare Population: Summary of a Workshop. Washington, DC: National Academy Press. [PubMed] [Google Scholar]
Associated Data
This section collects any data citations, data availability statements, or supplementary materials included in this article.
Supplementary Materials
Appendix SA1: Author Matrix.
Table S1. Gross Domestic Product Implicit Price Deflator, Personal Consumption Expenditures Index, and Consumer Price Index for All Urban Consumers, 1996–2014 (2009 = 100).
Table S2. Hospital PPI Indexes and Hospital CPI Indexes (2009 = 100).
Table S3. Personal Health Care Deflator, Personal Consumption Expenditures Health Care Price Index, and Medical Care Consumer Price Index, 1996–2014 (2009 = 100).
Table S4. Comparison of Consumer Price Index for Hospital Services and Producer Price Index for Hospitals, 1997–2015 (2009 = 100).