Abstract
Background
It is widely assumed that the amount of alcohol in the blood reflects the amount of alcohol consumed. However, several factors in addition to amount of alcohol consumed can influence blood alcohol concentration (BAC). The current study examines the effect of alcohol dose, concentration, and volume on BAC in rats with a high alcohol drinking (HAD) phenotype.
Methods
Study one examined the relationship between the amount of alcohol consumed and BAC. Alcohol-naïve, male, HAD rats (N=7) were given access to alcohol for 2 hrs/day for 9 consecutive days with food and water ad libitum. Alcohol intake and BAC were measured at 30, 60, and 90 minutes after onset of access. Study two examined the effects of altering alcohol dose, concentration, and volume on BAC (as measured by area under the curve). Alcohol-naïve, male, HAD rats (N=39) were infused, via an intragastric cannulus, with 1.16, 2.44, or 3.38 g alcohol/kg BW, produced by varying alcohol volume while holding concentration constant or by holding volume constant while varying concentration. Other rats were infused with 10%, 15%, or 20% v/v alcohol solutions while holding dose constant.
Results
BAC was more strongly correlated with the ratio of alcohol intake (g/kg BW) to total fluid intake (mls) (R=0.85–0.97, p<0.05–p<0.001) than it was with the amount of alcohol consumed (g/kg BW) (R=0.70–0.81, p<0.05). No effect of alcohol dose was seen during the first hour following the onset of an alcohol infusion regardless of whether dose was achieved by altering alcohol volume or concentration. After one hour, higher alcohol doses were predictive of greater BACs.
Conclusion
The fact that a three-fold differences in alcohol dose did not result in significant differences in BACs during the first 30 minutes after ingestion of alcohol has potentially important implications for interpretation of studies that measure alcohol sensitive endpoints during this time.
Keywords: Blood Alcohol Concentration, Selectively Bred Rats, Alcohol Dose, Alcohol Concentration, Alcohol Volume
INTRODUCTION
A basic assumption that is made by the general public as well as by many scientists, healthcare professionals, law enforcement personnel, and the judiciary, is that the amount of alcohol in the blood directly reflects the amount of alcohol consumed. However, several factors in addition to the amount of alcohol consumed, such as the volume and concentration of alcohol, can influence blood alcohol concentration (BAC). A disconnect between the amount of alcohol consumed and the resulting BAC can be misleading in both human and animal studies. This became apparent in one of our recent studies, where we observed a non-linear relationship between BAC and alcohol intake (g/kw BW) when rats were given a concurrent free-choice between alcohol and water and BAC was determined throughout the drinking period. We suspected that the disconnect was due to the fact that animals that consume the same amount of alcohol, but varying amounts of water, differ in the concentration and volume of the alcohol solution in the stomach, which can result in different BACs (Haggard et al., 1941; Lolli and Rubin, 1943) because alcohol concentration affects the rate of alcohol absorption. Highly concentrated alcohol solutions (>30% v/v) tend to reduce gastric motility and lead to slower alcohol absorption (Bujanda, 2000; Erickson, 1979; Grahame and Grose, 2003; Haggard et al., 1941; Holt 1981; Roine et al., 1991). In addition, alcohol in the stomach increases hydrochloric acid release, which is mediated by histamine release from H cells, and hydrochloric acid further slows the absorption of alcohol (Aures et al., 1982; Lolli and Rubin, 1943). The longer alcohol remains in the stomach the slower the absorption becomes. Reduced gastric motility also delays gastric emptying into the small intestine, where most alcohol is absorbed (Berggren et al., 1940).
In addition to alcohol concentration, the volume of the alcohol solution in the stomach can also influence BAC. Drinking a large volume of alcohol will increase the contact area between alcohol and the mucosal lining of the stomach and the larger the contact area, the greater the absorption of alcohol and the higher the BAC (Borowitz et al., 1971). While some alcohol is absorbed in the stomach, the vast majority is absorbed in the small intestine (Haggard et al, 1941) and consumption of a large volume of alcohol increases distention of the stomach which stimulates gastric emptying into the small intestine (Ishiguchi et al., 2001; Shafik et al., 2007), which, in turn, results in increased surface area contact between alcohol and the lining of the small intestine thus increasing the rate of alcohol absorption and resulting in a higher BAC. Consequently, rats consuming the same amount of alcohol in g/kg BW may have different BACs as a function of both the volume and concentration of the alcohol consumed.
Another factor that influences BAC is the amount of food in the stomach because food slows the rate of alcohol absorption (Haggard et al., 1940; Roine et al., 2000). This well-known fact has led to a behavioral pattern in young adults called “drunkorexia” which refers to voluntarily restricting food and water intake prior to planned binge drinking episodes. This behavior has received considerable attention because the trend has been increasing across college campuses. The motivation for this behavior is at least two-fold. First, to accelerate and enhance the intoxicating effects of alcohol (Burke et al., 2010; Jones and Jonsson, 1994; Roosen and Mills, 2015), and second, to avoid weight gain by restricting caloric intake to compensate for the calories consumed in the form of alcohol (Barry and Piazza, 2012; Burke et al., 2010; Eisenberg and Fitz, 2014; Roosen and Mills, 2015).
Our research group has had a long-standing interest in factors that influence alcohol drinking. To facilitate research in this area, in the 1970s Drs. Li and Lumeng used a selective breeding approach to develop two rat lines, the alcohol-preferring or P and the high alcohol drinking or HAD lines, that are genetically predisposed toward very high voluntary consumption of alcohol (Li et al, 1979; 1988; 1994). These rat lines meet all of the criteria of an animal model of alcoholism (Cicero, 1979), and are considered to be one of the best rodent models of alcoholism currently available. They are used by scientists around the world to elucidate the physiologic and biochemical processes and pathways that underlie alcohol drinking and to identify pharmacotherapeutic agents that can reduce alcohol intake (for review see Bell et al., 2006; Froehlich and Li, 1993; Li et al.,1991; 1993; Mcbride et al., 2014; Murphy et al., 2002; O’Malley and Froehlich, 2003). Because these rats avidly consume alcohol, many of the experimental paradigms using these animals involve giving them concurrent access to both alcohol and water and measuring alcohol intake (g/kg BW) together with alcohol-sensitive physiologic, neurochemical or behavioral variables. An assumption that is often made is that the more alcohol that is consumed, the higher the BAC will be and the greater will be the level of alcohol exposure in the brain and the resulting effect on alcohol-sensitive variables. The current study examined whether this assumption is sound.
Experiment 1: ALCOHOL DRINKING AND BAC
Objective: To determine the relationship between BAC and alcohol intake during a 2-hr period of voluntary alcohol drinking with water freely available.
MATERIALS AND METHODS
Subjects
Seven male rats selectively bred for high voluntary alcohol drinking (High Alcohol Drinking or HAD rats) that were 56–76 days old and weighed 350g at the onset of the study served as subjects in experiment 1. Male rats were used in order to circumvent the known differences in alcohol preference and intake that occur during different stages of the rat estrous cycle (for review see Becker and Koob, 2016). Only one gender was used because male and female rats differ in the amount of alcohol they voluntarily consume (Becker and Koob, 2016; Priddy et al, 2017), and in parameters of the BAC response to an intragastric alcohol infusion (Crippens et al, 1999; Robinson et al, 2002). The rats were housed individually in stainless steel hanging cages in an isolated vivarium with controlled temperature (21±1°C) and a reversed 12 hour light-dark cycle (0830-2030). All experimental procedures were approved by the Indiana University Institutional Animal Care and Use Committee and were conducted in strict compliance with the NIH Guide for the Care and Use of Laboratory Animals.
Alcohol and Water Access
A 10% (v/v) alcohol solution was prepared by diluting 95% alcohol (Midwest Grain Co. Pekin, Il) with distilled, deionized water daily. Alcohol and water were presented in calibrated glass Richter tubes and the position of the tubes was rotated daily to prevent the potential effect of a positional preference. Rats were maintained with free access to food and water and scheduled access to 10% (v/v) alcohol solution for 2h/d (0900 to 1100 hours) for 9 consecutive days. Alcohol intake (grams alcohol/kg BW) and water intake (mls) were recorded at 30, 60, and 90 minutes during the 2-hour alcohol access on the last day of alcohol access.
BAC Determination
On day 9 of alcohol access, tail blood was collected at 30, 60, and 90 minutes after onset of alcohol access for BAC determination. A razor blade was used to cut approximately 2 mm from the distal end of the tail for blood collection. Bleeding stopped after sample collection and subsequent samples were collected by removing the coagulate, without additional cuts. Blood (150 ul) was collected in pre-chilled heparin-coated tubes and was centrifuged at 3000g for 10 minutes at 4°C. Plasma was extracted and frozen at −20°C for later determination of BAC by gas chromatography using a Hewlett Packard 5730A chromatograph and 6′ × 1/4″ OD × 2 mm ID glass columns packed with 1-1766 GP 60/80 Carbopack B, 15% Carbowax (Supelco Inc. Bellefonte, PA). 1.25 mg/ml of 2-Propanol (Fisher Scientific Fair Lawn, NJ) was used as an internal standard mixed 1:1 with the alcohol standards. BAC samples were run on each of two columns and the values were averaged for mean BAC.
DATA ANALYSIS
A linear regression analysis was used to estimate Pearson Product Coefficients between mean amounts of alcohol consumed (g/kg BW) and mean BAC at 30, 60, and 90 minutes after the onset of 2-hr alcohol access on day 9. Other linear regression analyses were used to estimate Pearson Product Coefficients between BAC and ratio of alcohol intake (g/kg BW) to total fluid intake (alcohol + water in mls) at 30, 60, and 90 minutes after the onset of 2-hr alcohol access on day 9. Data are presented as mean ± SE and significance was accepted at p<0.05, unless otherwise stated.
RESULTS
Study 1: Alcohol Drinking and BAC
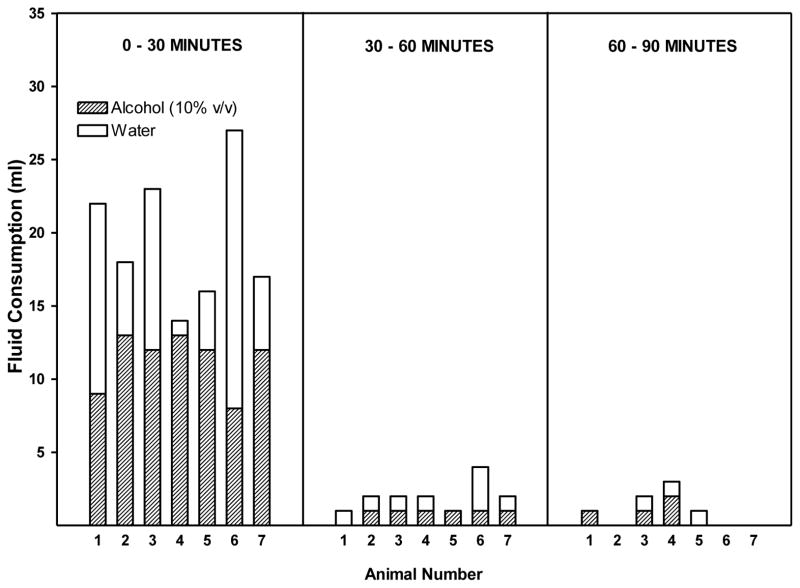
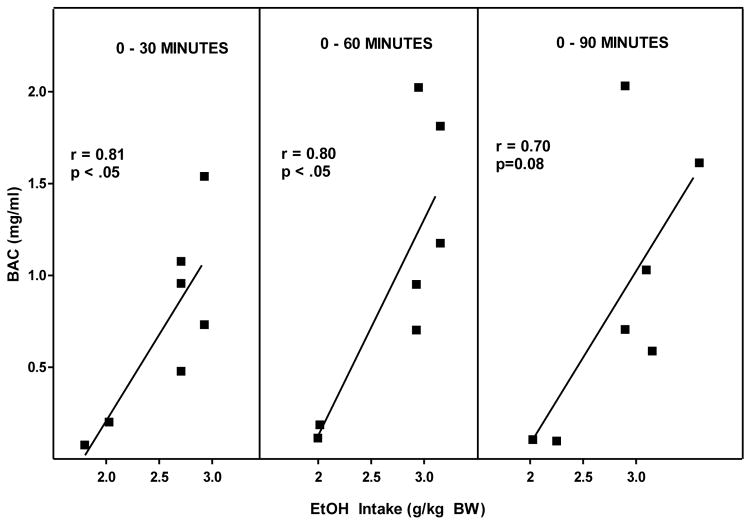
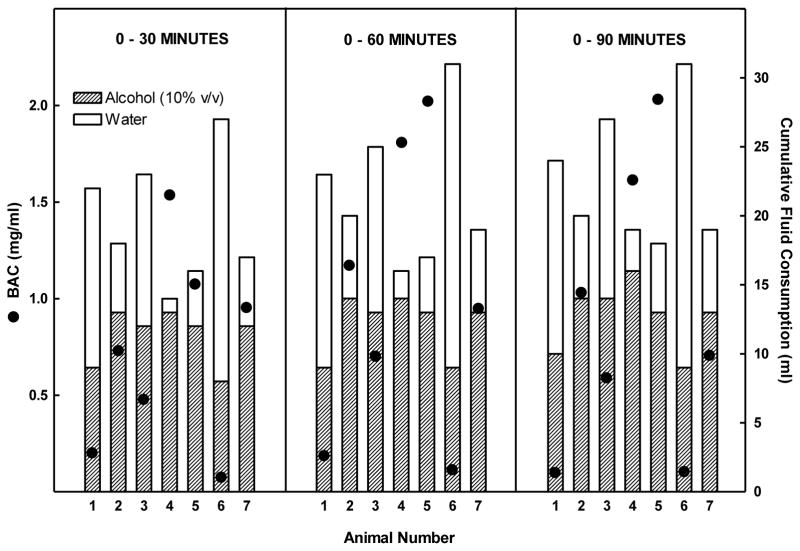
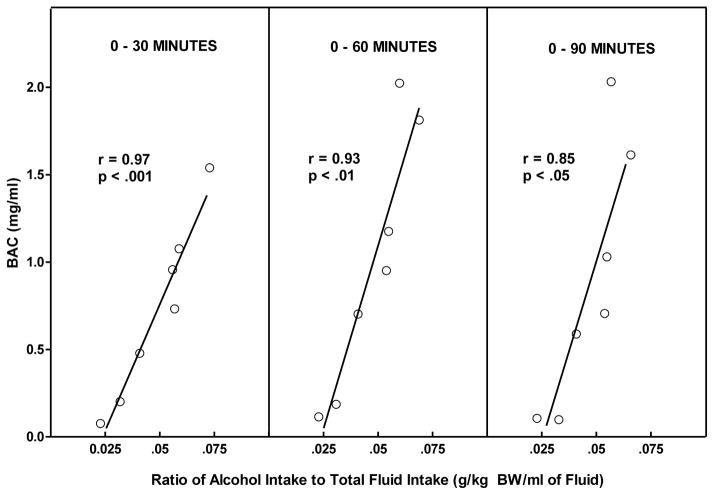
Rats consumed alcohol almost exclusively in the first 30 minutes of the 2 hr free-choice alcohol access period (Figure 1). Correlational analyses revealed that there was a significant strong positive correlation between alcohol intake (g/kg BW) and BAC at 30 minutes (r=0.81, r2=0.66; p<0.05), and 60 minutes (r= 0.80, r2=0.64; p<0.05), but not at 90 (r= 0.70, r2=0.49; p=0.08) (Figure 3). The largest discrepancy between the amount of alcohol consumed and the resulting BAC occurred at the highest level of alcohol intake (3.0 g/kg BW) (Figure 3). This is likely due to the amount of both alcohol and water that was consumed concomitantly. For instance, rats # 1 and 6 that drank the smallest amount of alcohol had the lowest BACs but also had the highest water intake so it isn’t clear whether the low BAC is due to low alcohol intake alone or also due to a dilution of the alcohol consume. Conversely, the highest levels of alcohol intake (g/kg) produced the highest BACs as seen in rats #4 and #5 (Figure 2) but also were accompanied by the lowest intake of water, and hence the least dilution of the alcohol consumed. This suggested the need to reanalyze the data focusing on BAC as a function of ratio of alcohol intake to total fluid intake. The effect of alcohol dilution was estimated for every animal by calculating the ratio of grams alcohol consumed/total fluid intake in mls and correlational analyses were performed between the alcohol ratio and the BAC (Figure 4). These analyses revealed that there was a significant strong positive correlation between alcohol ratio in the stomach and BAC at 30 minutes (R= 0.97, r2=0.94 p<.001), at 60 minutes (R= 0.93, r2=0.86, p < 0.01) and at 90 minutes (R= 0.85, r2=0.72, p < 0.05) (Figure 4). Given that the ratio of alcohol to total fluid intake (alcohol+water) was a better predictor of BAC than was simply the amount of alcohol consumed (g/kg BW), a second study was designed to determine the effect of altering alcohol concentration, or alcohol volume or alcohol dose on BAC.
Figure 1.
Alcohol and water intake in HAD rats given alcohol (10% v/v) and water ad libitum during daily 2-hr alcohol access. Alcohol and water intake were determined during the 0–30 minute, 30–60 minute, and 60–90 minute time intervals following the initiation of alcohol access.
Figure 3.
Measurements of BAC and alcohol intake at 30, 60, and 90 minutes following the onset of daily alcohol access was used to determine the correlation between BAC and alcohol intake (g/kg BW) of HAD rats given concurrent access to alcohol (10 %v/v) and water during daily 2-hr alcohol access.
Figure 2.
Alcohol and water intake in HAD rats given alcohol (10 %v/v) and water ad libitum during daily 2-hr alcohol access. BAC, and cumulative alcohol intake, and cumulative total fluid intake were determined for each animal at 30, 60, and 90 minutes following initiation of alcohol access.
Figure 4.
Measurements of BAC, alcohol intake, and water intake at 30, 60, and 90 minutes following the onset of daily alcohol access was used to determine the correlation between BAC and the ratio of alcohol intake to fluid intake (grams alcohol consumed/kg BW/total intake in mls) in the stomach of HAD rats given concurrent access to alcohol (10 %v/v) and water during daily 2-hr alcohol access.
Experiment 2: CHARACTERISTICS OF ALCOHOL THAT INFLUENCE BAC
Objective: To determine whether the concentration, volume, and/or dose of alcohol influence BAC over time.
MATERIALS AND METHODS
Subjects
Thirty-nine male, alcohol-naïve,HAD rats that were 56–70 days of age and weighed 300–384g at the onset of study served as subjects in experiment 2. Rats were housed individually in stainless steel hanging cages in an isolated vivarium with controlled temperature (21±1°C) and reversed 12 hour light-dark cycle with ad libitum access to rodent chow and water. Since the presence of food in the stomach can slow alcohol absorption (Lin et al., 1976) and water in the stomach can dilute alcohol that is either consumed or delivered IG, the amount of food and water in the stomach at the time of IG alcohol infusion was equated by removing food for 18 hours, and removing water for 5 hours before the onset of the infusion.
Assigning Rats to Groups
Rats were divided into nine dose groups (5–6/group) and counterbalanced based on weight so that the groups were relatively comparable in terms of the amount of alcohol infused since dose of alcohol was determined by animal weight. Cannula were implanted in each group of rats on a separate day and the alcohol infusions followed 2 days later with blood sampling occurring at timed intervals following onset of infusion.
Cannula Implantation and Alcohol Infusion
Animals were anaesthetized with Brevital (60mg/3ml/kg BW) and a permanent indwelling catheter was implanted as previously described (Smith et al., 1975). The free end of the cannulus was slid beneath the skin, was externalized at the back of the neck, and was sealed with a metal stylet. Rats were held for 2 days to recover from surgery. On post-surgical day 2 rats underwent intragastric (IG) infusion of an alcohol solution followed by subsequent BAC determination.
Alcohol Solutions
Alcohol solutions (5%, 10%, 15% or 20% v/v) were prepared by diluting 95% alcohol (Midwest Grain Co. Pekin, Il) with distilled, deionized water daily.
Alcohol Infusion
Study 2A determined the effect of alcohol dose and alcohol volume on BAC. Alcohol was infused over 3 minutes at 3 hrs following the onset of the dark portion of the light-dark cycle. Rats were infused with one of 3 doses of alcohol and each dose was produced by varying the volume of the alcohol solution infused while holding alcohol concentration constant at 10%.
In Study 2B determined the effect of alcohol dose and concentration on BAC. Alcohol was infused over 3 minutes at 3 hrs following the onset of the dark portion of the reverse light-dark cycle. Rats were infused with one of 3 doses of alcohol and dose was produced by varying the concentration of the alcohol solution while the volume of the solution was held constant at 10 mls.
In Study 2C (Effect of alcohol concentration and volume on BAC) alcohol was infused over 3 minutes at 3 hrs following the onset of the dark portion of the reverse light-dark cycle. Rats were infused with one of 3 concentrations of alcohol which were achieved by varying the volume of the alcohol solution with alcohol dose held constant at 3.38 grams alcohol/kg BW.Lower concentrations of alcohol (e.g. 5%) were not examined because an excessive fluid volume would have been required to produce a dose of 3.38 g/kg BW, which would result in gastric distension and would likely alter the physiological parameters of gastric emptying (Murphy et al., 1986; Froehlich et al., 1988).
Sample Collection and BAC Determination
Blood was collected from the tip of the tail for BAC determination. A razor blade was used to cut approximately 2 mm from the distal end of the tail and 150 μl of blood was collected at 30, 60, 90 120, 150, 180, and 240 minutes after onset of alcohol infusion. Bleeding stopped after sample collection and subsequent samples were collected by removing the coagulate, without additional cuts. Blood was collected in pre-chilled heparin-coated tubes and was centrifuged at 3000g for 10 minutes at 4°C. Plasma was extracted and frozen at −20°C for later determination of BAC by gas chromatography using a Hewlett Packard 5730A chromatograph and 6′ × 1/4″ OD × 2 mm ID glass columns packed with 1–1766 GP 60/80 Carbopack B, 15% Carbowax (Supelco Inc. Bellefonte, PA). 1.25 mg/ml of 2-Propanol (Fisher Scientific Fair Lawn, NJ) was used as an internal standard mixed 1:1 with the alcohol standards.
DATA ANALYSIS
Blood alcohol content (BAC) was converted to area under the curve (AUC) by the linear trapezoidal method from the time of onset of the alcohol infusion until 240 minutes after onset of the infusion. The effects of alcohol concentration, volume, and dose on AUC at 0–30 minutes, 0–60 minutes and 0–90 minutes were analyzing three separate two-way repeated measures ANOVAs with dose (with varying volume) × time, with dose (with varying concentration) × time, and with concentration (with varying volume) × time with repeated measures on time. Fishers least significant difference (LSD) pairwise multiple comparisons were used to further investigate significant effects. Data are presented as mean ± SE and significance was accepted at p<0.05, unless otherwise stated.
RESULTS
Study 2A (Effect of alcohol dose and volume on BAC)
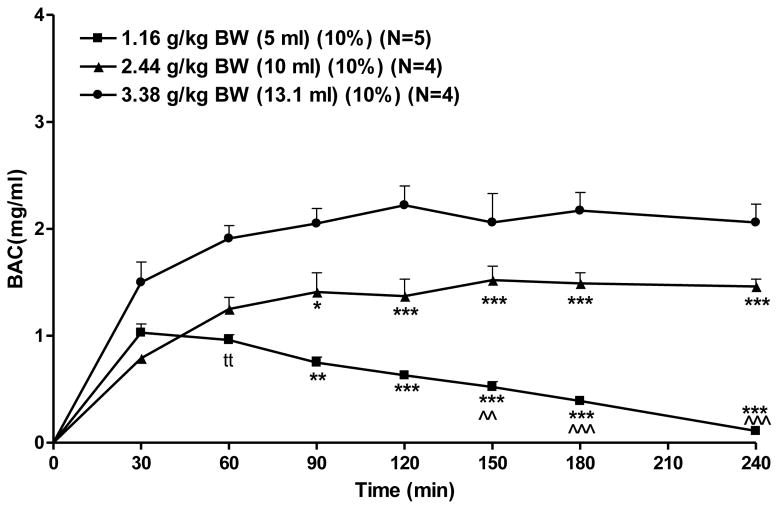
Doses of 1.16, 2.44, or 3.38 grams alcohol/kg BW were achieved by holding concentration constant at 10% and altering the alcohol volume infused. At a low dose (1.16 g/kg BW), BAC peaked at approximately 1.0 mg/ml at 30 minutes and returned to baseline by 4 hrs after the onset of alcohol infusion (Figure 5). At a moderate dose (2.44 g/kg BW) BAC peaked at approximately 1.5 mg/ml at 150 minutes after the onset of alcohol infusion and remained elevated throughout 4 hours. At a high dose (3.38 g/kg BW) BAC peaked at approximately 2.2 mg/ml at 120 minutes after the onset of alcohol infusion and remained elevated throughout 4 hrs (Figure 5). The AUCs of the BAC time courses for each of the three alcohol doses were compared using a two-way RM ANOVA (dose × time, with repeated measures on time). There was a significant effect of dose [F (2, 10) = 34.3, p < 0.001], time [F (6, 60) = 339.9, p < 0.001], and a dose × time interaction [F (12, 60) = 36.9, p < 0.001]. Fisher’s LSD test revealed that the AUC(0–240) produced by an infusion of a low dose of alcohol (1.16 g/kg BW) was significantly lower than that produced by moderate (2.44 g/kg BW) and high (3.38 g/kg BW) doses of alcohol (p < 0.001 and p < 0.001 respectively). The AUC(0–240) produced by an infusion of a moderate dose of alcohol (2.44 g/kg BW) was significantly higher (p < 0.01) than that produced by a low dose (1.16 g/kg BW). Fisher’s LSD test on dose within time revealed that the highest dose (3.38 g/kg BW) produced a higher AUC than the moderate and low doses from 0–90 minutes (p<0.05, and p<0.01, respectively), from 0–120 minutes (p<0.001, and p<0.001, respectively), from 0–150 minutes (p<0.001, and p<0.001, respectively), from 0–180 minutes(p<0.001, and p<0.001, respectively), and from 0–240 minutes (p<0.001, and p<0.001, respectively). The moderate dose of alcohol produced a higher AUC than did the lowest dose from 0–150 minutes (p<0.01), from 0–180 minutes (p<0.001), and from 0–240 minutes (p<0.001) (Fig. 5). In order to determine when the difference in AUC, as a function of altering alcohol dose via volume emerged, a t-test was performed between the groups receiving alcohol in a dose of 3.38 and 2.44 and 1.16 g/kg BW at the 30-minute and 60-minute time points. Only the comparison of 3.38 vs 1.16 g/kg BW at 60 minutes was significant (p<.01) (Figure 5).
Figure 5.
Effect of alcohol dose and volume on BAC. Rats were infused with one of 3 doses of alcohol with dose achieved by varying volume while holding alcohol concentration constant at 10%. Each point represents the mean ± S.E. *=p<0.05, **=p<0.01, ***=p<0.001 vs 3.38g/kg BW by Fisher’s LSD; ^^=p<0.05, and ^^^=p<0.001 vs 2.44g/kg BW by Fisher’s LSD; tt=p<0.01 vs 3.38g/kg BW by t-test.
Study 2B (Effect of alcohol dose and concentration on BAC)
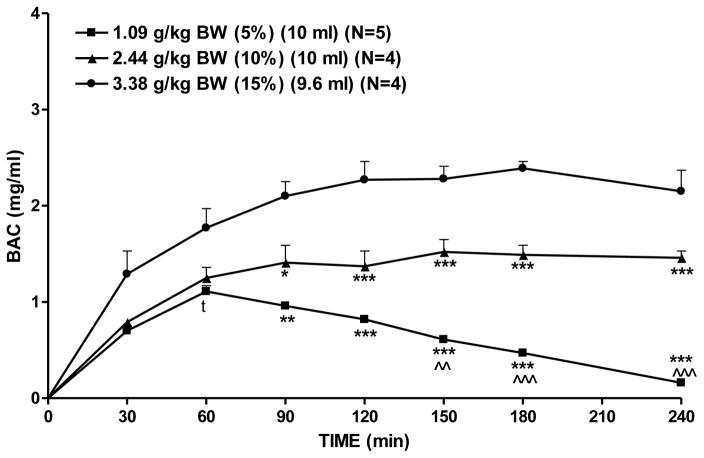
Doses of 1.09, 2.44, or 3.38 grams alcohol/kg BW were achieved by holding volume constant and altering the concentration of alcohol infused. At a low dose of alcohol (1.09 g/kg BW), BAC peaked at 1.1 mg/ml at 60 minutes and returned to baseline by 4 hrs after the onset of alcohol infusion (Figure 6). At a moderate dose of alcohol (2.44 g/kg BW) BAC peaked at approximately 1.5 mg/ml at 150 minutes after the onset of alcohol infusion and remained elevated throughout the 4 hrs. At a high dose of alcohol (3.38 g/kg BW) BAC peaked at 2.4 mg/ml at 180 minutes after the onset of alcohol infusion and remained elevated throughout the 4 hrs (Figure 6). The AUCs of the BAC time curves at each of the three alcohol doses were compared using a two-way RM ANOVA (dose × time, with repeated measures on time). There was a significant effect of dose [F(2, 10)= 44.9, p<0.001], time [F (6, 60) = 659.4, p < 0.001], and a dose × time interaction [F(12,60)=63.1, p<0.001]. Fisher’s LSD test revealed that the AUC(0–240) produced by infusion of a low dose of alcohol (1.09 g/kg BW) was lower than that produced by moderate (2.44 g/kg BW) and high (3.44g/kg BW) doses of alcohol (p <0.001 and p <0.001, respectively). The AUC(0–240) produced by infusion of a moderate dose of alcohol (2.44 g/kg BW) was higher than that produced by the lowest dose (1.16 g/kg BW) (p<0.001). Fischer’s LSD test on dose within time revealed that the highest dose of alcohol (3.38 g/kg BW) produced a higher AUC than either the low (1.09 g/kg BW) or moderate (2.44 g/kg BW) doses from 0–90 minutes (p<0.01, and p<0.05, respectively), from 0–120 minutes (p<0.001, and p<0.001, respectively), from 0–150 minutes (p<0.001, and p<0.001, respectively), from 0–180 minutes (p<0.001, and p<0.001, respectively), and from 0–240 minutes (p<0.001, and p<0.001, respectively). The moderate dose of alcohol (2.44 g/kg BW) produced a higher AUC than the low dose (1.09 g/kg BW) from 0–150 minutes (p<0.01), from 0–180 minutes (p<0.001), and from 0–240 minutes (p<0.001) (Fig. 6). In order to determine when the difference in AUC, as a function of changing alcohol dose via concentration emerged, a t-test was performed between alcohol in a dose of 3.38 and 2.44 and 1.09 g/kg BW at the 30-minute and 60-minute time points. Only the comparison of 3.38 vs 1.09 g/kg BW at 60 minutes was significant (p<.05) (Figure 6).
Figure 6.
Effect of alcohol dose and concentration on BAC. Rats were infused with one of 3 doses of alcohol with dose achieved by varying concentration while holding alcohol volume constant at 10 mls. Each point represents the mean ± S.E. *=p<0.05, **=p<0.01, ***=p<0.001 vs 3.38g/kg BW; ^^=p<0.05, and ^^^=p<0.001 vs 2.44g/kg BW; and t=p<0.05 vs 3.44 by t-test.
In Study 2C (Effect of alcohol concentration and volume on BAC)
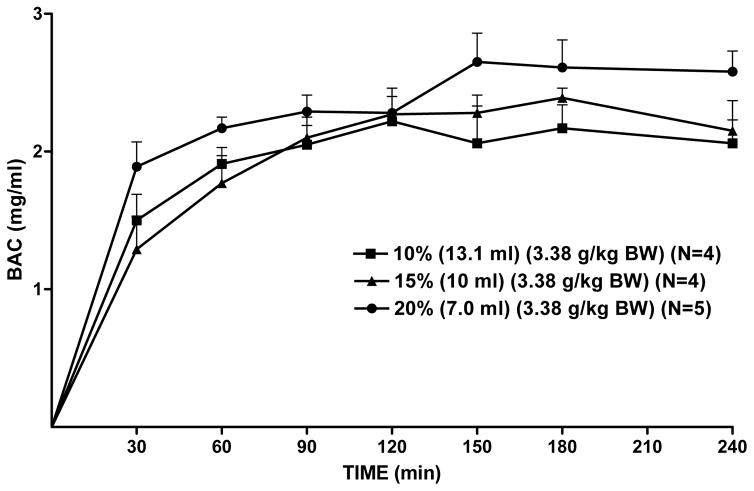
To determine the effect of alcohol concentration on BAC, alcohol dose was held constant that 3.38 g/kg BW and alcohol was diluted to concentrations of 10%, 15%, or 20% alcohol which necessarily also altered volume of the infusate. At a low concentration of alcohol (10%), BAC peaked at 2.2 mg/ml at 120 minutes after onset of infusion and remained elevated throughout 4 hrs (Figure 7). At a moderate concentration of alcohol (15%) BAC peaked at approximately 2.4 mg/ml at 180 minutes after the onset of alcohol infusion and remained elevated throughout 4hrs. At the highest concentration of alcohol (20%) BAC peaked at 2.7 mg/ml at 150 minutes after the onset of alcohol infusion and remained elevated throughout 4 hrs (Figure 7). The mean AUCs resulting from each of the three alcohol concentrations were compared using a two-way RM ANOVA (concentration × time, with repeated measures on time). There was a significant effect of concentration [F(2,10)=4.6, p<0.05], time [F(6,60)=654.3, p<0.001], and no concentration × time interaction. Fisher’s LSD revealed that the AUC(0–240) was higher for the 20% alcohol solution than it was for the 15% or 10% solutions (p<0.05, and p<0.05, respectively).
Figure 7.
Effect of alcohol concentration and volume on BAC. Rats were infused with one of 3 alcohol concentrations which were achieved by varying volume while holding alcohol dose constant at 3.38 g/kg BW. Each point represents the mean ± S.E.
DISCUSSION
HAD rats consumed 90% of their total alcohol intake in the first 30 minutes of a 2-hour alcohol access period (Figure 1). When BAC was compared to alcohol and water intake an interesting relationship was noted (Figure 2). A high BAC did not so much reflect a larger intake of alcohol as it did a lower intake of water which suggested that a high BAC is due more to reduced alcohol dilution than it is to high alcohol consumption (Figure 2). When correlational analyses were performed between alcohol intake and BAC, there was a strong positive correlation during the first 30 minutes of alcohol drinking which remained relatively unchanged during the next 30 minutes when drinking was low and during which time alcohol absorption was not outpaced by alcohol elimination (Haggard et al., 1941; Glass et al., 1979). After an hour, the rate of alcohol metabolism is known to outpace that of alcohol absorption as demonstrated by an increase in alcohol degradation products in the blood (Schlorffa et al., 1999).
The amount of water consumed concomitantly with alcohol had a strong influence on the resulting BAC (Figure 2). This finding agrees well with an early report by Murphy and colleagues (1986) who found that rats given free access to alcohol and water concurrently, and drinking similar amounts of alcohol but differing amounts of water, manifested very different BACs. Other studies have reported variability of BACs in subjects given the same alcohol dose when consumption of fluid or food is not controlled (O’Niell et al., 1973; Pierce and West, 1986; Samson and Grant, 1984). These results suggested a need for a systematic evaluation of the factors that can influence the relationship between the amount of alcohol consumed and the resulting BAC.
A second study was undertaken to determine the effect of altering alcohol dose, volume, and/or concentration on the resulting BAC. This required tight control over the amount of alcohol each rat received, which was achieved via IG infusion. Since food in the stomach slows the rate of alcohol absorption (Haggard et al., 1940; Roine et al., 2000), the amount of food in the stomach was equated for all rats prior to onset of the IG infusion of alcohol in different doses, volumes and concentrations. Area Under the Curve (AUC), the classic approach used to depict and quantify systemic levels of a drug overtime (Buxton and Benet, 2011), was used to calculate BAC for different alcohol doses which were produced via changes in alcohol volume or concentration. It was found that the BACs produced by 3 widely differing alcohol doses were similar during the first 30 minutes following onset of infusion, with differences, as a function of dose, arising only at later time points. Since equilibration of blood and brain alcohol levels occurs within 3 minutes (Davson et al., 1963; Gomez et al., 2011; Wallgren and Barry, 1970), the level of alcohol in the brain would also be similar, despite a three-fold difference in alcohol dose, within the first 30 minutes of alcohol exposure. The fact that it cannot be assumed that greater consumption or self-administration of alcohol will result in higher blood and brain alcohol levels has important implications for interpretation of studies that measure alcohol sensitive endpoints such as tests of intoxication (motor control), neuronal activity, or behavior during the first 30 minutes of alcohol exposure.
Differences in BAC as a function of dose were clearly seen at later time points when, as expected, a higher dose of alcohol (3.36 g/kg BW) produced a greater BAC than did a moderate (2.24 g/kg BW) or low (1.16 g/kg BW) dose of alcohol. This is the classic relationship between alcohol dose and BAC (Haggard and Greenberg, 1940; Haggard et al., 1938; Pikaar et al., 1988).
The results also demonstrate that increasing the concentration of alcohol (>20%) can increase BAC even when the amount of alcohol ingested (dose) remains constant. When dose of alcohol was held constant (3.46 g/kg BW) and alcohol concentration was varied (as was volume, inevitably) the highest BAC was seen with the highest alcohol concentration (20% v/v) and lower BACs were seen with lower alcohol concentrations (10% and 15% v/v) (Figure 7). This agrees well with prior reports, in rats and humans, that alcohol concentration can influence BAC independent of alcohol dose (Haggard et al., 1941; Roine et al., 1991; 1993; Pikaar et al., 1988).
In summary, in the current study, three-fold differences in alcohol dose (achieved by changing alcohol concentration or volume) did not lead to differences in BAC which suggests that inferences about BAC based on amount of alcohol consumed during this time are likely to be unreliable. Consequently, changes in behavior, biochemistry, or physiology observed during this time should not be attributed to differences in blood or brain alcohol levels. Eliminating concurrent access to fluids other than alcohol, or correcting for intake of fluids other than alcohol, is necessary in order to make reliable estimates of BAC based on alcohol intake during the early phases of alcohol drinking or self-administration studies.
Acknowledgments
We thank Dr. Ting-Kai Li and the Indiana Alcohol Research Center for supplying the selectively bred rats used in this study. This work was supported by National Institutes of Health grants AA10709 (JCF), AA18604 (JCF), AA021208 (JCF) and AA07611 (JCF). There are no conflicts of interest in this manuscript.
References
- Aures D, Guth PH, Paulsen G, Grossman MI. Effect of increased gastric mucosal histamine on alcohol-induced gastric damage in rats. Dig Dis Sci. 1982;27:347–352. doi: 10.1007/BF01296755. [DOI] [PubMed] [Google Scholar]
- Barry AE, Piazza-Gardner AK. Drunkorexia: understanding the co-occurrence of alcohol consumption and eating/exercise weight management behaviors. J Am Coll Health. 2012;60(3):236–243. doi: 10.1080/07448481.2011.587487. [DOI] [PubMed] [Google Scholar]
- Bell RL, Rodd ZA, Lumeng L, Murphy M, McBride WJ. The alcohol-preferring P rat and animal models of excessive alcohol drinking. Addict Biol. 2006;11:270–288. doi: 10.1111/j.1369-1600.2005.00029.x. [DOI] [PubMed] [Google Scholar]
- Becker JB, Koob GF. Sex differences in animal models: focus on addiction. Pharmacol Rev. 2016;68:242–263. doi: 10.1124/pr.115.011163. [DOI] [PMC free article] [PubMed] [Google Scholar]
- Berggren SM, Goldberg L. The absorption of ethyl alcohol from the gastro-intestinal tract as a diffusion process. Acta Phys Scand. 1940;1:247–270. [Google Scholar]
- Borowitz JL, Moore PF, Yim GKW, Miya TS. Mechanism of enhanced drug effects produced by dilution of the oral dose. Toxicology and Applied Pharmacology. 1971;19:164–168. doi: 10.1016/0041-008x(71)90103-7. [DOI] [PubMed] [Google Scholar]
- Bujanda L. The effects of alcohol consumption upon the gastrointestinal tract. Am J Gastroenterol. 2000;95:3374–3382. doi: 10.1111/j.1572-0241.2000.03347.x. [DOI] [PubMed] [Google Scholar]
- Burke SC, Cremeens J, Vail-Smith K, Woolsey C. Drunkorexia: Calorie restriction prior to alcohol consumption among college freshman. J Alcohol and Drug Education. 2010;54(2):17. [Google Scholar]
- Buxton LLO, Benet LZ. Pharmacokinetics: The Dynamics of Drug Absorption, Distribution, Metabolism, and Elimination. In: Shanahan JF, Naglieri C, editors. Goodman & Gilman’s: The Pharmacological Basis of Therapeutics. 12. McGraw-Hill; New York: 2011. [Google Scholar]
- Cicero TJ. Critique of animal analogues of alcoholism. In: Majchrowicz E, Noble EP, editors. Biochemistry and Pharmaology of Ethanol. Plenum Publishing Company; New York: 1979. pp. 533–560. [Google Scholar]
- Crippens D, White ML, George MA, Jaworski JN, Brunner LJ, Lancanster FE, Gonzalez RA. Gender differences in blood levels, but not brain levels, of ethanol in rats. Alcohol Clin Exp Res. 1999;23:414–420. [PubMed] [Google Scholar]
- Davson H, Kleeman CF, Levin E. The blood-brain barrier. In: Hogben CAM, Lindgren P, editors. Proc first Int. Phamacol Meeting, Vol 4, Drugs and Membranes. Pergamon Press; Oxford: 1963. pp. 71–94. [Google Scholar]
- Eisenberg MH, Fitz CC. “Drunkorexia”: Exploring the who and why of a disturbing trend in college students’ eating and drinking behaviors. J Am Coll Health. 2014;62(8):570–577. doi: 10.1080/07448481.2014.947991. [DOI] [PubMed] [Google Scholar]
- Erickson CK. Factors affecting the distribution and measurement of ethanol in the body. Biochemistry and pharmacology of ethanol. 1979;1:9–26. [Google Scholar]
- Froehlich JC, Harts J, Lumeng L, Li T-K. Differences in response to the aversive properties of alcohol in rats selectively bred for oral alcohol preference. Pharmacol Biochem Behav. 1988;31:215–222. doi: 10.1016/0091-3057(88)90336-x. [DOI] [PubMed] [Google Scholar]
- Froehlich JC, Li TK. Opioid Peptides. In: Galanter M, editor. Recent Developments in Alcoholism, Volume 11, 10 years of progress. Plenum Publishing Co; New York: 1993. pp. 187–205. [PubMed] [Google Scholar]
- Glass GBJ, Slomiany BL, Slomiany A. Biochemical and pathological derangements of the gastrointestinal tract following acute and chronic digestion of alcohol. In: Majchrowicz E, Noble EP, editors. Biochemistry and Pharmacology of Ethanol. Vol. 2. Plenum Publishing Company; New York: 1979. pp. 551–586. [Google Scholar]
- Grahame NJ, Grose AM. Blood alcohol concentrations after scheduled access in high-alcohol-preferring mice. Alcohol. 2003;31:99–104. doi: 10.1016/j.alcohol.2003.08.002. [DOI] [PubMed] [Google Scholar]
- Gomez R, Behar KL, Watzl J, Weinzimer SA, Gulanski B, Sanacora G, Koretski J, Gudione E, Jiang IL, Pittman B, Krystal JH, Mason GF. Intravenous ethanol infusion decreases human cortical γ-aminobutyric acid and N-acetylaspartate as measured with proton magnetic resonance spectroscopy at 4 tesla. Biol Psychiatry. 2012;71:239–246. doi: 10.1016/j.biopsych.2011.06.026. [DOI] [PMC free article] [PubMed] [Google Scholar]
- Haggard HW, Greenberg LA. Studies on the absorption, distribution, and elimination of alcohol V: The influence of glycocol upon the absorption of alcohol. J Pharmocol and Exp Ther. 1940;68:482–493. [Google Scholar]
- Haggard HW, Greenberg LA, Cohen LH. Quantitative differences in the effects of alcoholic beverages. N Engl J Med. 1938;219:466–470. [Google Scholar]
- Haggard HW, Greenberg LA, Lolli G. The absorption of alcohol with special reference to its influence on the concentration of alcohol appearing in the blood. Q J Stud Alcohol. 1941;1:684–726. [Google Scholar]
- Holt S. Observations on the relation between alcohol absorption and the rate of gastric emptying. Can Med Assoc J. 1981;124:267–277. [PMC free article] [PubMed] [Google Scholar]
- Ishiguchi T, Nakajima M, Sone H, Tada H, Kumagai AK, Takashi T. Gastric distention-induced pyloric relaxation: cental nervous system regulation and effects of acute hyperglycaemia in the rat. J Physiol. 2001;533:801–813. doi: 10.1111/j.1469-7793.2001.t01-1-00801.x. [DOI] [PMC free article] [PubMed] [Google Scholar]
- Jones AW, Jönsson KÅ. Food-Induced Lowering of Blood-Ethanol Profiles and Increased Rate of Elimination Immediately After a Meal. J Forensic Sci. 1994;39(4):1084–1093. [PubMed] [Google Scholar]
- Li TK, Lumeng L, Doolittle DP, Carr LG. Molecular associations of alcohol-seeking behavior in rat lines selectively bred for high and low voluntary ethanol drinking. Alcohol Alcohol Suppl. 1991;1:121–124. [PubMed] [Google Scholar]
- Li TK, Lumeng L, McBride WJ, Murphy JM. Genetic and neurobiological basis of alcohol-seeking behavior. Alcohol Alcohol. 1994;29:697–700. [PubMed] [Google Scholar]
- Li TK, Lumeng L, McBride WJ, Murphy JM. An experimental approach to understanding the genetic and neurobiological basis of alcoholism. Trans Am Clin Climatol Assoc. 1993;104:61–72. [PMC free article] [PubMed] [Google Scholar]
- Li TK, Lumeng L, McBride WJ, Murphy JM, Froehlich JC, Morzorati S. Pharmacology of alcohol preference in rodents. In: Stimmel B, editor. Advances in Alcohol Substance and Abuse. Hawthorne Press; New York: 1988. pp. 73–86. [DOI] [PubMed] [Google Scholar]
- Li TK, Lumeng L, McBride WJ, Waller MB. Progress toward a voluntary oral consumption model of alcoholism. Drug Alcohol Depend. 1979;4:45–60. doi: 10.1016/0376-8716(79)90040-1. [DOI] [PubMed] [Google Scholar]
- Lin Y-J, Weidler DJ, Gard DS, Wagner JG. Effects of solid food on blood levels of alcohol in man. Res Comm Chem Path Pharmacol. 1976;13:713–722. [PubMed] [Google Scholar]
- Lolli G, Rubin M. The effect of concentration of alcohol on the rate of absorption and the shape of the blood alcohol curve. Q J Stud Alcohol III. 1943:57–63. [Google Scholar]
- McBride WJ, Rodd ZA, Bell RL, Lumeng L, Li TK. The alcohol-preferring (P) and high-alcohol-drinking (HAD) rats--animal models of alcoholism. Alcohol. 2014;48:209–215. doi: 10.1016/j.alcohol.2013.09.044. [DOI] [PMC free article] [PubMed] [Google Scholar]
- Murphy JM, Gatto GJ, Waller MB, McBride WJ, Lumeng L, Li T-K. Effects of scheduled access on ethanol intake by the alcohol-preferring (P) line of rats. Alcohol. 1986;3:331–336. doi: 10.1016/0741-8329(86)90010-8. [DOI] [PubMed] [Google Scholar]
- Murphy JM, Stewart RB, Bell RL, Badia-Elder NE, Carr LG, McBride WJ, Lumeng L, Li TK. Phenotypic and genotypic characterization of the Indiana University rat lines selectively bred for high and low alcohol preference. Behav Genet. 2002;32:363–388. doi: 10.1023/a:1020266306135. [DOI] [PubMed] [Google Scholar]
- O’Malley S, Froehlich JC. Advances in the use of naltrexone: An integration of preclinical and clinical findings. In: Galanter Marc., editor. Recent Developments in Alcoholism, Vol 16, Research on Alcoholism Treatment. Kluwer Academic/Plenum Publishers; New York: 2003. pp. 217–245. [PubMed] [Google Scholar]
- O’Neill B, Williams AF, Dubowski KM. Variability in blood alcohol concentrations. Implications for estimating individual results. J Stud Alcohol. 1983;44:222–230. doi: 10.15288/jsa.1983.44.222. [DOI] [PubMed] [Google Scholar]
- Pierce DR, West JR. Alcohol-induced microencephaly during the third trimester equivalent: relationship to dose and blood alcohol concentration. Alcohol. 1986;3:185–191. doi: 10.1016/0741-8329(86)90043-1. [DOI] [PubMed] [Google Scholar]
- Pikaar NA, Wedel M, Hermus RJJ. Influence of several factors on blood alcohol concentrations after drinking alcohol. Alcohol Alcohol. 1988;23:289–297. [PubMed] [Google Scholar]
- Priddy BM, Carmack SA, Thomas LC, Vendruscolo JC, Koob HF, Vendruscolo LF. Sex, strain, and estrous cycle influences on alcohol drinking in rats. Pharmacol Biochem Behav. 2017;152:61–67. doi: 10.1016/j.pbb.2016.08.001. [DOI] [PMC free article] [PubMed] [Google Scholar]
- Robinson DL, Brunner LJ, Gonzales RA. Effect of gender and estrous cycle on the pharmacokinetics of ethanol in the rat brain. Alcohol Clin Exp Res. 2002;26:165–172. [PubMed] [Google Scholar]
- Roine R. Interaction of Prandial State and Beverage Concentration on Alcohol Absorption. Alcohol Clin Exp Res. 2000;24:411–412. [PubMed] [Google Scholar]
- Roine RP, Gentry RT, Lim RT, Baraona E, Lieber CS. Effect of concentration of ingested alcohol on blood alcohol levels. Alcohol Clin Exp Res. 1991;15:734–738. doi: 10.1111/j.1530-0277.1991.tb00589.x. [DOI] [PubMed] [Google Scholar]
- Roine RP, Gentry RT, Lim RT, Jr, Helkkonen E, Salaspuro M, Lieber CS. Comparison of blood alcohol concentrations after beer and whiskey. Alcohol Clin Exp Res. 1993;17:709–711. doi: 10.1111/j.1530-0277.1993.tb00824.x. [DOI] [PubMed] [Google Scholar]
- Roosen KM, Mills JS. Exploring the motives and mental health correlates of intentional food restriction prior to alcohol use in university students. J Health Psychol. 2015;20(6):875–886. doi: 10.1177/1359105315573436. [DOI] [PubMed] [Google Scholar]
- Samson HH, Grant KA. Ethanol-induced microcephaly in neonatal rats: relation to dose. Alcohol Clin Exp Res. 1984;8:201–203. doi: 10.1111/j.1530-0277.1984.tb05839.x. [DOI] [PubMed] [Google Scholar]
- Schlorffa EC, Husaina K, Somainia SM. Dose- and tome-dependent effects of ethanol on plasma antioxidant system in rat. Alcohol. 1999;17:97–105. doi: 10.1016/s0741-8329(98)00039-1. [DOI] [PubMed] [Google Scholar]
- Shafik A, El Sibai O, Shafik AA, Shafik IA. Mechanism of gastric emptying through pyloric sphincter: a human study. Med Sci Monit. 2007;13:CR24–29. [PubMed] [Google Scholar]
- Smith SG, Werner TE, Davis WM. Technique for intragastric delivery of solution: Application for self-administration of morphine and alcohol by rats. Physiological Psychology. 1975;3:220–224. [Google Scholar]
- Wallgren A, Barry H., III . Actions of alcohol, Vol. I. Chronic and Clinical Aspects. Amsterdam: Elsevier; 1970. [Google Scholar]


