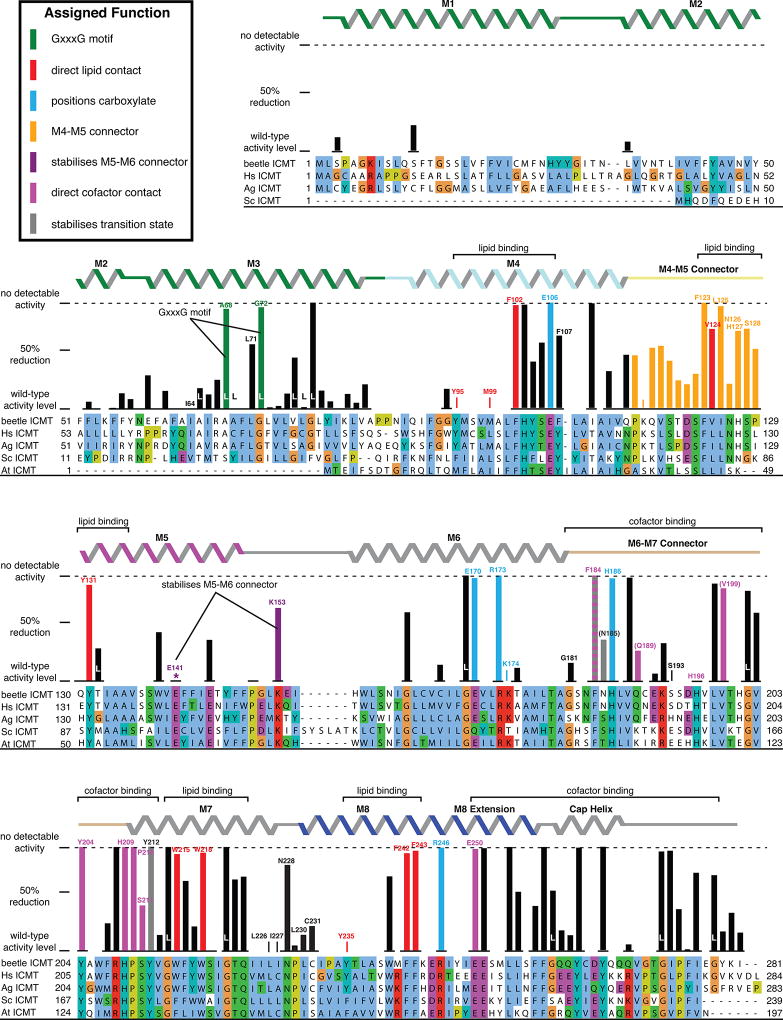
Extended Data Figure 1. The structure identifies functions for key residues.
ICMT is displayed as a progression from primary sequence alignment, to the effects of scanning mutagenesis (bar graphs), to observed secondary structure (α-helices depicted as ribbons), to the assigned role of amino acids. Results from scanning mutagenesis experiments12 are plotted above the sequence alignment as a bar graph showing the reduction of specific activity in comparison to wild-type ICMT, with 0% representing wild-type activity and 100% reflecting no detectable activity (indicated by a horizontal dashed line). The secondary structure is coloured according to Figure 4a. The inset key denotes the colouring of the bar graph according to the functional role of the amino acid inferred from the atomic structure. Labeled brackets above the secondary structure denote the general function of the indicated regions of the primary sequence. The colouring of the bar graph is the following: amino acids that contact AdoHcy are magenta; parentheses indicate hydrogen bonds to backbone atoms. Amino acids that line the lipid-binding cavity are red. Arginine residues that are proposed to form hydrogen bonds with the carboxylate of the prenylcysteine substrate, and the residues that position them, are coloured blue. Residues proposed to form hydrogen bonds to the methyl of AdoHcy in the transition state are coloured grey. Hydrogen bonds made with backbone atoms are indicated by parentheses surrounding the amino acid label. The mutagenesis data are derived from Diver and Long12 from experiments using Anopheles gambiae ICMT, and are normalised for expression level. Except where noted, the mutations were alanine substitutions. In some cases, leucine substitutions were made, as indicated by the letter “L” (e.g. when the wild-type amino acid was a glycine or alanine). The data represent triplicate measurements for each mutate and have an average standard deviation of +/− 11%. Gaps in the bar graph indicate amino acid positions that were not analyzed by mutagenesis. Based on size-exclusion chromatography that was performed for each of the mutants, only the E141A mutation was found to be notably destabilising (asterisk). A few mutations increased the activity relative to wild-type; these are also depicted at the 0% reduction level. The amino acid sequences included in the alignment are: Tribolium castaneum ICMT (beetle ICMT), and human (Hs), Anopheles gambiae (Ag), Saccharomyces cerevisiae (Sc), and Arabidopsis thaliana (At) orthologs, with UniProt accession numbers: D6WJ77, O60725, Q7PXA7, P32584, Q93W54, respectively. The alignment is coloured according to the ClustalW convention.

