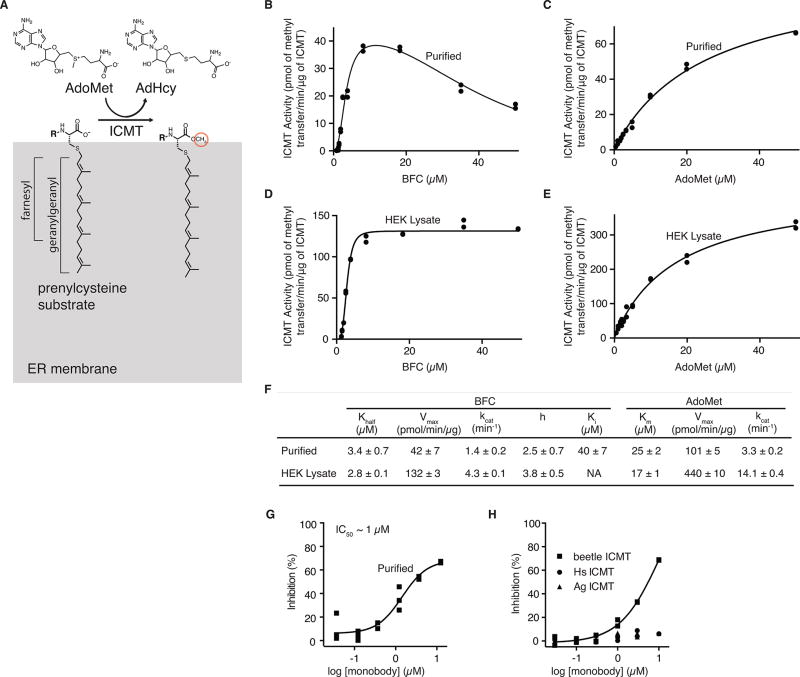
Extended Data Figure 2. Enzymatic activity and monobody inhibition of beetle ICMT.
a, Schematic of the ICMT reaction. Gray region represents the ER membrane. “R” denotes the protein portion of the substrate. In the minimal substrate AGGC, “R” is an acetyl group. For biotin-S-farnesyl-L-cysteine (BFC), “R” is a biotin group. b–e, Activity of beetle ICMT, purified in DMNG detergent (b and c), or in cell lysate (d and e), shown as a plot of the formation of BFC-[3H]methyl ester as a function of BFC concentration (b and d) or AdoMet concentration (c and e). For assays using HEK293 cells (d–e), ICMT was expressed as a fusion protein with green fluorescent protein (GFP) in order to quantify the amount of enzyme in the cell lysate (Methods). f, Kinetic parameters determined from the curves in (b–e). Best-fit values (calculated in GraphPad Prism 7 software) are reported with the standard error of the fit. We observed a degree of substrate inhibition at higher concentrations of BFC (Ki ~40 µM) when using ICMT in detergent (b and f), which may be due to a dispersive nature of BFC when it exceeds the detergent concentration (10 µM). g, Dose-response curve showing the inhibitory effects of the monobody on the activity of purified beetle ICMT in detergent. h, Comparison of the effects of the monobody on the activities of beetle, human (Hs), and Anopheles gambiae (Ag) ICMT enzymes in HEK293 cell lysates. GFP-ICMT fusion proteins were used for the three orthologs and the concentration of each enzyme was determined using the fluorescence of GFP (Methods). The monobody inhibited beetle ICMT with an IC50 of ~7 µM in this assay, whereas no detectable inhibition of Hs or Ag ICMT was observed. Individual data points are shown on the graphs (b–e and g–h).

