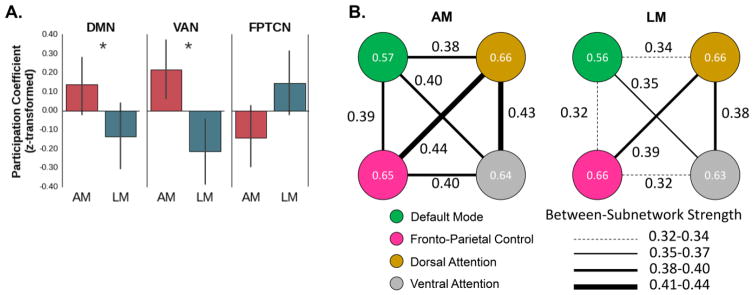
Fig 4.
Functional networks underlying autobiographical and laboratory memory recovery. Panel A shows that nodes within the DMN and VAN exhibited higher participation coefficients (i.e., exhibited a more integrated topology) in the AM network than in the LM network. By contrast, nodes within the FPTCN showed an opposite trend (higher participation coefficients in the LM network); z-transformed participation coefficients are presented here so participation coefficients between subnetworks are on the same scale. Panel B shows a visualization of these results, in which the colored circles represent each of the subnetworks and lines between the circles represent between-subnetwork connections. The values within each circle are the average participation coefficient across participants for the respective subnetwork. The values between each subnetwork represent the strength of each between-subnetwork connection, which are based on the AM and LM recovery networks averaged across all participants; thicker lines represent stronger between-subnetwork connections. It can be seen that the DMN and VAN had stronger between-subnetwork connections in the AM than LM network. AM = autobiographical memory; LM = laboratory memory; DMN = default mode network; VAN = ventral attention network; FPTCN; fronto-parietal task control network; * = p < .05.

