

Abstract
Hydroxychloroquine (HCQ) has been shown to disrupt autophagy and sensitize cancer cells to radiation and chemotherapeutic agents. However, the optimal delivery method, dose, and tumor concentrations required for these effects are not known. This is in part due to a lack of sensitive and reproducible analytical methods for HCQ quantitation in small animals. As such, we developed and validated a selective and sensitive liquid chromatography coupled with tandem mass spectrometry (LC-MS/MS) method for simultaneous quantitation of hydroxychloroquine and its metabolites in mouse blood and tissues. The chromatographic separation and detection of analytes were achieved on a reversed phase Thermo Aquasil C18 (50 × 4.6 mm, 3μ) column, with gradient elution using 0.2 % formic acid and 0.1% formic acid in methanol as mobile phase at a flow rate of 0.5 mL/min. Simple protein precipitation was utilized for extraction of analytes from the desired matrix. Analytes were separated and quantitated using MS/MS with an electrospray ionization source in positive multiple reaction monitoring (MRM) mode. The MS/MS response was linear over the concentration range from 1–2000 ng/mL for all analytes with a correlation coefficient (R2) of 0.998 or better. The within- and between-day precision (relative standard deviation, % RSD) and accuracy were within the acceptable limits per FDA guidelines. The validated method was successfully applied to a preclinical pharmacokinetic mouse study involving low volume blood and tissue samples for hydroxychloroquine and metabolites.
Keywords: LC-MS/MS, Hydroxychloroquine, Desethyl hydroxychloroquine, Chemosensitization, Malaria, Pharmacokinetics
1. Introduction
Hydroxychloroquine (HCQ) was first synthesized in 1946 as an alternative to avoid toxicities from chloroquine (CQ) in the treatment of malaria [1]. The 4-aminoquinoline derivative quickly found a niche in the management of rheumatoid arthritis and has remained in clinical use ever since [2]. Over the years, HCQ has also shown beneficial effects in other chronic autoimmune disorders such lupus [3] and Q-fever [4]. Recently, there has been renewed interest in HCQ due to its effects on disrupting autophagy, cellular proliferation, and cancer metastasis [5, 6]. In addition, HCQ has been shown to sensitize cancer cells to radiation and chemotherapy [7, 8].
While there appears to be benefits of using HCQ in cancer treatment, there is little preclinical data illustrating optimal dosing regimens and tissue concentrations for HCQ. Current studies dose HCQ to achieve the highest blood concentrations with the thought that this will achieve the highest tumor concentrations. However, there is little evidence in the literature correlating blood concentrations of HCQ to tumor concentrations.
The lack of evidence to describe the pharmacokinetic (PK) profile of HCQ as it relates to tumor uptake and accumulation is partially due to the inability to detect low drug concentrations. Following intravenous (i.v.) administration, HCQ readily redistributes from blood into tissues, dropping blood concentrations below the limit of detection for traditional analytical methods. In addition, the amount of viable blood and tissue available in small animal studies can be low, especially in mice. These factors make designing small animal PK studies for HCQ very challenging.
HCQ is metabolized into three major metabolites, desethylchloroquine (DCQ), bisdesethylchloroquine (BDCQ), and monodesethylhydroxychloroquine (Cletoquine; DHCQ). The respective contributions of each metabolite to the efficacy and toxicity of HCQ treatment remain poorly understood. DHCQ appears to be the only active metabolite [9] with some evidence suggesting its therapeutic index is higher than HCQ itself. However, in patients with rheumatoid arthritis, gastrointestinal side effects and ocular toxicity are related to blood concentrations of HCQ and BDCQ, while clinical improvement is related to the blood concentrations of DHCQ [9]. Brocks et al. showed that HCQ concentrations in plasma were appreciably lower and more variable than those in whole blood suggesting whole blood is a better matrix for therapeutic drug monitoring (TDM) of HCQ [10].
Various techniques have been employed for the separation, detection, and quantification of HCQ from biological samples. A majority of these methods have relied on fluorescence detection systems used in conjunction with high performance liquid chromatography (HPLC) to analyze HCQ concentrations. Only a few methods have been developed to simultaneously quantitate HCQ and its major metabolites [11–14]. These methods have the disadvantage of being labor intensive, expensive, and time-consuming as well as requiring large sample volumes. The high sensitivity and selectivity of liquid chromatography coupled to tandem mass spectrometry (LC-MS/MS) has allowed for the analysis of picogram drug quantities, establishing itself as a major tool for bioanalysis [15, 16]. Despite the relatively high sensitivity of LC-MS/MS, methods for drug extraction from tissue need to be refined and experimental parameters optimized on a drug-by-drug basis to produce reproducible methods capable of analyzing low drug concentrations.
Although LC–MS/MS methods have been developed and validated for quantitation of HCQ [17–20], limitations in these methods still preclude their implementation in PK studies involving mice. Soichot et al. has provided a method for the quantitation of HCQ with all three of its major metabolites in whole blood, however with a LLOQ of 25 ng/mL[19]. Hong-Wei Fan et al. later developed a more sensitive method of HCQ quantitation using plasma with a LLOQ of 0.2 ng/mL, but did not explore the method’s potential for metabolite analysis nor HCQ analysis from blood or tissue [20]. Moreover, the concentration of HCQ in whole blood is greater than the concentration in plasma with a RBC:plasma partition coefficient (Kblood/plasma), ≥ 1 for HCQ and its metabolites. Thus, HCQ has a high affinity toward RBCs, and whole blood is may be better suited for quantitation of HCQ compared to plasma [21]. In addition, for studies involving mice, only small volumes of blood can be sampled from each individual mouse so assyas that utilize small volumes of blood are preferred. Therefore, we have developed a simultaneous LC–MS/MS method for quantification of HCQ and its three major metabolites from whole blood and tissues with LLOQ 1 ng/mL for all analytes that is more suited for small animal studies with direct application to human pharmacokinetic studies. The validated bioanalytical method was successfully applied to the quantitative analysis of HCQ (5 mg/kg intravenously) administered to BALB/c mice for blood and tissue determinations of HCQ, DCQ, BDCQ, and DHCQ.
2. Materials and methods
2.1. Chemicals and materials
HCQ, DCQ, BDCQ, DHCQ and HCQ-d4 (Figure 1) of pharmaceutical grade were purchased from Sigma-Aldrich (St Louis, MO). HPLC-grade methanol (MeOH), acetonitrile (ACN), and formic acid (FA), were obtained from Fisher Scientific (Fair Lawn, NJ). Centrifuge tube filters were purchases from Corning Co. (Corning, NY). Ultrapure water was obtained from a water purification system (ThermoFisher Scientific). All other reagents used in the study were of analytical grade or higher and procured from standard chemical suppliers.
Figure 1.
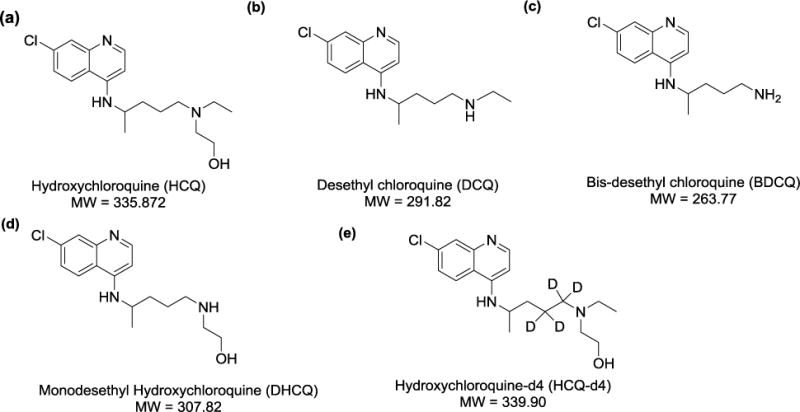
HCQ, DCQ, BDCQ, DHCQ, and D4-HCQ
2.2. Liquid chromatographic and mass spectrometric conditions
A Shimadzu, Nexera UPLC system equipped with a binary pump system (LC‐30 AD), column oven (CTO‐30AS) and an auto‐sampler (SIL‐30AC) was used. Mass spectrometric detection was performed on an LC-MS/MS 8060 system (Shimadzu Scientific Instruments, Columbia, MD), equipped with a dual ion source (DUIS) in positive electrospray ionization mode. The MS/MS system was operated at unit resolution in the multiple reaction monitoring (MRM) mode. All chromatographic separations were performed with a Thermo Aquasil C18 (50 × 4.6 mm, 3μ) column equipped with a C18 guard column (Thermo Scientific Inc).
The mobile phase consisted of 0.2% formic acid in water (mobile phase A) and 0.1% FA in MeOH (mobile phase B), at total flow rate of 0.5 mL/min with a column temperature of 40 °C. The chromatographic separation was achieved using 7.5-minute gradient elution. The gradient was: 20% B from 0.0–2.0 min, 20–70% B from 2.0–6.0 min, 70–90% B from 6.0–7.0, 90–20% B from 7.0–7.1 min, and 20% B from 7.1–7.5 min. The injection volume of all samples was 10 μL.
The compound dependent mass spectrometer parameters, such as temperature, voltage, gas pressure, etc., were optimized by the auto optimization method as included in the software pakcage via product ion search for each analyte and the internal standard (IS) using a 1 μg/mL solution in methanol. All analytes were more readily detected in positive ionization mode. The following mass spectrometer source settings were utilized: nebulizer gas: 2.0 L/min; heating gas: 10 L/min; drying gas: 10 L/min; interface temperature: 300 °C; desolvation line temperature: 250 °C; heat block temperature: 400°C. The multiple reaction monitoring (MRM) transitions for each analyte and IS, as well as their respective optimum MS parameters, such as voltage potential (Q1, Q3), and collision energy (CE), are shown in Table 1. Data acquisition and quantitation were performed by using LabSolutions LCMS Ver.5.6 (Shimadzu Scientific, Inc.).
Table 1.
Summary of MS/MS parameters: precursor ion, fragment ions, voltage potential (Q1), collision energy (CE) and voltage potential (Q3) for analytes.
| Analytes | MRM transition m/z (Q1→Q3) | Q1 (V) | CE (V) | Q3 (V) | Retention time |
|---|---|---|---|---|---|
| HCQ | 336.40>247.35 | −11 | −21 | −18 | 4.7 |
| DCQ | 292.30>114.45 | −10 | −21 | −12 | 4.6 |
| BDCQ | 264.40>179.30 | −11 | −22 | −13 | 3.8 |
| DHCQ | 308.50>179.30 | −19 | −25 | −13 | 4.0 |
| HCQ-d4 | 340.40>251.40 | −12 | −22 | −18 | 4.6 |
2.3. Preparation of stock, calibration standards and quality control samples
Individual stock solutions of 1 mg/mL of HCQ, DCQ, BDCQ, DHCQ and HCQ-d4 were prepared in 50:50 MeOH:H2O. The stock solutions were diluted with methanol to make working standard solutions, which were further diluted to prepare the calibration standards (CCs) and quality control samples (QCs). CCs were prepared by spiking 10 μL of mixed working standard solution into 25 μL of blood that had been diluted with 75 μL of water or tissue homogenate to obtain a concentration range of 1–2000 ng/mL for all analytes. The obtained CCs concentrations were 1, 2, 5, 10, 50, 100, 500, 1000, 1700 and 2000 ng/mL in matrix. QCs at four different concentrations including the lower limit of quantification (LLOQ; 1 ng/mL), low quality control (LQC; 6 ng/mL), middle quality control (MQC; 200 ng/mL) and high quality control (HQC; 1500 ng/mL), were prepared separately in five replicates, independent of CCs. All the main stocks, intermediate stocks, spiking calibration, and QCs stock solutions were kept at −20 °C.
2.4. Blood and tissues sample preparation
All analytes were extracted from CCs, QCs, mouse blood, and tissue samples by simple protein precipitation extraction method (PPT) using ACN. Briefly, 25 μL of mouse blood or 100 μL tissue homogenate of study samples were added into a 1.5 mL polypropylene (PP) tube and spiked with 10 μL of IS working solution (HCQ-d4 solution 500 ng/mL). The solution was vortexed for 30 seconds, followed by dilution with 100 μL of 1% FA and vortexed once more. Subsequently, 1 mL of ice-cold ACN was added to initiate simple protein precipitation in the sample. The mixture was vigorously vortexed for 2 minutes, followed by centrifugation at 17,950 × g for 20 minutes at 4°C. Thereafter, 950 μL of the supernatant was transferred to another 1.5 mL PP centrifuge tube and evaporated under vacuum at 50°C. The dried residue was reconstituted with 100 μL of 0.1% FA:MeOH (60:40), vortexed for 30 sec and centrifuged again at 17950 × g for 10 minutes at 4°C. The supernatant was transferred to an autosampler vial and 10 μL was injected.
2.5. Assay Validation
The developed LC-MS/MS method was fully validated according to the Guidance for Industry: Bioanalytical Method Validation of USFDA (FDA, 2001) [22].
Assay selectivity and specificity was determined by comparing the chromatogram of six different blank mouse blood or tissue homogenate samples with that of HCQ, DCQ, BDCQ, DHCQ and IS-spiked blood or tissue homogenate samples.
The sensitivity of the method was determined from the signal-to-noise ratio (S/N) of the analyte response in the calibration standards. The S/N ratio was required to be greater than three for the LOD and greater than ten for the LLOQ.
The calibration curves were established by plotting the peak area ratio (analyte/IS) versus concentration for all analytes. Each calibration curve consisted of a blank sample, a zero sample (blank + IS), and ten non-zero concentrations. The acceptance criteria for each back calculated standard concentration were ± 15% standard deviation (SD) from the nominal value except at LLOQ which was set at ± 20%.
Carry-over was checked by injecting two zero samples directly after injecting an HQC sample. The response of the first zero sample was required to be < 20% of the response of a processed LLOQ sample.
Accuracy and precision (intra- and inter-day) were determined by analyzing five replicates of QC samples at four different levels (LLOQ, LQC, MQC, and HQC) in mouse blood or tissue homogenate for three consecutive days. The acceptance criteria for all the QCs were ± 15% SD from the nominal values with a precision of ± 15% relative standard deviation (RSD), except for LLOQ, where the limit is ± 20% of SD.
2.6. Recovery and matrix effect
The extraction recoveries at three different QC levels (i.e. LQC, MQC and HQC) were determined by comparing the peak area of HCQ, DCQ, BDCQ, and DHCQ in extracted samples with those obtained by equivalent concentration of pure authentic standards for each analyte in methanol. Recovery of IS was determined in the same way.
The matrix effect was evaluated at three QC levels for each matrix. Blank mouse blood and tissues from six different animals were processed. After extraction, the dry extract was spiked with analyte prepared equivalent to QCs. Mean peak area of the analytes spiked in the blank matrix was compared with QCs prepared in the methanol.
2.7. Dilution integrity
Dilution integrity was performed using two- and five-fold dilutions of the HQC sample. Six replicates of each concentration (3000 ng/mL and 7500 ng/mL) were prepared in the corresponding matrixes, diluted to 1500 ng/mL, and analyzed against the fresh calibration curve.
2.8. Stability
The stability of HCQ, DCQ, BDCQ, and DHCQ in blood samples following three freeze– thaw cycles (room temperature to −80 °C to room temperature), long-term sample storage (−80 °C for 60 days) and bench-top storage (20 °C for 8 h) was assessed by determining at at LQC, MQC and HQC concentrations (n = 3). Auto-sampler stability of extracted samples was evalauted at 4 °C for 36 h.
2.9. Animals, drug administration and sampling
All studies were approved by the Institutional Animal Ethics Committee (protocol number 17-020-04-FC). Male BALB/c mice, weight ranging from 25–30 grams were obtained from the Jackson Laboratory. Animals were housed in the University of Nebraska Medical Center animal facility at a temperature of 23–25 °C, relative humidity of 50–70% and 12/12 hour light/dark cycles for one week prior to the experiments in order to acclimatize the animals to the laboratory conditions. Pharmacokinetic studies and the tissue distribution of HCQ and metabolites were conducted. Prior to dosing, the mice were fasted overnight (12 hours) with free access to water and standard mice food was given 2 hours post dose.
Mice were divided into four groups of five mice each. The HCQ was administered intravenously (i.v.) at a dose of 5 mg/kg of body weight. The dose was selected based on previous pharmacological reports in mice. The i.v. dose was prepared in isotonic saline and administered via the tail vein. Approximately 50 μL of whole blood was collected at 0.083, 0.25, 0.5, 0.75, 1, 2, 4, 6, 8, 24, 48 and 72 hours post dose into heparinized microcentrifuge tubes. Three blood time points with one terminal time point were collected from every mouse. Blood samples (25 uL) were transferred to a polypropylene tube and stored at −80 °C until analysis.
Tissues (liver, lungs, heart, kidney, and spleen) were collected at 6, 24 and 72 hours following the dosing. Tissue samples were rinsed thoroughly with phosphate buffered saline to remove blood and then blotted with filter paper. After weighing, each tissue sample was individually homogenized with deionized water (1:3, w/v) using a TissueLyserII (Qiagen Science, KY) and subsequently stored at −80 °C until analysis. Blood concentration (ng/mL) and tissue concentration (ng/g) were determined for each mouse. Drug accumulation in tissue was assessed by calculating a tissue to blood concentration ratio (Kp) for each tissue. When the Kp value is greater than 1, it indicates the tissue concentration is greater than the blood concentration, suggesting drug accumulation in the tissue.
The pharmacokinetic parameters of HCQ and its metabolites in blood were calculated using non-compartmental analysis with Phoenix WinNonlin 6.3 (Pharsight Corporation, Mountain view, CA). The maximum concentration (Cmax) and time to Cmax (Tmax) was obtained from the concentration time plot. The maximum concentration (C0) at time zero was extrapolated. The area under the curve (AUC0−∞) was estimated using the linear trapezoidal method from 0-tlast and extrapolation from last time point to infinity based on the observed concentration at the last time point divided by the terminal elimination rate constant (k). The elimination half life (t1/2) was calculate using the formula of 0.693/k. For intravenous administration, clearance (CL) and the apparent volume of distribution of the elimination phase (Vd) were calculated as dose/AUC0−∞ and dose/k*AUC0−∞, respectively. The tissue to blood (Kp) ratio was calculated by using the following formula:
3. Results and discussion
3.1. Chromatographic and mass spectrometric conditions optimization
To optimize MS conditions for detection of HCQ and its metabolites, ESI and atmospheric pressure chemical ionization (APCI) conditions were tested. It was found that the signal intensity of all analytes and the IS was higher by using the ESI source in positive mode compared to the APCI probe. During method optimization, the mass spectra for HCQ, DCQ, BDCQ, HDCQ and IS revealed peaks at m/z 336.4, 292.3, 264.4, 308.5 and 340.4, respectively as protonated molecular ions, [M + H]+. The fragmentation of analytes and IS were auto-optimized via precursor ion search of approximately 1000 ng/mL of stock solution for each analyte. The most abundant precursor > product ions with the highest sensitivity for HCQ, DCQ, BDCQ, DHCQ and HCQ-d4 were found to be m/z 336.4>247.3, 292.3>114.4, 264.4>179.3, 308.5>179.3 and 340.4>251.4, respectively (Figure 2). The compound dependent parameters such as voltage potential Q1 (V) and Q3 (V), and collision energy (CE) were also optimized to obtain the highest signal intensity for all the analytes and IS (Table 1).
Figure 2.
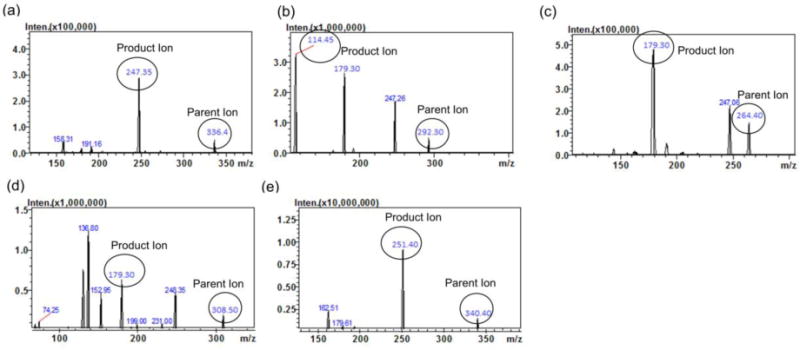
MS/MS Product ion spectra of (a) HCQ, (b) DCQ, (c) BDCQ, (d) DHCQ and HCQ-d4 (IS) in positive mode
In order to achieve a higher peak resolution and shorter chromatographic times for the all analytes, various chromatographic conditions, such as different analytical columns, different mobile phases (i.e. acetonitrile, methanol and water) and additives (i.e. formic acid, acetic acid, ammonium acetate and ammonia) were tested. Complete and rapid chromatographic resolution of analytes and IS was achieved with a gradient elution of the mobile phase on Thermo Aquasil C18 (50 × 4.6mm, 3μ) column equipped with a C18 guard column, with no significant interference from the biomatrix or endogenous compounds. Overall, 0.2% FA and 0.1% FA in MeOH as a mobile phase, at a flow rate of 0.5 mL/minute with a column temperature of 40 °C, produced the best peak shape for all the analytes. The retention times for HCQ, DCQ, BDCQ, DHCQ and HCQ-d4 were 4.7, 4.6, 3.8, 4.0 and 4.6 min, respectively. HCQ-d4 was selected as the IS because it had similar chromatographic behavior without prolonging the analysis time and similar ionization response to that of the analytes. Typical representative overlay chromatograms with blank plasma indicated no interference of endogenous compounds at the retention time of HCQ, DCQ, BDCQ, DHCQ and HCQ-d4, for samples spiked at the LQC concentration Figure 3. Further, the reproducibility (%CV) in the measurement of retention time for the analytes was 0.5% for 100 injections (data not shown).
Figure 3.
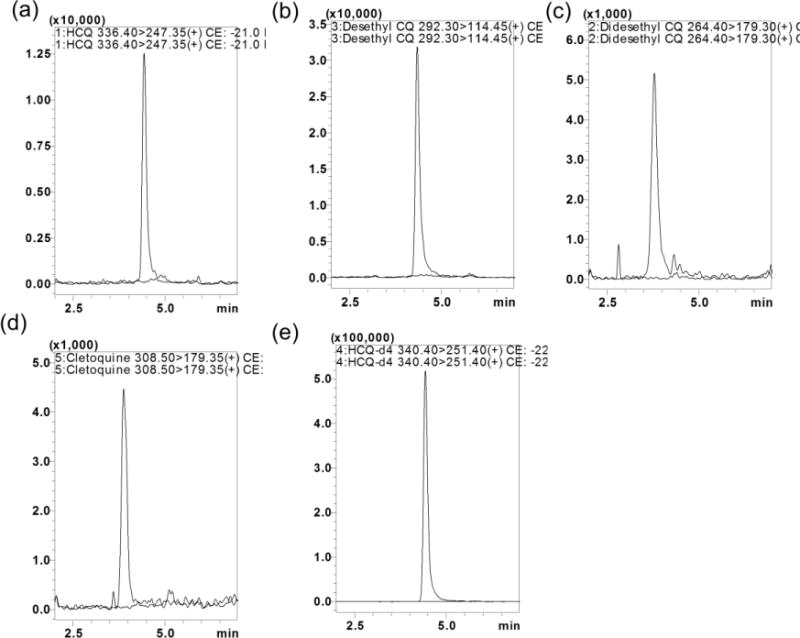
Representative MRM ion-overlay chromatograms (Blank plasma and standard spiked at LQC level) of (a) HCQ, (b) DCQ, (c) BDCQ, (d) DHCQ, and (e) HCQ-d4
3.2. Assay validation
3.2.1. Specificity and selectivity
The specificity of the method was evaluated by analyzing blank blood or tissue homogenate samples from six different animals to investigate potential interferences at the retention time of all analytes and IS. No co-eluting peaks that were > 20% of the analytes area at LLOQ level and no co-eluting peaks > 5% of the area of IS were observed. The representative UPLC overlay chromatogram with blank plasma, samples spiked at LQC concentration is shown in Figure 3. The retention time for HCQ, DCQ, BDCQ, DHCQ and HCQ-d4 were 4.7, 4.6, 3.8, 4.0, and 4.6 min, respectively. Analytes and IS peak showed less variability with a RSD well within the acceptable limit of ± 5%.
3.2.2. Calibration curve and linearity
The method exhibited a linear response over the of concentration range from 1 to 2000 ng/mL for all analytes, with a coefficient of determination of 0.998 or better. The results were fitted using linear regression with the use of 1/x2 weighting. The lowest concentration with RSD <20% was taken as LLOQ and was found 1.0 ng/ml.
3.2.3. Carry-over
The analytes showed no significant peak (< 20% of the LLOQ) in zero samples injected after the HQC samples. Thus, there was no significant carry over effect.
3.2.4. Accuracy and precision
The inter-day accuracy and precision results for the detection of HCQ and metabolites in mouse blood and tissue samples at four different concentrations are presented in Table 2. The RSD of precision values ranged from 2.3 to 12.9%, indicating acceptable assay precision. The accuracy of the quantitative analysis of the compounds was within the acceptance limits at all concentration levels.
Table 2.
Accuracy and precision (% RSD) of HCQ, DCQ, BDCQ and DHCQ in mouse blood and tissues.
| Bio Matrix | Analytes | LLOQ (1 ng/mL) | LQC (6 ng/mL) | MQC (200 ng/mL) | HQC (1500 ng/mL) | ||||
|---|---|---|---|---|---|---|---|---|---|
|
|
|||||||||
| Accuracy | % RSD | Accuracy | % RSD | Accuracy | % RSD | Accuracy | % RSD | ||
| Blood | HCQ | 112.5 | 5.7 | 110.1 | 6.1 | 98.3 | 8.4 | 112.5 | 6.6 |
| DCQ | 102.3 | 2.5 | 107.2 | 4.2 | 97.8 | 8.2 | 102.3 | 3.2 | |
| BDCQ | 104.6 | 3.4 | 108.4 | 3.7 | 96.9 | 5.4 | 105.6 | 4.8 | |
| DHCQ | 100.7 | 7.5 | 112.7 | 1.3 | 96.7 | 1.3 | 100.7 | 3.8 | |
|
| |||||||||
| Liver | HCQ | 99.2 | 5.6 | 98.1 | 3.7 | 97.8 | 10 | 87.3 | 1.8 |
| DCQ | 100.7 | 6 | 112.7 | 4.3 | 96.7 | 1.3 | 105.3 | 5.8 | |
| BDCQ | 104.6 | 1.4 | 108.4 | 3.7 | 96.9 | 5.4 | 107.5 | 4.8 | |
| DHCQ | 104.5 | 1.4 | 114.5 | 3.3 | 87.1 | 5.6 | 91.1 | 3.2 | |
|
| |||||||||
| Lungs | HCQ | 90.5 | 5.5 | 114.7 | 7.8 | 92.1 | 10.8 | 84.7 | 4.3 |
| DCQ | 109.9 | 2.9 | 100.4 | 0.9 | 103.1 | 10.3 | 107 | 5.4 | |
| BDCQ | 112.5 | 11.9 | 112.1 | 7.1 | 96.3 | 12.4 | 102.8 | 6.6 | |
| DHCQ | 102.3 | 2.5 | 107.2 | 2.2 | 97.8 | 11.2 | 90.2 | 3.2 | |
|
| |||||||||
| Kidney | HCQ | 102.9 | 14.3 | 106.7 | 2.3 | 105.8 | 10.2 | 107.3 | 1.4 |
| DCQ | 112.2 | 10.6 | 103.3 | 2.3 | 103.9 | 9.1 | 108.3 | 4.5 | |
| BDCQ | 100.2 | 4.3 | 114.4 | 3.1 | 100.6 | 9.1 | 101.1 | 55 | |
| DHCQ | 101.3 | 2.5 | 107.5 | 5.8 | 101.9 | 11.2 | 98.3 | 2.7 | |
|
| |||||||||
| Spleen | HCQ | 90.9 | 5.1 | 95.5 | 4.6 | 107.6 | 9.2 | 107.7 | 6.1 |
| DCQ | 109.6 | 7.1 | 105.3 | 2.7 | 90.1 | 11.7 | 106.5 | 4.6 | |
| BDCQ | 104.3 | 4.3 | 109.9 | 9.7 | 104.7 | 5.4 | 107.8 | 8.9 | |
| DHCQ | 90.1 | 7.1 | 106.1 | 2.9 | 101.5 | 9.2 | 109.1 | 8.9 | |
|
| |||||||||
| Heart | HCQ | 116.6 | 4.2 | 105.7 | 2.4 | 101.4 | 10.2 | 108.7 | 7.1 |
| DCQ | 110.8 | 3.8 | 99.9 | 4.7 | 102.5 | 9.1 | 95.7 | 5.5 | |
| BDCQ | 103.2 | 5.1 | 115.1 | 3.2 | 92.2 | 10 | 108.1 | 7.2 | |
| DHCQ | 101.7 | 4.4 | 109.6 | 5.4 | 100.5 | 7.4 | 90.5 | 4.7 | |
3.3 Recovery and matrix effect
The recovery of analytes was calculated from the spiked blood and tissue samples at the LQC, MQC and HQC concentrations. The absolute mean recoveries are provided in Table 3 for HCQ, DCQ, BDCQ, and DHCQ, respectively. In addition, the extraction recovery of HCQ-d4 was 81.5 ± 7.3%. The matrix effects for all the biological samples ranged from 93.45 to 105.26%.
Table 3.
Mean extraction recoveries of the HCQ, DCQ, BDCQ and DHCQ from mouse blood and tissues
| Analyte | % Extraction recoveries (Mean ± SD, n=5)
|
|||||
|---|---|---|---|---|---|---|
| Blood | Liver | Lungs | Kidney | Spleen | Heart | |
| HCQ | 84.1±12.9 | 89.4 ± 9.2 | 91.1 ± 7.9 | 75.1 ± 10.2 | 78.1 ± 13.5 | 81.5 ± 9.9 |
| DCQ | 73.8 ± 7.0 | 69.5 ± 6.5 | 74.8 ± 5.4 | 67.8 ± 10.5 | 69.2 ± 11.0 | 64.8 ± 7.0 |
| BDCQ | 68.5 ± 12.4 | 71.2 ± 8.5 | 72.3 ± 11.5 | 64.5 ± 7.4 | 75.5 ± 12.4 | 68.5 ± 8.7 |
| DHCQ | 72.5 ± 7.6 | 75.0 ± 11.2 | 68.7 ± 9.8 | 69.5 ± 8.4 | 62.5 ± 10.3 | 74.8 ± 9.6 |
3.5 Dilution integrity
The dilution integrity was confirmed for samples that exceeded the upper limit of the standard calibration curve.
3.6. Stability
Table 4 summarizes the data from stability experiments, where the mean concentration (expressed as percentage accuracy from nominal concentration) at each level is presented together with SD. In the different stability studies, analytes were found to be within ± 15% of the actual concentration at the LQC, MQC and HQC concentrations.
Table 4.
Mean stability recoveries of the HCQ, DCQ, BDCQ and DHCQ at different storage conditions in blood.
| % Stability recoveries (Mean ± SD)
|
||||
|---|---|---|---|---|
| Analyte | Freeze-thaw (−80 ± 5 °C after three cycle) | Long-term (−80 ± 5 C, 60 days) | Auto-sampler (4 C, 36 hrs) | Bench-top (20 °C 8 hrs) |
| HCQ | 90.7 ± 4.2 | 91.4 ± 7.8 | 103.4 ± 8.6 | 107.3 ± 7.8 |
| DCQ | 95.2 ± 6.5 | 96.2 ± 10.5 | 98.5 ± 9.6 | 10.3.5 ± 8.7 |
| BDCQ | 105.3 ± 4.3 | 103.4 ± 11.2 | 107.2 ± 10.7 | 109.4 ± 1.6 |
| DHCQ | 107.2 ± 7.9 | 95.4 ± 8.7 | 103.5 ± 7.8 | 102.2 ± 8.8 |
3.7. Application of the method for pharmacokinetic studies
The developed and validated LC-MS/MS method was successfully applied to the determination of HCQ pharmacokinetics and tissue distribution following a single i.v. dose of HCQ (5 mg/kg) in mice. The blood concentration vs. time profile for the HCQ and its metabolites is shown in Figure 4. The pharmacokinetic parameters of HCQ and DCQ in mice are summarized in Table 5. The compound reached a maximum concentration (C0) 1747 ± 329 ng/mL of HCQ and (Cmax) 36.1 ± 11.2 ng/mL of DCQ in blood. The value of area under curve (AUC0–∞) were determined as 5578 ± 882 and 384 ± 83 hr×ng/mL for HCQ and DCQ, respectively. The apparent volume of distribution and clearance of HCQ was found 17 ± 4 L/kg and 0.9 ± 0.2 L/hr/kg, respectively. The plasma elimination half-life (t1/2) was 13 ± 1 hrs and 14 ± 6 hrs for HCQ and DCQ, respectively. Both HCQ and DCQ were detected in plasma up to 72 hrs which was the last time point monitored. The percentage extrapolation of AUC from the last measured time point to infinity was less than 5 %.
Figure 4.
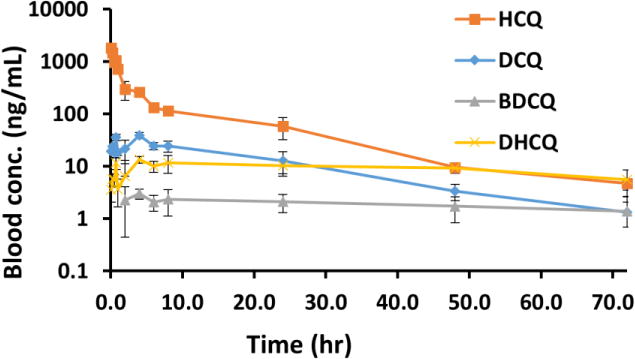
Blood Concentration-Time profile of HCQ, DCQ, BDCQ, and DHCQ, after 5 mg/kg intravenous administration of HCQ (Mean ± SD, n=5).
Table 5.
Pharmacokinetic parameters of HCQ and DCQ after 5 mg/kg intravenous administration of HCQ (Mean ± SD, n=5).
| Parameters | Estimates (mean ± SD)
|
|
|---|---|---|
| HCQ | DCQ | |
| C0 | 1746.9 ± 329.0 | – |
| Cmax (ng/ml) | NA | 36.1 ± 11.2 |
| t1/2 (hr) | 12.7 ± 1.1 | 13.7 ± 5.6 |
| AUC0−∞(hr×ng/mL) | 5577.8 ± 881.8 | 383.9 ± 83.2 |
| AUC0−last (hr×ng/mL) | 5490.6 ± 890.0 | 369.3 ± 74.3 |
| Vd (L/kg) | 17.0 ± 4.3 | NA |
| Cl (L/hr/kg) | 0.9 ± 0.2 | NA |
Abbreviation: C0: concentration at time 0 hr, Cmax: concentration at time tmax, AUC: area under the curve from 0 to ∞ hr, Vd: volume of distribution, Cl: clearance, t1/2: terminal half-life. NA: Not applicable.
Concentrations of HCQ and all three major metabolites were detected in all studied tissues (Table 6). In addition, our data show that the tissue to blood concentration ratio (Kp) is ≥1, indicating accumulation of HCQ in tissues (Table 6). The HCQ Kp ratio for the various tissues were observed in the descending order of lungs>kidney>spleen>liver>heart, whereas for HDCQ, DCQ, and BDCQ the liver was found to have the highest Kp ratio. Higher concentrations in different tissues suggest that further toxicological studies are required to investigate the relation between drug concentration and effect, both therapeutic and toxic, after repeated dosing. With multiple lines of evidence suggesting the metabolites of HCQ are active and at least partially related to HCQ efficacy and toxicity, this method will allow for the characterization of exceedingly low concentrations of HCQ and its metabolites in small animal studies.
Table 6.
Blood and tissues concentration (ng/mL) and tissue to blood concentration ratio (Kp) of HCQ, DCQ, BDCQ and DHCQ after 5 mg/kg Intra venous administration of HCQ (mean ± SD, n=5).
| Analytes | Time (hr) | Blood Conc. (ng/mL) | Liver Conc. (ng/g) | Kidney Conc. (ng/g) | Spleen Conc. (ng/g) | Lungs Conc. (ng/g) | Heart Conc. (ng/g) |
|---|---|---|---|---|---|---|---|
| HCQ | 6 | 131.2 ±24.0 | 1,918.3±130.3 | 1,465.4±441.5 | 1,899.9±103.1 | 3,395.9±611.4 | 816.11±279.4 |
| 24 | 58.6±26.3 | 700.6±347.1 | 887.7±541.0 | 673.1±350.5 | 1,739.3±1214.6 | 461.18±288.4 | |
| 72 | 4.7±1.2 | 26.8±41.6 | 89.8 ±46.4 | 41.0±37.8 | 147.5±72.9 | 31.1±11.8 | |
|
| |||||||
| DCQ | 6 | 24.5±3.9 | 1,322.4±143.6 | 530.7 ±160.6 | 340.0±17.9 | 417.0±92.4 | 121.6±32.9 |
| 24 | 12.7±6.3 | 453.4±196.4 | 473.8 ±297.4 | 144.5±74.8 | 277.7±177.6 | 92.2±48.4 | |
| 72 | 1.3±1.3 | 53.1±26.7 | 78.7 ±33.7 | 24.5±18.5 | 50.4±10 | 15.9±2.7 | |
|
| |||||||
| BDCQ | 6 | 2.1±0.7 | 671.8±135.6 | 116.4±25.1 | 50.6±6.9 | 73.8±19.9 | 22.9±7.3 |
| 24 | 2.1±0.8 | 294.4±148.9 | 128.7±71.8 | 31.6±16.1 | 64.0±53.4 | 23.7±12.6 | |
| 72 | 1.4±0.7 | 173.3±103.9 | 69.9±28.2 | 19.1±14.3 | 31.7±9.6 | 15.7±3.3 | |
|
| |||||||
| HDCQ | 6 | 10.1±2.4 | 1,957.5±315.2 | 254.7±149.6 | 298.7±19 | 212.4±37.7 | 66.3±20.4 |
| 24 | 10.3±3.1 | 1,021.2±560.5 | 302.5±186.1 | 163.6±86.7 | 178.3±120.5 | 58.6±28.8 | |
| 72 | 5.6±2.9 | 277.9±83.1 | 103.6±38.1 | 69.0±74.3 | 61.9±13.6 | 22.9±2.21 | |
|
Tissue to blood concentration ratio (Kp) Mean ± SD | |||||||
| Time (hr) | Liver (Kp) | Kidney (Kp) | Spleen (Kp) | Lungs (Kp) | Heart (Kp) | ||
|
| |||||||
| HCQ | 6 to 72 | NA | 10.8±4.6 | 15.2±4.0 | 11.6±2.9 | 29.0±2.9 | 6.9±0.9 |
| DCQ | 6 to 72 | NA | 43.2±9.6 | 39.4±18.9 | 14.6±3.6 | 25.6±11.0 | 8.1±3.6 |
| BDCQ | 6 to 72 | NA | 195.4±110.1 | 55.7±5.4 | 17.7±5.8 | 29.5±6.4 | 11.2±0.2 |
| HDCQ | 6 to 72 | NA | 114.3±73.1 | 24.4±5.4 | 19.3±9.1 | 16.5±5.0 | 5.5±1.2 |
Abbreviation: Kp: Tissue to blood concentration ratio, NA: Not applicable.
Preclinical studies investigating the therapeutic effects of HCQ have empirically used blood concentrations following the administration of the maximum tolerated dose (MTD) of the drug. There is a lack of information regarding tissue distribution of HCQ, and even less information regarding metabolite concentrations accumulating in tissues and tumors. To evaluate the effects of combination therapy on tumor response and drug toxicity, it is critical that assays be developed that are sensitive enough to quantitate drug concentrations in tissues and tumors. Moreover, several of the metabolites of HCQ are active, and the relation between metabolite concentration and efficacy or toxicity is unclear. Developing an enhanced understanding the PKs of HCQ and metabolites in animal models, and their interaction with other therapies are crucial in characterizing and further optimizing combination therapies involving HCQ.
4. Conclusion
We have developed a sensitive and reproducible LC-MS/MS method for quantitating HCQ and its metabolites (DHCQ, DCQ, and BDCQ) in blood and tissues. The LLOD is superior to previous reports, 1 versus 25 ng/mL, and the assay performance (linearity, precision, and sensitivity) and a total run time of less than 8 minutes make this analytical method ideal for high-throughput bioanalysis and routine pharmacokinetic applications. Furthermore, only a limited amount of biological sample is required, 25 μL of blood or 25 mg of tissue, which allows for the determination of drug levels in organs that are inherently small in mice. This method will be a particularly important in understanding the pharmacokinetic/pharmacodynamic relation of HCQ and metabolites, either as a single agent or in combination with other drugs. Therefore, the current LC-MS/MS method provides a valuable tool to improve our understanding of the efficacy and safety of HCQ therapy.
Highlights.
We developed a LC-MS/MS method for the quantitation of hydroxychloroquine (HCQ) and metabolites.
Acknowledgments
The work was supported by the State of Nebraska through the Pediatric Cancer Research Group, the University of Nebraska Medical Center and by the Fred & Pamela Buffett Cancer Center Support Grant from the National Cancer Institute under award number P30 CA036727. The content is solely the responsibility of the authors and does not necessarily represent the official views of the National Institutes of Health. We also acknowledge the helpful discussions with Robert J. Classon at Shimadzu Scientific Instruments, Columbia, MD.
Footnotes
Publisher's Disclaimer: This is a PDF file of an unedited manuscript that has been accepted for publication. As a service to our customers we are providing this early version of the manuscript. The manuscript will undergo copyediting, typesetting, and review of the resulting proof before it is published in its final form. Please note that during the production process errors may be discovered which could affect the content, and all legal disclaimers that apply to the journal pertain.
Conflict of interest
There is no conflict of interest to disclose.
References
- 1.Lim HS, Im JS, Cho JY, Bae KS, Klein TA, Yeom JS, Kim TS, Choi JS, Jang IJ, Park JW. Pharmacokinetics of Hydroxychloroquine and Its Clinical Implications in Chemoprophylaxis against Malaria Caused by Plasmodium vivax. Antimicrobial Agents and Chemotherapy. 2009;53:1468–1475. doi: 10.1128/AAC.00339-08. [DOI] [PMC free article] [PubMed] [Google Scholar]
- 2.Browning DJ. Pharmacology of Chloroquine and Hydroxychloroquine, Hydroxychloroquine and Chloroquine Retinopathy. Springer New York; New York, NY: 2014. pp. 35–63. [Google Scholar]
- 3.Costedoat-Chalumeau N, Galicier L, Aumaître O, Francès C, Le Guern V, Lioté F, Smail A, Limal N, Perard L, Desmurs-Clavel H, Boutin DLTH, Asli B, Kahn JE, Pourrat J, Sailler L, Ackermann F, Papo T, Sacré K, Fain O, Stirnemann J, Cacoub P, Jallouli M, Leroux G, Cohen-Bittan J, Tanguy ML, Hulot JS, Lechat P, Musset L, Amoura Z, Piette JC. Hydroxychloroquine in systemic lupus erythematosus: results of a French multicentre controlled trial (PLUS Study) Annals of the Rheumatic Diseases. 2013;72:1786–1792. doi: 10.1136/annrheumdis-2012-202322. [DOI] [PubMed] [Google Scholar]
- 4.Rolain JM, Colson P, Raoult D. Recycling of chloroquine and its hydroxyl analogue to face bacterial, fungal and viral infections in the 21st century. International Journal of Antimicrobial Agents. 2007;30:297–308. doi: 10.1016/j.ijantimicag.2007.05.015. [DOI] [PMC free article] [PubMed] [Google Scholar]
- 5.Yang S, Wang X, Contino G, Liesa M, Sahin E, Ying H, Bause A, Li Y, Stommel JM, Dell’Antonio G, Mautner J, Tonon G, Haigis M, Shirihai OS, Doglioni C, Bardeesy N, Kimmelman AC. Pancreatic cancers require autophagy for tumor growth. Genes Dev. 2011;25:717–729. doi: 10.1101/gad.2016111. [DOI] [PMC free article] [PubMed] [Google Scholar]
- 6.Yang MC, Wang HC, Hou YC, Tung HL, Chiu TJ, Shan YS. Blockade of autophagy reduces pancreatic cancer stem cell activity and potentiates the tumoricidal effect of gemcitabine. Mol Cancer. 2015;14:1–17. doi: 10.1186/s12943-015-0449-3. [DOI] [PMC free article] [PubMed] [Google Scholar]
- 7.Mezzaroba N, Zorzet S, Secco E, Biffi S, Tripodo C, Calvaruso M, Mendoza-Maldonado R, Capolla S, Granzotto M, Spretz R, Larsen G, Noriega S, Lucafò M, Mansilla E, Garrovo C, Marín GH, Baj G, Gattei V, Pozzato G, Núñez L, Macor P. New Potential Therapeutic Approach for the Treatment of B-Cell Malignancies Using Chlorambucil/Hydroxychloroquine-Loaded Anti-CD20 Nanoparticles. PLOS ONE. 2013;8:e74216. doi: 10.1371/journal.pone.0074216. [DOI] [PMC free article] [PubMed] [Google Scholar]
- 8.Goldberg SB, Supko JG, Neal JW, Muzikansky A, Digumarthy S, Fidias P, Temel JS, Heist RS, Shaw AT, McCarthy PO, Lynch TJ, Sharma S, Settleman JE, Sequist LV. A Phase I Study of Erlotinib and Hydroxychloroquine in Advanced Non–Small-Cell Lung Cancer. Journal of Thoracic Oncology. 2012;7:1602–1608. doi: 10.1097/JTO.0b013e318262de4a. [DOI] [PMC free article] [PubMed] [Google Scholar]
- 9.Munster T, Gibbs JP, Shen D, Baethge BA, Botstein GR, Caldwell J, Dietz F, Ettlinger R, Golden HE, Lindsley H. Hydroxychloroquine concentration–response relationships in patients with rheumatoid arthritis. Arthritis & Rheumatology. 2002;46:1460–1469. doi: 10.1002/art.10307. [DOI] [PubMed] [Google Scholar]
- 10.Brocks DR, Skeith KJ, Johnston C, Emamibafrani J, Davis P, Russell AS, Jamali F. Hematologic disposition of hydroxychloroquine enantiomers. The Journal of Clinical Pharmacology. 1994;34:1088–1097. doi: 10.1002/j.1552-4604.1994.tb01986.x. [DOI] [PubMed] [Google Scholar]
- 11.Tett SE, Cutler DJ, Brown KF. High-performance liquid chromatographic assay for hydroxychloroquine and metabolites in blood and plasma, using a stationary phase of poly(styrene divinylbenzene) and a mobile phase at ph 11, with fluorimetric detection. Journal of Chromatography B: Biomedical Sciences and Applications. 1985;344:241–248. doi: 10.1016/s0378-4347(00)82024-1. [DOI] [PubMed] [Google Scholar]
- 12.Williams SB, Patchen LC, Churchill FC. Analysis of blood and urine samples for hydroxychloroquine and three major metabolites by high-performance liquid chromatography with fluorescence detection. Journal of Chromatography B: Biomedical Sciences and Applications. 1988;433:197–206. doi: 10.1016/s0378-4347(00)80598-8. [DOI] [PubMed] [Google Scholar]
- 13.Costedoat-Chalumeau N, Amoura Z, Hulot JS, Hammoud HA, Aymard G, Cacoub P, Frances C, Wechsler B, Huong DLT, Ghillani P. Low blood concentration of hydroxychloroquine is a marker for and predictor of disease exacerbations in patients with systemic lupus erythematosus. Arthritis & Rheumatology. 2006;54:3284–3290. doi: 10.1002/art.22156. [DOI] [PubMed] [Google Scholar]
- 14.Qu Ying, Noe Gaelle, Breaud Autumn R, Vidal Michel, Clarke William A, Zahr Noel, Dervieu Thierry. Development and validation of a clinical HPLC method for the quantification of hydroxychloroquine and its metabolites in whole blood. Future Science OA. 2015;1 doi: 10.4155/fso.15.24. [DOI] [PMC free article] [PubMed] [Google Scholar]
- 15.Hopfgartner G, Bourgogne E. Quantitative high‐throughput analysis of drugs in biological matrices by mass spectrometry. Mass spectrometry reviews. 2003;22:195–214. doi: 10.1002/mas.10050. [DOI] [PubMed] [Google Scholar]
- 16.van Dongen WD, Niessen WM. LC–MS systems for quantitative bioanalysis. 2012 doi: 10.4155/bio.12.221. DOI. [DOI] [PubMed] [Google Scholar]
- 17.Füzéry AK, Breaud AR, Emezienna N, Schools S, Clarke WA. A rapid and reliable method for the quantitation of hydroxychloroquine in serum using turbulent flow liquid chromatography-tandem mass spectrometry. Clinica Chimica Acta. 2013;421:79–84. doi: 10.1016/j.cca.2013.02.018. [DOI] [PubMed] [Google Scholar]
- 18.Wang LZ, Ong RYL, Chin TM, Thuya WL, Wan SC, Wong ALA, Chan SY, Ho PC, Goh BC. Method development and validation for rapid quantification of hydroxychloroquine in human blood using liquid chromatography–tandem mass spectrometry. J Pharm Biomed Anal. 2012;61:86–92. doi: 10.1016/j.jpba.2011.11.034. [DOI] [PubMed] [Google Scholar]
- 19.Soichot M, Mégarbane B, Houzé P, Chevillard L, Fonsart J, Baud FJ, Laprévote O, Bourgogne E. Development, validation and clinical application of a LC-MS/MS method for the simultaneous quantification of hydroxychloroquine and its active metabolites in human whole blood. J Pharm Biomed Anal. 2014;100:131–137. doi: 10.1016/j.jpba.2014.07.009. [DOI] [PubMed] [Google Scholar]
- 20.Fan H-w, Ma Z-x, Chen J, Yang X-y, Cheng J-l, Li Y-b. Pharmacokinetics and Bioequivalence Study of Hydroxychloroquine Sulfate Tablets in Chinese Healthy Volunteers by LC–MS/MS. Rheumatology and Therapy. 2015;2:183–195. doi: 10.1007/s40744-015-0012-0. [DOI] [PMC free article] [PubMed] [Google Scholar]
- 21.Skopp G, Pötsch L, Mauden M, Richter B. Partition coefficient, blood to plasma ratio, protein binding and short-term stability of 11-nor-Δ9-carboxy tetrahydrocannabinol glucuronide. Forensic Science International. 2002;126:17–23. doi: 10.1016/s0379-0738(02)00023-3. [DOI] [PubMed] [Google Scholar]
- 22.U. Food, Drug Administration Centre for Drug Evaluation and Research (FDA) Guidance for Industry-Bioanalytical Method Validation. Vol. 2013 Silver Spring, MD: Center for Drug Evaluation and Research, US Department for Health and Human Services; May, 2001. [Google Scholar]