

ABSTRACT
Obesity is associated with a loss of insulin-sensitivity and systemic dysglycemia, resulting in Type 2 diabetes, however the molecular mechanisms underlying this association are unclear. Through adipocyte patch-clamp studies, we recently showed that SWELL1 is required for the Volume-Regulated Anion Current (VRAC) in adipocytes and that SWELL1-mediated VRAC is activated by both mechanical and pathophysiological adipocyte expansion. We also demonstrated that adipocyte SWELL1 is required for maintaining insulin signaling and glucose homeostasis, particularly in the setting of obesity. Here we show that SWELL1 protein expression is induced in subcutaneous fat, visceral fat and liver in the setting of obesity. Long- term AAV/rec2-shRNA mediated SWELL1 knock-down in both fat and liver are associated with increased weight gain, increased adiposity and exacerbated insulin resistance in mice raised on a high-fat diet. These data further support the notion that SWELL1 induction occurs in insulin- sensitive tissues (liver and adipose) in the setting of over-nutrition and contributes to improved systemic glycemia by supporting enhanced insulin-sensitivity.
KEYWORDS: adeno-associated virus, adipocytes, channel, diabetes, LRRC8a
Introduction
Obesity is a major world-wide public health problem, predisposing to high cholesterol, diabetes and hypertension, and inflicting healthcare costs over 100 billion dollars in the U.S. alone. It is characterized by a tremendous increase in adipose tissue that is in large part due to massive volumetric expansion of the constituent adipocytes1,2. This adipocyte expansion has been long associated with metabolic disease and insulin resistance,1,3-6 though the underlying mechanisms remain unclear. Taken together, this literature suggests that, in the setting of obesity, adipocyte expansion may activate an undiscovered volume-sensitive molecule that modulates adipocyte growth and intracellular signaling. We recently discovered that SWELL1 (LRRC8a)7,8 is a required component of a volume-sensitive ion channel/signaling molecule that is activated in the setting of adipocyte hypertrophy and regulates adipocyte size, insulin signaling and systemic glycaemia via a novel SWELL1-PI3K-AKT2-GLUT4 signaling axis.9
Adipocyte-specific SWELL1 ablation disrupts insulin-PI3K-AKT2 signaling, inducing insulin resistance and glucose intolerance in vivo.9 These data suggest that SWELL1 is a positive regulator of insulin signaling and glucose homeostasis, particularly in the setting of obesity. However, our previous studies did not examine whether increased VRAC observed in the setting of obesity is also associated with increased SWELL1 protein expression. In this study, we asked if SWELL1 protein expression may be induced in adipose tissue and liver in the setting of obesity, and if this induction is important for maintaining systemic insulin-sensitivity, since SWELL1 is a broadly expressed membrane protein, and insulin-PI3K-AKT2 signaling ubiquitous among insulin-sensitive tissues.
Results and discussion
To examine the effect of over-nutrition on SWELL1 expression in adipose tissue depots and in liver we performed intravenous injection of a novel adeno-associated virus serotype (AAV/rec2)10 expressing either a scrambled short-hairpin RNA (shSCR) or an shRNA-directed to SWELL1 (shSWELL1), both co-expressing an mCherry reporter.9 We examined three groups of mice (n = 9–10 each): 1. AAV/rec2-shSCR injected on regular diet; 2. AAV/rec2-shSCR injected on a high-fat diet (HFD) and; 3. AAV/rec2-shSWELL1 on HFD. After 17 weeks of either regular diet or HFD, we observe, qualitatively, robust AAV/rec2-mediated shRNA expression based on mCherry reporter expression fluorescence imaging of inguinal white adipose tissue (iWAT), epididymal adipose tissue (eWAT) and liver (Fig. 1A). HFD induced SWELL1 protein expression 2.7-fold in iWAT, 1.5-fold in eWAT and 1.4-fold in liver compared to regular diet fed mice, and this HFD induced SWELL1 expression is fully suppressed in iWAT, eWAT and liver upon shRNA-mediated SWELL1 knock-down, as quantified by Western blot analysis (Fig. 1B and C). Interestingly, in contrast to our previous data from adipose-targeted SWELL1 KO mice,9 the combination of adipose and liver SWELL1 knock-down results in increased weight gain (Fig. 2A) when raised on a HFD, with no significant differences in food consumption (Fig. 2B). This increased body weight arises from increased adiposity (Fig. 2C and D) as assessed by NMR, with no significant effect on lean mass (Fig. 2E) after 6 weeks on HFD. This difference is likely due to the combined partial disruption of insulin signaling, and consequently, impaired glucose uptake and increased gluconeogenesis in adipose tissue and liver, respectively; resulting in lipid spillover into either un-transduced adipose tissue or ectopic lipid deposition in other tissues (liver, skeletal muscle) via de novo lipogenesis. As expected AAV/rec2-shSCR injected mice on HFD (6 weeks) exhibit impaired glucose tolerance (Fig. 3A) and insulin-sensitivity (Fig. 3B) compared to AAV/rec2-shSCR injected mice on a regular diet. However, these effects of HFD are exacerbated in AAV/rec2-shSWELL1 injected mice, indicating impaired insulin signaling and systemic glycaemia upon combined liver and adipose tissue SWELL1 knock-down in the setting of obesity.
Figure 1.

SWELL1 protein expression is induced in adipose and liver in the setting of obesity. (A) Qualitative mCherry reporter fluorescence 17 weeks post AAV/rec2-mCherry injection (Scale bar: 100 μM). (B) Western blot showing SWELL1 expression in iWAT, eWAT and liver in regular-diet and HFD fed mice; (C) Quantification of B (n = 3 each group). Error Bar: Mean ± SEM. *p < 0.05; **p < 0.01; ***p < 0.001.
Figure 2.
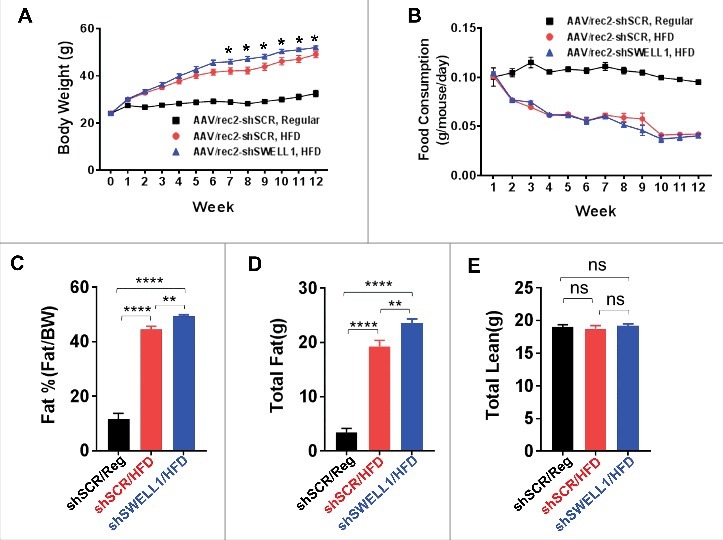
Body weight, food consumption and body composition in AAV/rec2-shSCR and AAVrec2-shSWELL1 mice on regular-diet and HFD. (A) Weekly body weights; (B) Weekly food consumption; (C) Percent body fat; (D) Total fat mass; (E) Total lean mass. n = 10 for shSCR Regular & HFD, n = 9 shSWELL1 HFD group. Error Bar: Mean ± SEM. *p < 0.05; **p < 0.01, ****p < 0.0001.
Figure 3.
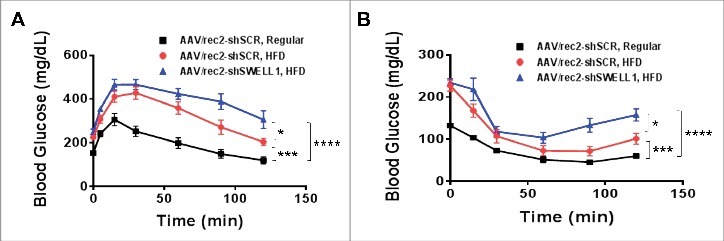
Glucose-tolerance and insulin-tolerance is impaired upon shRNA-mediated SWELL1 KD in obese mice. (A) Glucose-tolerance test; (B) Insulin-tolerance test. Error Bar: Mean ± SEM. n = 10 shSCR Regular & HFD, n = 9 shSWELL1 HFD group. *p < 0.05; ***p< 0.001; ****p < 0.0001, 2-way Anova.
Here we show that SWELL1 protein expression is induced in the setting of obesity in two insulin-sensitive tissues, adipose (iWAT, eWAT) and liver; and shRNA-mediated SWELL1 knock-down in these tissues exacerbates glucose tolerance and insulin sensitivity in this context. These data are consistent with a model in which SWELL1 induction supports insulin signaling and insulin sensitivity of tissues during feeding and potentiates cellular glucose uptake and energy storage during times of plenty.9 Moreover, this model predicts that relative SWELL1 deficiency will predispose to insulin resistance, glucose intolerance and Type 2 diabetes. Consistent with this notion, Inoue et al. (2010)11 have previously shown that adipocyte VRAC current is significantly reduced nearly three-fold in the murine diabetic KKAy model compared to either C57BL/6 mice or the non-diabetic KK parental strain. These findings suggest that reduced VRAC, putatively due to reduced SWELL1 expression, may contribute to impaired insulin signaling and peripheral insulin resistance that occurs in Type 2 diabetes. Furthermore, restoring SWELL1 expression levels in insulin-sensitive tissues in the setting of diabetes may provide a novel therapeutic strategy to improve insulin sensitivity and systemic glycemia.
Methods
Animals
The Institutional Animal Care and Use Committee of the University of Iowa approved all experimental procedures involving animals. Only male mice were used in all studies. The investigators were blinded to allocation during experiments and outcome assessment for certain experiments: 1. Nuclear Magnetic Resonance Imaging; 2; glucose tolerance testing; 3. Insulin tolerance testing. All C57BL/6 mice involved in the study were purchased from Charles River Labs. All the mice were housed in a temperature, humidity, and light controlled room and allowed free access to water and food. High fat diet was used to induce obesity in mice. Mice were fed at libitum with 60% kcal% high-fat Diet (Research Diets) for 18 weeks starting at the age of ∼8 weeks. The weights were recorded weekly after initiation of HFD. Daily food consumption was calculated weekly by monitoring the total food consumption, measured as mean food consumption for 4 to 5 mice caged together.
Adeno-associated viruses preparation and injection
The AAV serotype rec2 with hLRRC8A-shRNA and mCherry reporter (AAVrec2-mCherry-U6- hLRRC8a-shRNA, 2.1 × 10¹³ vector genomes (vg/ml) were produced by Dr. Lei Cao's Laboratory as previously described.10 Scrambled non-targeting shRNA was used as a control (AAVrec2-mCherry-Scramble, 3.8 × 10¹³ vg/ml). Mice were anesthetized by isofluorane (1–4%), and placed in a prone position. Virus diluted in sterile PBS: 1 × 10¹¹ vg/100 µl was injected into the retro-orbital vein plexus using a 0.3 cc, 31G insulin syringe.
Immunoblotting
For adipose and liver Western blot, the fat pads and liver were harvested and then minced and homogenized in cold RIPA buffer (150 mM NaCl, 20 mM HEPES, 1% NP-40, 5 mM EDTA, PH 7.4) with added proteinase/phosphatase inhibitors (Roche). Lysates were then further lysed with 2 rounds of 10–20 seconds sonication, and centrifuged at 14,000 x g for 15 min at 4°C.
Supernatant was collected, and protein concentration determined using a DC protein assay kit (Bio-rad). For immunoblotting, equal amounts of protein (20 µg) were boiled with SDS loading buffer, electrophoretically separated in 10% SDS-PAGE gel (Bio-Rad) under reducing conditions and transferred to PVDF membranes (Bio-Rad). Membranes were blocked with 5% BSA in TBST buffer (0.2M Tris, 1.37M NaCl, 0.2% Tween20, pH 7.4) at room temperature for one hour, then incubated with primary antibody either at room temperature for 2 hours or 4°C overnight. Membranes were then incubated with corresponding secondary antibody (Bio-Rad, Goat-anti-rabbit #170-6515, 1:10000 dilutions) at room temperature for one hour. The signals were visualized by chemiluminescence (Pierce) and imaged using a ChemiDoc XRS+ imaging system (Bio-rad). Protein band intensities were analyzed using Image J software (National Institute of Health). The primary antibodies used in current study include anti-β-Actin (#8457 from Cell Signaling, at 1:1000 dilutions) and anti-SWELL1 (at 1:3000 dilutions) which is a rabbit polyclonal antibody that we generated against the peptide QRTKSRIEQGIVDRSE.
Metabolic phenotyping
The investigators were blinded to allocation during experiments and outcome assessment for all metabolic phenotyping. For glucose tolerance tests (GTT), mice were fasted for 6 hours. Glucose levels in tail blood were measured with a standard glucometer at the indicated times after an intraperitoneal (IP) injection of D-glucose (1g/kg BW for lean mice and AAV virus injected obese mice; 0.75g/kg BW for HFD mice). For insulin tolerance test (ITT), mice were fasted for 4 hours and blood glucose levels were measured at the above indicated times after an IP injection of insulin (HumulinR, 1U/kg BW for lean mice and AAV virus injected obese mice; 1.25U/kg BW for HFD mice). Mouse body composition (fat and lean mass, and water content) was measured by Nuclear Magnetic Resonance (NMR).9
Statistics
Statistical tests used are indicated in the figure legends. All statistical tests were performed using GraphPad Prism version 6.02 for Windows (GraphPad Software). Student's t-test was used for single comparisons, based on the data matching a normal distribution. 2-Way ANOVA was used for GTT and ITT analysis. Data are expressed as mean ± s.e.m. Unless specified, *p < 0.05, **p < 0.01, ***p < 0.001, and not significant (NS) p > 0.05.
Disclosure of potential conflicts of interest
No potential conflicts of interest were disclosed.
Funding
This work was supported by grants from the NIH NIDDK 1R01DK106009 (R.S.), the Roy J. Carver Trust (R.S.), and an American Heart Association Postdoctoral Award (Y.Z.).
References
- [1].Farnier C, Krief S, Blache M, Diot-Dupuy F, Mory G, Ferre P, Bazin R. Adipocyte functions are modulated by cell size change: potential involvement of an integrin/ERK signalling pathway. Int J Obes Relat Metab Disord. 2003;27:1178-86. doi: 10.1038/sj.ijo.0802399. PMID:14513065 [DOI] [PubMed] [Google Scholar]
- [2].Kim SM, Lun M, Wang M, Senyo SE, Guillermier C, Patwari P, Steinhauser ML. Loss of white adipose hyperplastic potential is associated with enhanced susceptibility to insulin resistance. Cell Metab. 2014;20:1049-58. doi: 10.1016/j.cmet.2014.10.010. PMID:25456741 [DOI] [PMC free article] [PubMed] [Google Scholar]
- [3].Salans LB, Knittle JL, Hirsch J. The role of adipose cell size and adipose tissue insulin sensitivity in the carbohydrate intolerance of human obesity. J Clin Invest. 1968;47:153-65. doi: 10.1172/JCI105705. PMID:16695937 [DOI] [PMC free article] [PubMed] [Google Scholar]
- [4].Heinonen S, Saarinen L, Naukkarinen J, Rodriguez A, Fruhbeck G, Hakkarainen A, Lundbom J, Lundbom N, Vuolteenaho K, Moilanen E, et al.. Adipocyte morphology and implications for metabolic derangements in acquired obesity. Int J Obes (Lond). 2014; 38:1423-31; doi: 10.1038/ijo.2014.31. PMID:24549139 [DOI] [PubMed] [Google Scholar]
- [5].Weyer C, Foley JE, Bogardus C, Tataranni PA, Pratley RE. Enlarged subcutaneous abdominal adipocyte size, but not obesity itself, predicts type II diabetes independent of insulin resistance. Diabetologia. 2000;43:1498-506. doi: 10.1007/s001250051560. PMID:11151758 [DOI] [PubMed] [Google Scholar]
- [6].Lonn M, Mehlig K, Bengtsson C, Lissner L. Adipocyte size predicts incidence of type 2 diabetes in women. FASEB J. 2010;24:326-31. doi: 10.1096/fj.09-133058. PMID:19741173 [DOI] [PubMed] [Google Scholar]
- [7].Voss FK, Ullrich F, Munch J, Lazarow K, Lutter D, Mah N, Andrade-Navarro MA, von Kries JP, Stauber T, Jentsch TJ. Identification of LRRC8 heteromers as an essential component of the volume-regulated anion channel VRAC. Science. 2014;344:634-8. doi: 10.1126/science.1252826. PMID:24790029 [DOI] [PubMed] [Google Scholar]
- [8].Qiu Z, Dubin AE, Mathur J, Tu B, Reddy K, Miraglia LJ, Reinhardt J, Orth AP, Patapoutian A. SWELL1, a Plasma Membrane Protein, Is an Essential Component of Volume- Regulated Anion Channel. Cell. 2014;157:447-58. doi: 10.1016/j.cell.2014.03.024. PMID:24725410 [DOI] [PMC free article] [PubMed] [Google Scholar]
- [9].Zhang Y, Xie L, Gunasekar SK, Tong D, Mishra A, Gibson WJ, Wang C, Fidler T, Marthaler B, Klingelhutz A, et al.. SWELL1 is a regulator of adipocyte size, insulin signalling and glucose homeostasis. Nat Cell Biol. 2017;19:504-517. doi: 10.1038/ncb3514. PMID:28436964 [DOI] [PMC free article] [PubMed] [Google Scholar]
- [10].Liu X, Magee D, Wang C, McMurphy T, Slater A, During M, Cao L. Adipose tissue insulin receptor knockdown via a new primate-derived hybrid recombinant AAV serotype. Molecular Therapy — Methods & Clinical Development. 2014;1:article 8:1-9; doi: 10.1038/mtm.2013.8 [DOI] [PMC free article] [PubMed] [Google Scholar]
- [11].Inoue H, Takahashi N, Okada Y, Konishi M. Volume-sensitive outwardly rectifying chloride channel in white adipocytes from normal and diabetic mice. Am J Physiol Cell Physiol. 2010;298:C900-9. doi: 10.1152/ajpcell.00450.2009. PMID:20107039 [DOI] [PubMed] [Google Scholar]