Abstract
Crowded environments modify the diffusion of macromolecules, generally slowing their movement and inducing transient anomalous subdiffusion. The presence of obstacles also modifies the kinetics and equilibrium behavior of tracers. While previous theoretical studies of particle diffusion have typically assumed either impenetrable obstacles or binding interactions that immobilize the particle, in many cellular contexts bound particles remain mobile. Examples include membrane proteins or lipids with some entry and diffusion within lipid domains and proteins that can enter into membraneless organelles or compartments such as the nucleolus. Using a lattice model, we studied the diffusive movement of tracer particles which bind to soft obstacles, allowing tracers and obstacles to occupy the same lattice site. For sticky obstacles, bound tracer particles are immobile, while for slippery obstacles, bound tracers can hop without penalty to adjacent obstacles. In both models, binding significantly alters tracer motion. The type and degree of motion while bound is a key determinant of the tracer mobility: slippery obstacles can allow nearly unhindered diffusion, even at high obstacle filling fraction. To mimic compartmentalization in a cell, we examined how obstacle size and a range of bound diffusion coefficients affect tracer dynamics. The behavior of the model is similar in two and three spatial dimensions. Our work has implications for protein movement and interactions within cells.
1 Introduction
The diffusion of macromolecules in crowded environments is generally slowed relative to the uncrowded case, and particle motion can undergo transient anomalous subdiffusion [1]. The motion of lipids or macromolecules within biological membranes can be affected by crowding [2–9], because the membrane contains both macromolecules and inhomogeneities in membrane composition [10, 11]. In the cell interior, macromolecules, organelles and other cellular structures can inhibit motion, or in contrast, enhance sampling of non-crowded regions [12]. Biological crowders can also contain interaction sites which further modify the macromolecular motion [13]. The kinetics and equilibrium behavior of interactions between mobile proteins can be modified by crowding [14, 15]. The magnitude of the effects of crowding on macromolecular motion and reactions is important to determine the limiting rate of biological processes such as signaling receptor activation.
Because of its biological importance, the effects of crowding on diffusion and macromolecular interactions have seen significant experimental and theoretical work [16, 17]. Lattice gas models have been used to demonstrate the effects of crowding [18, 19], binding [20, 21], and repulsion [22] on the diffusion of tracer particles. These effects—including transient anomalous diffusion at short times and hindered normal diffusion at long times—have been studied for both immobile [23] and mobile obstacles [24, 25].
Although most theoretical work has focused on anomalous diffusion in crowded systems made up of impenetrable obstacles with attractive or repulsive surfaces [18–20, 22, 26], there is growing evidence of the importance of soft compartments and barriers in biological systems. In membranes, lipids can be only partially excluded from lipid rafts or domains. When they do interact, they can still diffuse within them [27–30]. Lipid motion can be hindered, though not stopped, near α-synuclein protein aggregates [31]. For all of these cases, theoretical considerations of a two-dimensional system should include the effects of the soft interaction potentials and bound-state mobility.
Inside the cell, intrinsically disordered or low-complexity domains can act as soft obstacles or wells, with rapid diffusion within the wells. Membrane-less organelles spontaneously form from low-complexity domain proteins. They are typically highly dynamic assemblies [32], which show fast intra-particle diffusion times, and allow rapid entry and exit of constituents [33]. Proteins which interact with intrinsically disordered proteins can still diffuse during the binding interaction [34, 35]. This effect may be particularly pronounced in the central channel of the nuclear pore complex, which contains a high density of binding sites on intrinsically disordered domains. Recent simulation work suggests that the disordered protein binding pockets can exchange on transport factors [35], providing a clear mechanism for mobility while bound to an obstacle. Particles are weakly excluded from individual disordered protein chains due to the lowering of the polymer chain entropy [36], but are expected to allow other macromolecules to enter, and pass through, the space that they occupy. The increasingly recognized importance of proteins which are intrinsically disordered or contain low-complexity domains within their assemblies warrants a more careful consideration of the differences between the previously well-studied models, in which binding immobilizes the bound species, and a model which includes soft interactions and obstacles or barriers in which the bound species may remain mobile.
Motivated by the biological importance of binding interactions which can retain mobility of the bound particle, we studied a minimal model with bound tracer mobility (figure 1). In our model, tracer particles move on a 2D or 3D lattice in the presence of immobile obstacles, to which the tracers can bind. A primary distinction between our model and many others that consider binding or adhesion is that others typically consider adhesion between a tracer and an adjacent hard obstacle, in which there is no overlap between tracers and a hard obstacles core [20, 22, 24]. Here, obstacles are soft: tracer particles can overlap with obstacles, with an energy penalty (or gain) ΔG upon moving to a lattice site occupied by an obstacle. Unlike previous work modeling lipid rafts, we closely examine the dependence on binding, instead of just pure exclusion or free entry into lipid regions [4].
Figure 1.
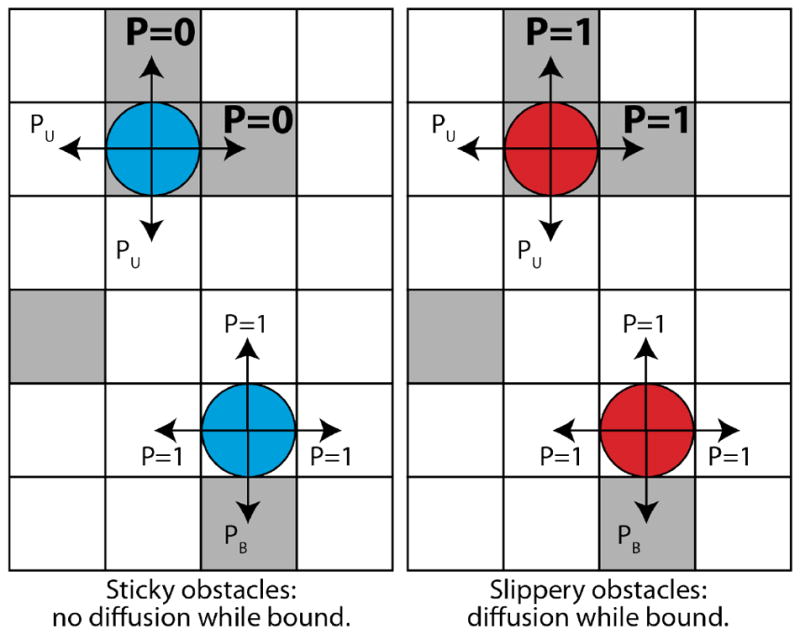
Model schematic. Tracers (colored circles) hop on a lattice of empty sites (white squares) and obstacles (gray squares). Tracer binding with a soft interaction potential allows them to overlap with obstacles (top). For sticky obstacles, the only allowed moves of a bound tracer are to empty sites (unbinding). For slippery obstacles, tracers can hop to other obstacles while remaining bound. Arrows denote possible moves and P the probability that a given move is accepted.
To understand the effects of bound mobililty, we first consider the limits of ‘sticky obstacles’, in which tracers are immobile while bound, and ‘slippery obstacles’, in which tracers are mobile while bound. We use lattice Monte Carlo methods to explore a range binding energy and obstacle filling fraction. We also examine the effects of semi-sticky obstacles—i.e., intermediate bound diffusion coefficient—and obstacle size effects, which demonstrates how diffusion is altered in a crowded environment with compartments with different properties—such as a cell [21]—is altered. Our results demonstrate how binding and bound-state motion independently impact particle dynamics, including long-time normal diffusion and anomalous diffusion. Bound tracer mobility increases the long-time diffusion coefficient, reduces the transient anomalous time, and eliminates caging for all times typically observed above the percolation threshold. These results demonstrate that mobility of bound particles can benefit biological systems by allowing mobility even in highly crowded environments.
2 Model
Our model seeks to build on stochastic lattice-gas models that have been important to understanding tracer dynamics in the presence of immobile and mobile hard obstacles [18], anomalous subdiffusion [19], and effects of binding on diffusion [20]. Saxton showed that the tracer diffusion coefficient drops to zero at the percolation threshold, the critical concentration of obstacles at which a continuous path of vacancies through which a tracer can move no longer exists. Above this percolation threshold, diffusion is anomalous at long times. The effects of tracer and obstacle size [26, 37, 38] and adhesion and repulsion to sites adjacent to obstacles [22] on transient subdiffusion and long-time diffusion have been studied. Extensions to mobile obstacles which interact with each other have demonstrated how obstacle clustering dynamics can influence the diffusivity of tracers [39]. Numerically exact methods for calculating diffusion coefficients using the Nernst-Einstein relation [40, 41] and Markov chains [42] have been implemented as a different approach to analyzing these systems; the Nernst-Einstein approach can lower the computational cost of measuring diffusion coefficients for lattice gases [37]. Protein motion in polymer networks has been studied using random-walk and self-avoiding-chain models for immobile [43] and mobile [24, 44] hard chains. Studies of chains with binding sites found that modeling chain dynamics allowed a mapping onto randomly distributed obstacles with an effective volume, and showed how sliding along a defined chain can effect tracer dynamics [44, 45]. In some previous work, the effects of binding and sliding while bound were entangled because both effects were encoded by a single parameter [44, 45]. Domains with different diffusion coefficients and sizes—to model lipid rafts—have been studied, but the analysis only included total or no exclusion although it was noted that binding effects could play a large role [4].
In our model, tracer particles undergo a random walk on a square lattice and interact with immobile obstacles. The interaction is characterized by a binding free energy; for simplicity, we neglect any additional activation barrier. The characteristic binding free energy change of a tracer that hops from an empty site to an obstacle site is ΔG (in units where kBT = 1). We consider both attractive (ΔG < 0) and repulsive (ΔG > 0) obstacles. We use the Metropolis algorithm [46] to accept or reject candidate binding (probability PB) and unbinding (probability PU) events. Each tracer occupies a single site lattice site, but the obstacle size is varied to represent domains of characteristic size. Obstacles are squares with sides of length lobst, measured in units of the lattice spacing.
To study the effects of tracer particle motion while bound, we considered the limits of perfectly sticky and slippery obstacles (fig. 1), as well as the intermediate ‘semi-slippery’ case. In all models, obstacles are soft, so that tracers overlap with obstacles when bound. For sticky obstacles, no hopping between obstacle sites can occur, but tracers can exit an obstacle in any direction that would move the tracer to an unoccupied site. For slippery obstacles, tracers can hop between adjoining obstacles while remaining bound. In the limit of perfectly slippery obstacles, in which bound motion is identical to unbound motion, there is no difference in hopping rates between free and bound tracers. For semi-slippery obstacles, we vary the bound diffusion coefficient.
2.1 Simulation methods
In our kinetic Monte Carlo scheme, at each time step a tracer attempts a move in a randomly chosen direction. Moves from empty → empty are always accepted, empty → obstacle moves are accepted with probability min(e−ΔG, 1), obstacle → empty moves are accepted with probability min(eΔG, 1), and obstacle → obstacle moves are always accepted/rejected if obstacles are slippery/sticky (fig. 1); for semi-slippery obstacles, the acceptance probability is Dbound/Dfree. If a tracer’s move is rejected, it remains immobile for that time step. We assume noninteracting tracers.
Initially, obstacles were uniformly randomly placed on the lattice, at the specified filling fraction, without overlaps. Next, tracers were randomly placed on obstacles and empty sites at their equilibrium occupancy, as determined by the filling fraction of obstacles ν, and binding energy ΔG. The fraction of tracers on obstacles is proportional to the obstacle filling fraction times the Boltzmann factor, νe−ΔG, while the fraction of tracers on empty sites is proportional to the fraction of empty sites, (1 − ν). The equilibrium fraction of tracers on obstacles of size 1 is then
| (1) |
Using an initial fraction of tracers bound to obstacles determined from fo avoids the time required for binding equilibration in the simulations, ensuring that mean-squared displacement measurements are independent of a time origin.
We performed 2D simulations with 200 tracers on a 256 × 256 periodic lattice for 105 – 107.5 time steps, with recording interval of 10 – 100 steps. For each parameter set (determined by filling fraction and binding energy), we averaged over 96 separate obstacle configurations. We varied ν from 0 to 1 and ΔG from −5 to 10. 3D simulations used similar parameters with a 256×256×256 periodic lattice. In the semi-slippery case, we varied the ratio of bound to free diffusion coefficient Dbound/Dfree between 0 (perfectly sticky) and 1 (perfectly slippery) in steps of 0.2, for binding energies ΔG = 1, 2, 3, ∞ for two filling fractions, ν = 0.3 and 0.6. When varying obstacle size, we used square obstacles with the length of a side, lobst, equal to odd values from 1 to 15.
2.2 Trajectory analysis
We determined tracer mean-squared displacement (MSD) as a function of time delay by averaging over all tracers, 100 randomly selected independent time origins, and obstacle configuration. For long time delays for which 100 independent time intervals were not available, we averaged over the maximum number of independent time intervals. As previously mentioned, averaging over time windows improves our statistics; note that the time origins are not unique, since the placement of tracers in their equilibrium binding distribution ensures that there is no initial binding equilibration time. We have verified that that are no aging effects [47, 48], i.e., MSD measurements that depends on simulation time, in our model (data not shown).
We sought to quantify the effects of binding and obstacle filling fraction on tracer mobility. In systems with either purely Fickian diffusion or particular obstacle geometry, the mean-squared displacement grows as a power law in time:
| (2) |
where 〈r2〉 is the ensemble-, time-origin-, and obstacle-configuration-averaged mean-squared displacement, d is the spatial dimension, D is the diffusion coefficient, α is the diffusion scaling exponent, and t is the time delay. This fractional diffusion equation has been studied extensively [49], both because it emerges from certain microscopic theories and as a means to quantify anomalous random walks. Fractional diffusion has been experimentally measured in cells, using fluorescence recovery after photobleaching [50], fluorescence correlation spectroscopy [51], and single-particle tracking [52]. For hard obstacles, α reflects the non-homogeneity and fractal structure of a cluster. In this case, α can be thought of as a measure of a local landscape, in which obstacles have the possibility of trapping a tracer and introducing memory effects into the system. The value of α does not quantify the time it takes to escape a trapping cage; but α < 1 suggests the possibility that the landscape can cage tracers. In the α → 0 limit, a tracer is fully caged, and the α → 1 limit represents Fickian diffusion.
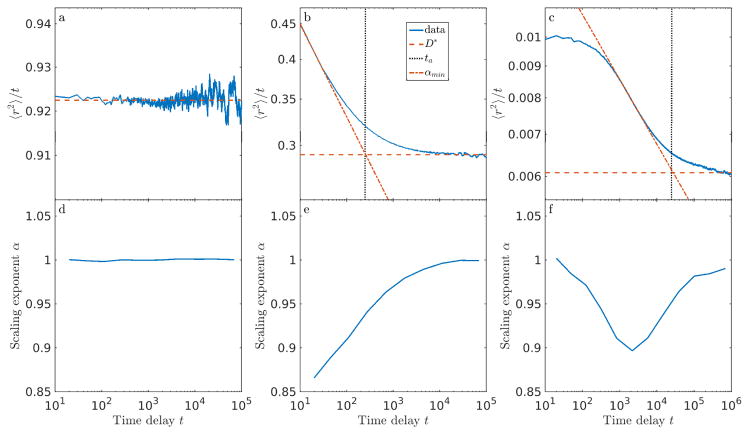
However, many systems have more complex dynamics that are not power law. For example, tracer dynamics can be transiently anomalous: subdiffusive on short time scales and Fickian on longer time scales (fig. 2b). The dynamics can be quantified using a phenomenological approximation in which the exponent α is treated as time dependent [19, 26, 37, 38, 42, 53]. Thus, r2 ~ tα holds only over particular time scales.
Figure 2.
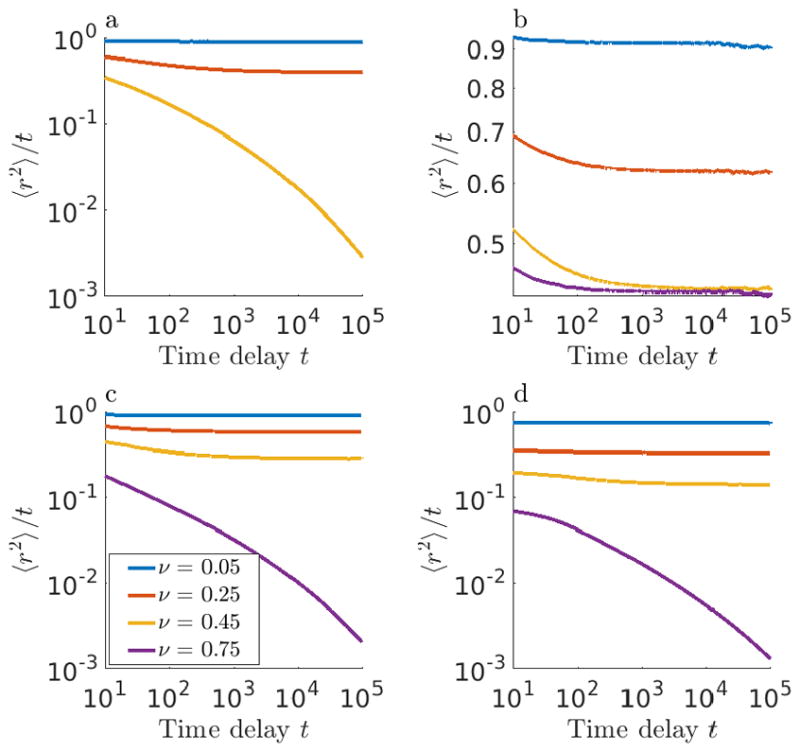
Mean-squared displacement 〈r2〉 divided by time delay t as a function of time delay t for (a) impenetrable obstacles, (b) repulsive slippery obstacles (ΔG = 2), (c) repulsive sticky obstacles (ΔG = 2), and (d) attractive sticky obstacles (ΔG = −2). Different colors correspond to different filling fraction ν. Curves with non-zero slope indicate anomalous diffusion, and the horizontal asymptote indicates the long-time diffusion coefficient. Each curve represents an average over tracers, independent time windows, and obstacle configurations.
For non-power-law dynamics, we can apply equation 2 locally, with a phenomenological, time-varying exponent. Then α(t) is defined by local fitting to the the logarithm of :
| (3) |
so that α(t) − 1 is the local slope of the versus t curve on a log-log plot. As seen in figs. 2 and 3, the instantaneous effective α varies with delay time. Thus, a power-law MSD scaling with time, such as can arise from fractional Brownian dynamics, does not encompass the complexity of our crowded diffusion model, as has been found previously [8, 38].
Figure 3.
Top panel: Illustration of fitting procedure, showing 〈r2〉/t vs time delay t for simulation data (blue), line fitted to horizontal asymptote (red dashes), line tangent to point of maximum absolute slope of the curve (red dash-dots), and anomalous time ta (black dots) for different parameters. Bottom panel: instantaneous scaling exponent α vs time delay t. (a, d) Slippery obstacles with ΔG = 1, ν = 0.95: normal diffusion occurs for all measured time. (b, e) Sticky obstacles with ΔG = 2, ν = 0.45. (c, f) Sticky obstacles with ΔG = −5, ν = 0.50.
At short time, our model typically exhibits anomalous diffusion. However, in some conditions, the short-time behavior is diffusive, with an intermediate anomalous regime. We defined αmin as the minimum instantaneous value of α (the most anomalous exponent). We characterized the transition between short-or intermediate-time anomalous diffusion and long-time normal diffusion by the time scale ta, determined as the intersection of the horizontal long-time asymptote of with a line tangent to the point of the maximum rate of decrease of this curve (fig. 3b,c). We found that this transition time could be robustly determined for a wide range of diffusion coefficients and anomalous behavior. We denote ta the anomalous time. Qualitatively, it is the crossover time from short-time subdiffusion to long-time Fickian diffusion. While αmin characterizes how trapped a tracer is, ta quantifies how long it takes a tracer to escape a cage.
We defined the long-time Fickian diffusion coefficient as
| (4) |
All diffusion coefficient measurements are expressed in terms of the scaled diffusion coefficient , where is the diffusion coefficient in the absence of obstacles, where l is the distance between lattice sites (here defined to be 1), and τ the time interval between steps (also set to 1).
In some cases, we were unable to determine all of D*, αmin, and ta. For some parameter sets, the slope of vs. t on a log-log plot approached a non-zero constant, indicating that diffusion was anomalous over all measured time delays, so that the Fickian diffusion coefficient was not well-defined. For other parameter sets, the versus t curve did not reached a clear asymptote during the simulation time. We therefore could not determine D*, but could measure αmin. When tracer diffusion was normal over all or nearly all measured time delays, neither αmin nor ta were well-defined, but D* could be measured.
3 Sticky soft obstacles
We initially focus on the limit of perfectly sticky obstacles of size 1, to determine the effects of stickiness, filling fraction, and binding energy on tracer motion. We varied parameters over a wider range for the 2D model, with a comparison to 3D results for some parameter sets.
For sticky obstacles, the motion of a bound tracer to an adjacent obstacle is prohibited. This could occur, for example, because the net free energy cost of binding to an obstacle is a result of an attractive binding interaction, with a high free energy barrier to moving to an adjacent site. Here, we consider the limit that the free energy cost of moving to an adjacent obstacle is so large that it approaches infinity. This situation provides an important point of comparison to explicitly test the effects of bound-state diffusion on tracer behavior.
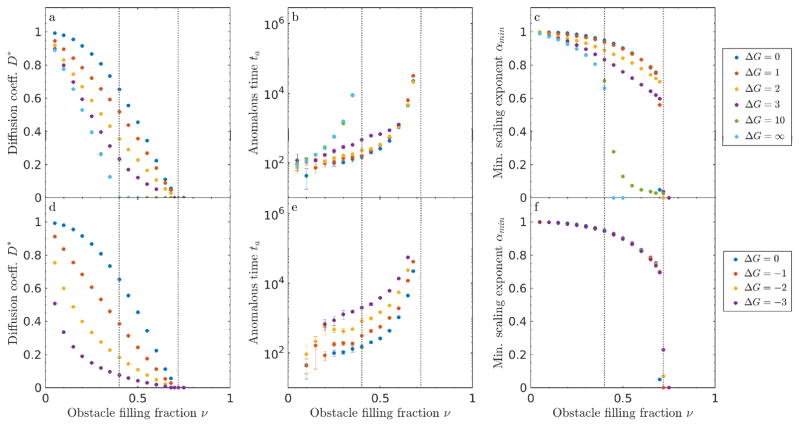
We separately consider repulsive and attractive obstacles (fig. 4). Note that we include the case ΔG = 0, that is, where the binding interactions are neither attractive nor repulsive, but still block moves to adjacent obstacles. We define the lower critical occupancy νl as the filling fraction at which the diffusion is non-Fickian for all time scales for impenetrable obstacles (ΔG = ∞). In the limit of a hard repulsive obstacle, D* decreases with filling fraction, and approaches zero at the percolation threshold expected for hard obstacles on a square lattice, νl ≈ 0.4 [54], where ta diverges [18]. The lower critical occupancy is the percolation threshold, at which there is no longer a continuous path of empty sites (fig. 5).
Figure 4.
Sticky obstacles of size 1 in 2D. (a, d) Diffusion coefficient D*, (b, e) anomalous time ta, and (c, f) minimum scaling exponent αmin as a function of obstacle filling fraction ν for positive (top) and attractive (lower) binding energy. Note that points for ΔG = 10 are partially hidden behind ΔG = ∞. The approximate locations of the critical occupancies νl and νu are indicated with gray dotted lines.
Figure 5.
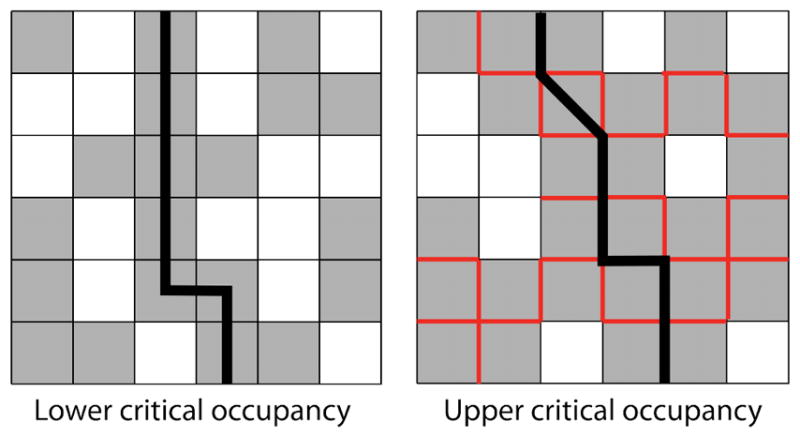
The two types of percolation threshold in our lattice model: the lower critical occupancy νl (left) and the upper critical occupancy νu (right). For the lower critical occupancy, which is the standard percolation threshold, the percolating network is the obstacles. At the upper critical occupancy, the percolating network is the interface between two or more obstacles. The barrier to tracer motion is shown as a black lines; obstacle-obstacle boundaries which cannot be crossed by a tracer in the sticky model are shown in red. Without binding, tracers cannot pass through the lower percolating network. If they can bind, tracers can ‘hop through’ the lower percolation barrier with or without bound motion.
For finite binding free energy in our model, Fickian diffusion can still occur above the percolation threshold νl because soft binding allows tracers to ‘hop through’ single obstacles via binding and unbinding. Without soft binding of the type we consider, obstacle percolation would prevent a tracer from moving between vacancy clusters. In other words, tracers that start in an area caged by obstacles are stuck there. With soft binding, tracers that start in a cage can hop onto an obstacle and then hop off into a new vacancy cluster. For soft binding interactions and sticky obstacles, there is an upper critical occupancy νu ≈ 0.72 at which the long-time diffusion coefficient approaches zero irrespective of binding energy (fig. 4). Above νu, tracers become caged regardless of the binding kinetics. Therefore, there is a different type of percolating network above the upper critical occupancy: the percolation of the inter-obstacle boundary (fig. 5). At the upper critical occupancy, there is a second adjacent obstacle preventing the tracer from ‘hopping through.’ Note that as expected, the transition time ta appears to diverge on the approach to the upper critical occupancy (fig. 4). We are unaware of a theoretical value for this percolating density, but our results suggest its approximate value is 0.72 in 2D (fig. 4).
Intermediate repulsive binding energy leads to intermediate behavior, as expected. For strong repulsion, e.g., ΔG = 5, D* remains small, though clearly non-zero, up to the upper critical occupancy, while ta monotonically increases until it diverges at νu.
Anomalous dynamics appear in the slope of 〈r2〉/t on a log-log plot. The most anomalous behavior occurs when the scaling coefficient α reaches its smallest value, αmin. We find that αmin decreases with filling fraction and binding energy (fig. 4c). Adding more obstacles and increasing the repulsion causes greater hindrance of tracer motion. We note that αmin ≈ 0.7 near νl for impenetrable obstacles, as found previously [4, 19]. Finite repulsive binding energy leads to a smaller exponent (αmin < 0.7) than the infinite case at filling fraction above νl. For lower values of ΔG, the scaling coefficient does not go to zero at the upper critical occupancy νu. Note that the sharp cutoff with filling fraction occurs because we did not collect data past νu.
Sticky obstacles with attractive binding interactions show a more rapid falloff in the diffusion coefficient and larger anomalous time (fig. 4). The upper critical density νu ≈ 0.72 is in the same vicinity as for ΔG > 0. The dependencies of the diffusion coefficient on filling fraction for positive and negative binding energy are similar for low magnitude of the binding energy, but the diffusion coefficient falls off more rapidly with filling fraction for highly attractive obstacles. This occurs because an attractive obstacle confines a tracer in one position until it escapes, while a repulsive obstacle only impedes tracer motion for one time step. Therefore, repulsive interactions require several obstacles to transiently confine a tracer, while a single attractive obstacle can cause confinement. Note that we did not include large attractive binding free energy in our analysis.
For attractive obstacles, αmin is independent of binding energy over the range we studied (fig. 4). The characteristic time for a tracer to unbind from an attractive obstacle depends on the binding energy, leading to the energy-dependent variation in the anomalous time we observe. However, it is properties of the obstacle arrangement, rather than of binding, which determine the shape of the MSD curve, and therefore the αmin. The minimum anomalous exponent occurs when tracers are, on average, confined to a cage formed by inter-obstacle boundaries and single-site wells. Therefore, the minimum anomalous exponent is approximately the same for all binding energy, but varies with filling fraction.
We note that the sticky soft obstacle model studied here does not simply map to the impenetrable obstacles at a lower effective obstacle filling fraction. Such a mapping cannot be made because tracers can ‘hop through’ single obstacles via binding, while never being able to hop between obstacles. Sticky obstacles allow for move attempts—and blocks—that would never be attempted in the impenetrable case.
3.1 Sticky soft obstacles in 3D
We extended our study of single-site sticky repulsive obstacles to three dimensions, to determine whether the spatial dimension plays a key role in the tracer behavior (fig. 6). The results are qualitatively the same as the 2D model (fig. 4). However, in 3D, the lower and upper critical occupancies appear at higher filling fraction: a higher obstacle filling fraction is required to percolate a 3D lattice. The anomalous time is also typically smaller in 3D. For soft sticky obstacles, increasing the spatial dimension does not change the qualitative features of our model, but does shift the critical occupancies and anomalous time.
Figure 6.
Sticky obstacles of size one in 3D. (a) Diffusion coefficient D*, (b) anomalous time ta, and (c) minimum scaling exponent αmin as a function of obstacle filling fraction. The approximate locations of the critical occupancies νl and νu are indicated with gray dotted lines.
4 Slippery soft obstacles
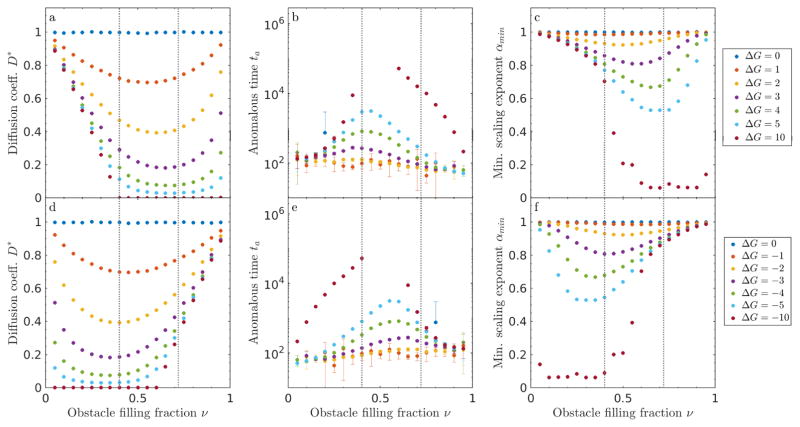
When obstacles are perfectly slippery, bound tracers can hop to adjacent obstacles without penalty. Our model of perfectly slippery obstacles contains an occupancy-energy inversion symmetry: the dynamics are invariant to changing the filling fraction by switching obstacles and empty sites (ν → 1 − ν) while simultaneously switching the sign of the binding energy (ΔG → −ΔG). In other words, a low filling fraction of attractive obstacles is equivalent to a high filling fraction of repulsive barriers (fig. 7).
Figure 7.
Slippery obstacles in 2D. (a, d) Diffusion coefficient D*, (b, e) anomalous time ta, and (c, f) minimum scaling exponent αmin as a function of obstacle filling fraction ν for positive (top) and attractive (lower) binding energy. The approximate locations of the critical occupancies νl and νu are indicated with gray dotted lines.
Slippery obstacles remove the obstacle percolation threshold for all measured binding energies (fig. 7). The curves for ΔG = 10 for the repulsive slippery obstacles qualitatively resemble the sticky case (fig. 4), because the diffusion coefficient approaches zero for ν ≈ 0.4. However, for slippery obstacles, the anomalous time increases, but does not diverge, at the percolation threshold, and then decreases at larger filling fraction. For slippery obstacles with finite ΔG, one can always find a time after which the system displays normal diffusion. Slippery obstacles lead to non-monotonic behavior: for large enough ν, the diffusion coefficient increases and anomalous time decreases. For high obstacle filling fraction, binding increases tracer mobility, because they can hop along the percolating network of obstacles. Similarly, the minimum exponent is non-monotonic with filling fraction.
4.1 Slippery soft obstacles in 3D
As for sticky obstacles, we examined tracer motion with single-site slippery obstacles in three dimensions (fig. 8). The results are qualitatively the same as the 2D model (fig. 7), with typically smaller anomalous time.
Figure 8.
Slippery obstacles of size 1 in 3D. (a) Diffusion coefficient D*, (b) anomalous time ta, and (c) minimum scaling exponent αmin as a function of obstacle filling fraction ν. The approximate locations of the critical occupancies νl and νu are indicated with gray dotted lines.
4.2 Comparison of sticky and slippery obstacles in 2D
The limits of perfectly sticky and slippery obstacles are most similar at low filling fraction (fig. 9). In general, slippery obstacles lead to exponents closer to one (less anomalous) than do sticky obstacles, because tracers are not caged by the obstacle-obstacle interface. Even for relatively small values of the binding energy (|ΔG| ≤ 3) and intermediate filling fraction, sticky and slippery obstacles lead to significantly different tracer dynamics (fig. 9). Slippery obstacles, on which motion can occur for high obstacle filling fraction, allow normal diffusion with coefficients comparable to those for low filling fraction. This effect may be important to explain the rates of a number of biological processes that are diffusion-limited, including transcriptional regulation and nucleo-cytoplasmic transport.
Figure 9.
Comparison of models with slippery repulsive obstacles (solid lines), sticky repulsive obstacles (dashed lines), and hard repulsive obstacles (purple dashed line). (a) Diffusion coefficient D*, (b) anomalous time ta, and (c) minimum scaling exponent αmin as a function of obstacle filling fraction ν. The gray dotted lines are indicating the approximate locations of critical occupancies νl and νu.
5 Semi-slippery obstacles
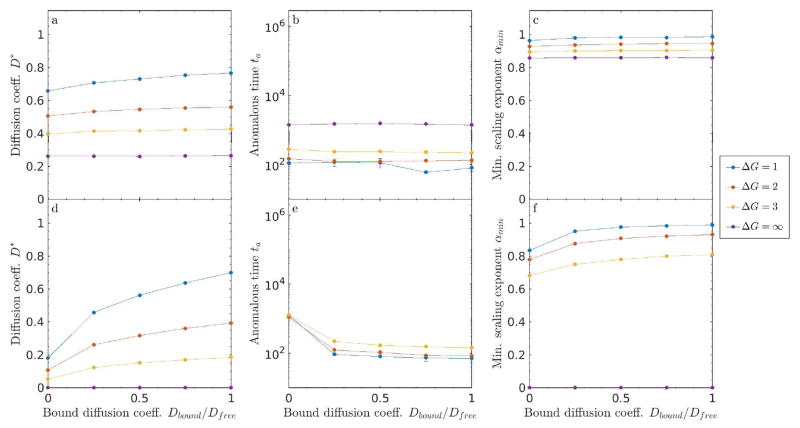
Having compared the limits of perfectly sticky (Dbound = 0) and slippery (Dbound = Dfree) obstacles, we now study intermediate cases. We varied the bound diffusion coefficient for repulsive binding energy ΔG = 1, 2, 3,∞ and filling fraction ν = 0.3 and 0.6. For finite binding energy, increasing Dbound increases the long-time diffusion coefficient (fig. 10). This effect is larger for higher filling fraction and lower binding energy, when tracers spend more time bound. Varying Dbound has little effect on the anomalous time at low filling fraction, because ta is already near the threshold at which we can accurately measure it. However, increasing Dbound decreases ta at higher filling fraction, because tracers can more quickly escape obstacles when their bound diffusion coefficient is larger. Similarly, varying Dbound has little effect on αmin at low ν, but does make diffusion less anomalous at higher filling fraction, because increasing bound motility reduces tracer caging.
Figure 10.
Semi-slippery obstacles in 2D. Varied the bound diffusion coefficient from the sticky Dbound = 0 to slippery Dbound = Dfree limit for single site lobst = 1 obstacles. Top panel: (a, d) Diffusion coefficient D*, (b, e) anomalous time ta, and (c, f) minimum scaling exponent αmin as function of Dbound for low filling fraction ν = 0.3 (top) and high filling fraction ν = 0.6 (bottom).
6 Varying obstacle size
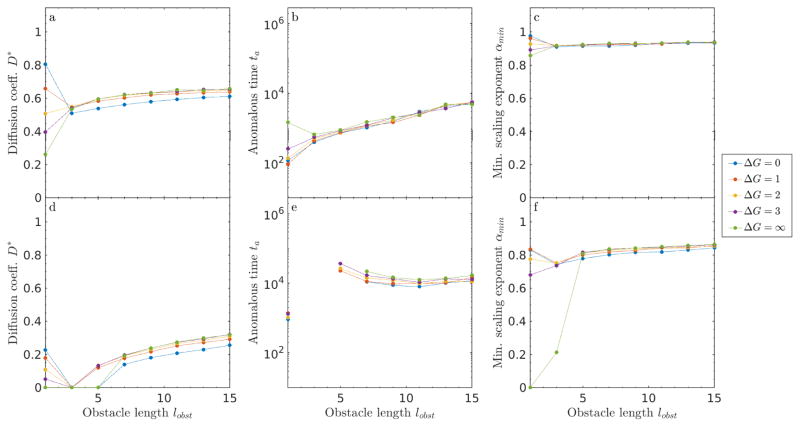
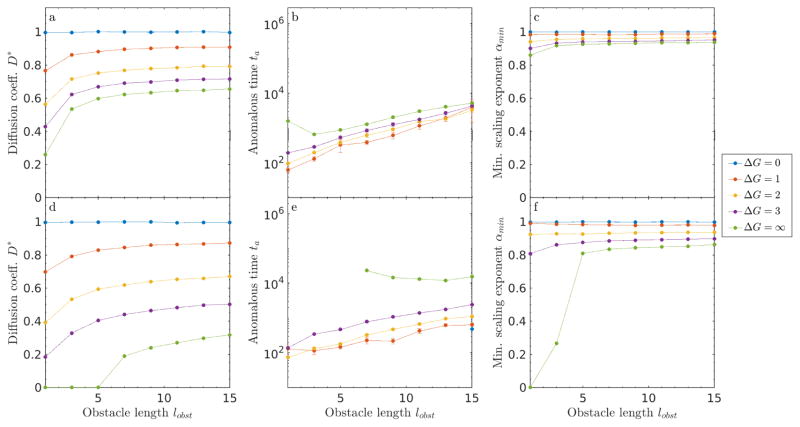
We varied the length of the obstacles lobst, while maintaining their square shape. Increasing the obstacle size (with filling fraction fixed) clusters obstacles. Since in our model the binding penalty occurs only for empty → obstacle moves, increasing the size of obstacles effectively reduces the number of binding sites: more obstacle sites are interior to obstacles, rather than on their perimeter. For sticky obstacles with lobst = 1, tracers can easily hop through cages, since their bound motion is only blocked by an obstacle-obstacle interface. Increasing the obstacle size guarantees that individual obstacles will contain an obstacle-obstacle interface, which makes it less likely that tracers can hop through neighboring obstacles (fig. 11). Increasing obstacle size at fixed filling fraction also increases the typical distance between obstacles. These changes alter obstacle percolation effects: νl and νu depend on lobst.
Figure 11.
Cartoon showing size effects for sticky and impenetrable obstacles. Red lines indicate borders between obstacles that cannot be crossed by a tracer.
6.1 Sticky obstacles of varying size
First, we examined tracer dynamics on sticky obstacles of variable size (fig. 12). Qualitatively, large sticky obstacles have a soft surface (binding can occur on surface sites, although hops along the surface are still blocked), but a hard core (interior sites are inaccessible). A significant change in dynamics occur when lobst increases above 1. Any obstacle with lobst > 1 is fundamentally different from lobst = 1, because larger obstacles are guaranteed to contain sites with an adjacent obstacle site. Increasing lobst prevents hopping across the interior of any one obstacle, which can hinder tracer motion. The cages are thus more robust. Tracers can still hop across corners, unlike in the case of a purely repulsive interaction (fig. 11).
Figure 12.
Size effects for sticky obstacles in 2D. (a, d) Diffusion coefficient D*, (b, e) anomalous time ta, and (c, f) minimum scaling exponent αmin as a function of obstacle filling fraction ν for ν = 0.3 (top) and ν = 0.6 (lower).
The dependence of tracer dynamics on binding energy changes upon increasing the obstacle size above 1 (fig. 12). For size-one obstacles, particles can hop through a single obstacle, and so lower binding energy leads to higher long-time diffusion coefficient. In contrast, with larger obstacles, high binding energy leads to an increased diffusion coefficient. With higher repulsion, a tracer is less likely to bind to the surface of an obstacle where it can get stuck. Thus, for larger obstacles, higher repulsion can facilitate motion.
For lobst > 3, increasing obstacle size increases the cage size, and so the long-term diffusion coefficient and the anomalous time both increase smoothly, in agreement with previous work on impenetrable obstacles [26]. The anomalous time increases with lobst above 3, because the effective cage size increases: tracers take longer to explore a cage to escape. For lobst ≥ 3 and small filling fraction, the size dependence is roughly energy independent. The dynamics are dominated by blocked obstacle → obstacle moves, rather than by the energy dependence of empty → obstacle moves. For low filling fraction, αmin remains > 0.9, suggesting that obstacle caging effects are minimal.
Next, we examined a higher packing fraction ν = 0.6, chosen because it is between νl and νu for size-1 obstacles in 2D. The effects of obstacle size on percolation are significant, leading to larger changes in behavior than for ν = 0.3. As lobst increases, obstacles are on average spaced farther apart, which increases νl.
In contrast, the upper critical concentration is more complicated, because now each obstacle contains within it obstacle-obstacle interfaces. The upper critical concentration decreases below 0.6 for lobst = 3, and therefore the dynamics are anomalous at all times; ta diverges and D* goes to zero. Above lobst = 3, the upper critical concentration increases with increasing obstacle size. For lobst = 5, νu > 0.6, leading to long-time Fickian diffusion. Here ta decreases with lobst, because the time required for a tracer escape a cage is not dominated by the cage size (as it was for low ν), but by the time needed to find a gap between cages. As lobst increases, the gaps become larger on average, lowering the escape time. Overall, above lobst = 5, the behavior is only mildly dependent on either obstacle size or binding energy, making the long term diffusivities primarily a function of the filling fraction.
6.2 Slippery obstacles of varying size
Understanding the effects of variable obstacle size on tracer motion is more straightforward for the case of slippery obstacles, because the difference between edge and interior obstacle sites is eliminated (fig. 13). In the perfectly slippery limit, increasing lobst effectively lowers the number of binding sites: tracers experience the binding energy change only when binding to obstacle edge sites, but can move freely through obstacle interior sites. Therefore, D* and αmin increase with obstacle size, an effect that is larger for higher filling fraction, because obstacle overlaps at high filling fraction lower the fraction of obstacles that impede motion and cage tracers. In nearly all cases, ta increases with obstacle size, because the effective cage size grows. The exception occurs for impenetrable obstacles, where increasing lobst increases the size of vacancies between cages, allowing caged tracers to escape more quickly.
Figure 13.
Size effects for slippery obstacles in 2D. (a, d) Diffusion coefficient D*, (b, e) anomalous time ta, and (c, f) minimum scaling exponent αmin as a function of obstacle filling fraction ν for ν = 0.3 (top) and ν = 0.6 (lower).
7 Conclusion
In this paper, we have studied a lattice model of tracer particles that diffuse and experience crowding due to immobile obstacles. While most previous work has considered hard (impenetrable) obstacles, we consider soft (penetrable) obstacles characterized by a binding free energy that allows tracers to overlap with obstacles. We also consider the effects of varying the tracer mobility while bound, including the limiting cases of ‘sticky’ obstacles (which immobilize bound tracers) and ‘slippery’ obstacles (which allow full tracer mobility), as well as the intermediate regime between the two.
In some cases, diffusion crowded media leads to dynamics that are anomalous (r2 ~ tα) with a constant α [1]. However, our system typically does not give a power-law dependence of the MSD on time delay; this has been seen by others [8, 38]. As a result, we quantified a long-time diffusion constant (D*), the timescale on which the systems transitions from anomalous to Fickian (ta), and the minimum instantaneous anomalous exponent (αmin).
Our results demonstrate the key differences between sticky and slippery obstacles. For sticky obstacles, increasing the obstacle filling fraction decreases the diffusion coefficient and increases the degree of anomalous diffusion. Above an upper critical occupancy νu ≈ 0.72 in 2D, diffusion becomes anomalous at all times, independent of binding energy. In the sticky case, the minimum anomalous exponent, αmin monotonically decreases with filling fraction, because adding more obstacles creates more cages in which tracers become transiently confined.
For slippery obstacles, by contrast, tracers always reach normal diffusion after a sufficiently long time; even increasing the filling fraction above the percolation threshold does not eliminate tracer motion. For nonzero binding free energy, we find a novel non-monotonic dependence of D* on filling fraction: increasing the filling fraction away from zero introduces binding sites that slow tracer diffusion, but for sufficiently high filling fraction, bound mobility allows tracer motion along clusters of obstacles. The anomalous exponent decreases with binding energy magnitude, but varies non-monotonically with filling fraction. For low filling fraction, αmin decreases as more obstacles are added, because binding transiently traps tracers on isolated obstacles. For sufficiently high density, diffusion becomes more normal when tracers hop along clusters of obstacles while bound.
For intermediate ‘semi-slippery’ obstacles, we demonstrate that in the crossover from from sticky to slippery behavior, D*, αmin, and ta vary smoothly. Increasing bound diffusion always makes the diffusion coefficient larger and the diffusive motion less anomalous.
We varied obstacle size to examine how relatively large obstacle ‘domains’ affects tracer motion in our model. For sticky obstacles, increasing obstacle size above 1 led to a sharp jump in tracer properties. This occurs because larger obstacles always contain interior obstacle sites, which are inaccessible to tracers in the sticky model. For large obstacles, increasing repulsive binding energy tends to increase the tracer diffusion coefficient, because tracers spend less time trapped in a binding site.
For slippery obstacles, perimeter and interior obstacle sites are both accessible, which means that varying obstacle size has effects that are easier to understand intuitively. The diffusion coefficient and anomalous exponent increase with obstacle size, because larger obstacles lead to a fewer obstacle-empty boundaries. The effect of obstacle size on ta varied with filling fraction, due to competing effects on increasing cage size and increasing gaps between cages.
Our models separately represent effects of soft interactions (through the binding energy) and bound-state motion (through obstacle stickiness/slipperiness). Sticky and slippery obstacles show dramatically different tracer dynamics, even at short time and low filling fraction. Slippery obstacles lead to a diffusion coefficient which varies non-monotonically with filling fraction, with high values at both high and low obstacle densities. As the filling fraction increases from zero, the particles are more and more inhibited by obstacles. However, as the obstacle density increases, particles which bind can more easily move between obstacles. This may describe transport factor motion within the nuclear pore complex, where transport factors can slide on the disordered FG Nups [35]. Therefore, biological systems may use soft interactions and slippery obstacles to allow particle diffusion, even in the highly crowded cellular interior.
Our work highlights how soft interactions and bound-state mobility can dramatically change tracer motion. These effects are relevant to biological systems, ranging from membrane-less organelles to lipid rafts. Although most previous theoretical work on crowded diffusion has focused on the anomalous exponent, these biological examples highlight the importance of changes in the diffusion coefficient. For example, proteins which do not passage through the nuclear pore complex on biologically relevant time scales (minutes to hours) cannot have biological effects, and so the speed of passage is the fundamentally important biological quantity. The long-time diffusion coefficient varies dramatically in our model between hard obstacles, soft sticky obstacles and soft slippery obstacles (figure 9). Thus, the effective permeability of obstacles and the degree to which bound particles can diffuse can be used by cells to tune macromolecular motion.
Acknowledgments
We would like to thank Matthew A. Glaser, Hui-Shun Kuan, and Jeffrey M. Moore for thoughtful discussions. This work was funded by NSF grants DMR-1551095 (MDB) and DMR-1420736 (MWS), and NIH grants K25GM110486 (MDB) and R35GM119755 (LEH). The authors acknowledge the Biofrontiers Computing Core at the University of Colorado Boulder for providing High Performance Computing resources (NIH 1S10OD012300) supported by Biofrontiers IT.
References
- 1.Höfling Felix, Franosch Thomas. Anomalous transport in the crowded world of biological cells. Reports on Progress in Physics Physical Society (Great Britain) 2013 Apr;76(4):046602. doi: 10.1088/0034-4885/76/4/046602. [DOI] [PubMed] [Google Scholar]
- 2.Schütz GJ, Schindler H, Schmidt T. Single-molecule microscopy on model membranes reveals anomalous diffusion. Biophysical Journal. 1997 Aug;73(2):1073–1080. doi: 10.1016/S0006-3495(97)78139-6. [DOI] [PMC free article] [PubMed] [Google Scholar]
- 3.Schütz Gerhard J, Kada Gerald, Pastushenko Vassili Ph, Schindler Hansgeorg. Properties of lipid microdomains in a muscle cell membrane visualized by single molecule microscopy. The EMBO Journal. 2000 Mar;19(5):892–901. doi: 10.1093/emboj/19.5.892. [DOI] [PMC free article] [PubMed] [Google Scholar]
- 4.Nicolau Dan V, Hancock John F, Burrage Kevin. Sources of Anomalous Diffusion on Cell Membranes: A Monte Carlo Study. Biophysical Journal. 2007 Mar;92(6):1975–1987. doi: 10.1529/biophysj.105.076869. [DOI] [PMC free article] [PubMed] [Google Scholar]
- 5.Weigel Aubrey V, Simon Blair, Tamkun Michael M, Krapf Diego. Ergodic and nonergodic processes coexist in the plasma membrane as observed by single-molecule tracking. Proceedings of the National Academy of Sciences. 2011 Apr;108(16):6438–6443. doi: 10.1073/pnas.1016325108. [DOI] [PMC free article] [PubMed] [Google Scholar]
- 6.Javanainen Matti, Hammaren Henrik, Monticelli Luca, Jeon Jae-Hyung, Miettinen Markus S, Martinez-Seara Hector, Metzler Ralf, Vattulainen Ilpo. Anomalous and normal diffusion of proteins and lipids in crowded lipid membranes. Faraday Discussions. 2013;161(0):397–417. doi: 10.1039/c2fd20085f. [DOI] [PubMed] [Google Scholar]
- 7.Krapf Diego. Chapter Five - Mechanisms Underlying Anomalous Diffusion in the Plasma Membrane. In: Kenworthy Anne K., editor. Current Topics in Membranes, volume 75 of Lipid Domains. Academic Press; 2015. pp. 167–207. [DOI] [PubMed] [Google Scholar]
- 8.Jeon Jae-Hyung, Javanainen Matti, Martinez-Seara Hector, Metzler Ralf, Vattulainen Ilpo. Protein Crowding in Lipid Bilayers Gives Rise to Non-Gaussian Anomalous Lateral Diffusion of Phospholipids and Proteins. Physical Review X. 2016 Apr;6(2):021006. [Google Scholar]
- 9.Sadegh Sanaz, Higgins Jenny L, Mannion Patrick C, Tamkun Michael M, Krapf Diego. Plasma Membrane is Compartmentalized by a Self-Similar Cortical Actin Meshwork. Physical Review X. 2017 Mar;7(1):011031. doi: 10.1103/PhysRevX.7.011031. [DOI] [PMC free article] [PubMed] [Google Scholar]
- 10.Petropoulos JH. Membrane transport properties in relation to microscopic and macroscopic structural inhomogeneity. Journal of Membrane Science. 1990 Sep;52(3):305–323. [Google Scholar]
- 11.Veatch Sarah L, Keller Sarah L. Organization in Lipid Membranes Containing Cholesterol. Physical Review Letters. 2002 Dec;89(26):268101. doi: 10.1103/PhysRevLett.89.268101. [DOI] [PubMed] [Google Scholar]
- 12.Stylianidou Stella, Kuwada Nathan J, Wiggins Paul A. Cytoplasmic Dynamics Reveals Two Modes of Nucleoid-Dependent Mobility. Biophysical Journal. 2014 Dec;107(11):2684–2692. doi: 10.1016/j.bpj.2014.10.030. [DOI] [PMC free article] [PubMed] [Google Scholar]
- 13.Crowley Peter B, Chow Elysian, Papkovskaia Tatiana. Protein Interactions in the Escherichia coli Cytosol: An Impediment to In-Cell NMR Spectroscopy. Chembiochem : a European journal of chemical biology. 2011 doi: 10.1002/cbic.201100063. [DOI] [PubMed] [Google Scholar]
- 14.Mourão Márcio A, Hakim Joe B, Schnell Santiago. Connecting the Dots: The Effects of Macromolecular Crowding on Cell Physiology. Biophysical Journal. 2014 Dec;107(12):2761–2766. doi: 10.1016/j.bpj.2014.10.051. [DOI] [PMC free article] [PubMed] [Google Scholar]
- 15.Zhdanov Vladimir P, Höök Fredrik. Kinetics of enzymatic reactions in lipid membranes containing domains. Physical Biology. 2015 Apr;12(2):026003. doi: 10.1088/1478-3975/12/2/026003. [DOI] [PubMed] [Google Scholar]
- 16.Dix James A, Verkman AS. Crowding Effects on Diffusion in Solutions and Cells. Annual Review of Biophysics. 2008;37(1):247–263. doi: 10.1146/annurev.biophys.37.032807.125824. [DOI] [PubMed] [Google Scholar]
- 17.Di Rienzo Carmine, Piazza Vincenzo, Gratton Enrico, Beltram Fabio, Cardarelli Francesco. Probing short-range protein Brownian motion in the cytoplasm of living cells. Nature Communications. 2014 Dec;5 doi: 10.1038/ncomms6891. [DOI] [PMC free article] [PubMed] [Google Scholar]
- 18.Saxton MJ. Lateral diffusion in an archipelago. The effect of mobile obstacles. Biophysical Journal. 1987 Dec;52(6):989–997. doi: 10.1016/S0006-3495(87)83291-5. [DOI] [PMC free article] [PubMed] [Google Scholar]
- 19.Saxton MJ. Anomalous diffusion due to obstacles: A Monte Carlo study. Biophysical Journal. 1994 Feb;66(2):394–401. doi: 10.1016/s0006-3495(94)80789-1. [DOI] [PMC free article] [PubMed] [Google Scholar]
- 20.Saxton MJ. Anomalous diffusion due to binding: A Monte Carlo study. Biophysical Journal. 1996 Mar;70(3):1250–1262. doi: 10.1016/S0006-3495(96)79682-0. [DOI] [PMC free article] [PubMed] [Google Scholar]
- 21.Berry Hugues. Monte carlo simulations of enzyme reactions in two dimensions: Fractal kinetics and spatial segregation. Biophysical Journal. 2002 Oct;83(4):1891–1901. doi: 10.1016/S0006-3495(02)73953-2. [DOI] [PMC free article] [PubMed] [Google Scholar]
- 22.Ellery Adam J, Baker Ruth E, Simpson Matthew J. An analytical method for disentangling the roles of adhesion and crowding for random walk models on a crowded lattice. Physical Biology. 2016;13(5):05LT02. doi: 10.1088/1478-3975/13/5/05LT02. [DOI] [PubMed] [Google Scholar]
- 23.Ghosh Surya K, Cherstvy Andrey G, Metzler Ralf. Non-universal tracer diffusion in crowded media of noninert obstacles. Phys Chem Chem Phys. 2015;17(3):1847–1858. doi: 10.1039/c4cp03599b. [DOI] [PubMed] [Google Scholar]
- 24.Wedemeier Annika, Merlitz Holger, Wu Wu, Langowski Jorg. How proteins squeeze through polymer networks: A Cartesian lattice study. The Journal of Chemical Physics. 2009 Aug;131(6):064905. doi: 10.1063/1.3205100. [DOI] [PubMed] [Google Scholar]
- 25.Berry Hugues, Chaté Hugues. Anomalous diffusion due to hindering by mobile obstacles undergoing Brownian motion or Orstein-Ulhenbeck processes. Physical Review E. 2014 Feb;89(2):022708. doi: 10.1103/PhysRevE.89.022708. [DOI] [PubMed] [Google Scholar]
- 26.Ellery Adam J, Simpson Matthew J, McCue Scott W, Baker Ruth E. Characterizing transport through a crowded environment with different obstacle sizes. The Journal of Chemical Physics. 2014 Feb;140(5):054108. doi: 10.1063/1.4864000. [DOI] [PubMed] [Google Scholar]
- 27.Fujiwara Takahiro, Ritchie Ken, Murakoshi Hideji, Jacobson Ken, Kusumi Akihiro. Phospholipids undergo hop diffusion in compartmentalized cell membrane. The Journal of Cell Biology. 2002 Jun;157(6):1071–1082. doi: 10.1083/jcb.200202050. [DOI] [PMC free article] [PubMed] [Google Scholar]
- 28.Forstner Martin B, Martin Douglas S, Rückerl Florian, Käs Josef A, Selle Carsten. Attractive membrane domains control lateral diffusion. Physical Review E. 2008 May;77(5):051906. doi: 10.1103/PhysRevE.77.051906. [DOI] [PubMed] [Google Scholar]
- 29.Ehrig Jens, Petrov Eugene P, Schwille Petra. Near-Critical Fluctuations and Cytoskeleton-Assisted Phase Separation Lead to Subdiffusion in Cell Membranes. Biophysical Journal. 2011 Jan;100(1):80–89. doi: 10.1016/j.bpj.2010.11.002. [DOI] [PMC free article] [PubMed] [Google Scholar]
- 30.Silvius John R. Partitioning of membrane molecules between raft and non-raft domains: Insights from model-membrane studies. Biochimica et Biophysica Acta (BBA) - Molecular Cell Research. 2005 Dec;1746(3):193–202. doi: 10.1016/j.bbamcr.2005.09.003. [DOI] [PubMed] [Google Scholar]
- 31.Iyer Aditya, Schilderink Nathalie, Claessens Mireille MAE, Subramaniam Vinod. Membrane-Bound Alpha Synuclein Clusters Induce Impaired Lipid Diffusion and Increased Lipid Packing. Biophysical Journal. 2016 Dec;111(11):2440–2449. doi: 10.1016/j.bpj.2016.10.016. [DOI] [PMC free article] [PubMed] [Google Scholar]
- 32.Brangwynne Clifford P, Eckmann Christian R, Courson David S, Rybarska Agata, Hoege Carsten, Gharakhani Jöbin, Jülicher Frank, Hyman Anthony A. Germline P Granules Are Liquid Droplets That Localize by Controlled Dissolution/Condensation. Science. 2009 Jun;324(5935):1729–1732. doi: 10.1126/science.1172046. [DOI] [PubMed] [Google Scholar]
- 33.Molliex Amandine, Temirov Jamshid, Lee Jihun, Coughlin Maura, Kanagaraj Anderson P, Kim Hong Joo, Mittag Tanja, Paul Taylor J. Phase Separation by Low Complexity Domains Promotes Stress Granule Assembly and Drives Pathological Fibrillization. Cell. 2015 Sep;163(1):123–133. doi: 10.1016/j.cell.2015.09.015. [DOI] [PMC free article] [PubMed] [Google Scholar]
- 34.Hough Loren E, Dutta Kaushik, Sparks Samuel, Temel Deniz B, Kamal Alia, Tetenbaum-Novatt Jaclyn, Rout Michael P, Cowburn David. The molecular mechanism of nuclear transport revealed by atomic-scale measurements. eLife. 2015 Sep;4:e10027. doi: 10.7554/eLife.10027. [DOI] [PMC free article] [PubMed] [Google Scholar]
- 35.Raveh Barak, Karp Jerome M, Sparks Samuel, Dutta Kaushik, Rout Michael P, Sali Andrej, Cowburn David. Slide-and-exchange mechanism for rapid and selective transport through the nuclear pore complex. Proceedings of the National Academy of Sciences. 2016 Mar;113(18):E2489–E2497. doi: 10.1073/pnas.1522663113. [DOI] [PMC free article] [PubMed] [Google Scholar]
- 36.Timney Benjamin L, Raveh Barak, Mironska Roxana, Trivedi Jill M, Kim Seung Joong, Russel Daniel, Wente Susan R, Sali Andrej, Rout Michael P. Simple rules for passive diffusion through the nuclear pore complex. J Cell Biol. 2016 Sep; doi: 10.1083/jcb.201601004. page jcb.201601004. [DOI] [PMC free article] [PubMed] [Google Scholar]
- 37.Ellery Adam J, Baker Ruth E, Simpson Matthew J. Calculating the Fickian diffusivity for a lattice-based random walk with agents and obstacles of different shapes and sizes. Physical Biology. 2015;12(6):066010. doi: 10.1088/1478-3975/12/6/066010. [DOI] [PubMed] [Google Scholar]
- 38.Ellery Adam J, Baker Ruth E, McCue Scott W, Simpson Matthew J. Modeling transport through an environment crowded by a mixture of obstacles of different shapes and sizes. Physica A: Statistical Mechanics and its Applications. 2016 May;449:74–84. [Google Scholar]
- 39.Nandigrami Prithviraj, Grove Brandy, Konya Andrew, Selinger Robin LB. Gradient-driven diffusion and pattern formation in crowded mixtures. Physical Review E. 2017 Feb;95(2):022107. doi: 10.1103/PhysRevE.95.022107. [DOI] [PubMed] [Google Scholar]
- 40.Mercier Jean-François, Slater Gary W. Numerically exact diffusion coefficients for lattice systems with periodic boundary conditions. II. Numerical approach and applications. The Journal of Chemical Physics. 1999 Mar;110(12):6057–6065. [Google Scholar]
- 41.Mercier Jean-François, Slater Gary W, Guo Hong L. Numerically exact diffusion coefficients for lattice systems with periodic boundary conditions. I. Theory. The Journal of Chemical Physics. 1999 Mar;110(12):6050–6056. [Google Scholar]
- 42.Ellery Adam J, Baker Ruth E, Simpson Matthew J. Communication: Distinguishing between short-time non-Fickian diffusion and long-time Fickian diffusion for a random walk on a crowded lattice. The Journal of Chemical Physics. 2016 May;144(17):171104. doi: 10.1063/1.4948782. [DOI] [PubMed] [Google Scholar]
- 43.Wedemeier Annika, Merlitz Holger, Wu Chen-Xu, Langowski Jorg. Modeling diffusional transport in the interphase cell nucleus. The Journal of Chemical Physics. 2007 Jul;127(4):045102. doi: 10.1063/1.2753158. [DOI] [PubMed] [Google Scholar]
- 44.Wedemeier A, Merlitz H, Langowski J. Anomalous diffusion in the presence of mobile obstacles. EPL (Europhysics Letters) 2009 Nov;88(3):38004. [Google Scholar]
- 45.Wedemeier Annika, Zhang Ting, Merlitz Holger, Wu Chen-Xu, Langowski Jorg. The role of chromatin conformations in diffusional transport of chromatin-binding proteins: Cartesian lattice simulations. The Journal of Chemical Physics. 2008 Apr;128(15):155101. doi: 10.1063/1.2895048. [DOI] [PubMed] [Google Scholar]
- 46.Metropolis Nicholas, Rosenbluth Arianna W, Rosenbluth Marshall N, Teller Augusta H, Teller Edward. Equation of State Calculations by Fast Computing Machines. The Journal of Chemical Physics. 1953 Jun;21(6):1087–1092. [Google Scholar]
- 47.Magdziarz Marcin, Weron Aleksander, Burnecki Krzysztof, Klafter Joseph. Fractional Brownian Motion Versus the Continuous-Time Random Walk: A Simple Test for Subdiffusive Dynamics. Physical Review Letters. 2009 Oct;103(18):180602. doi: 10.1103/PhysRevLett.103.180602. [DOI] [PubMed] [Google Scholar]
- 48.Schulz P, Eli Barkai Johannes H, Metzler Ralf. Aging Renewal Theory and Application to Random Walks. Physical Review X. 2014 Feb;4(1):011028. [Google Scholar]
- 49.Metzler Ralf, Klafter Joseph. The random walk’s guide to anomalous diffusion: A fractional dynamics approach. Physics Reports. 2000 Dec;339(1):1–77. [Google Scholar]
- 50.Feder TJ, Brust-Mascher I, Slattery JP, Baird B, Webb WW. Constrained diffusion or immobile fraction on cell surfaces: A new interpretation. Biophysical Journal. 1996 Jun;70(6):2767–2773. doi: 10.1016/S0006-3495(96)79846-6. [DOI] [PMC free article] [PubMed] [Google Scholar]
- 51.Weiss Matthias, Elsner Markus, Kartberg Fredrik, Nilsson Tommy. Anomalous Subdiffusion Is a Measure for Cytoplasmic Crowding in Living Cells. Biophysical Journal. 2004 Nov;87(5):3518–3524. doi: 10.1529/biophysj.104.044263. [DOI] [PMC free article] [PubMed] [Google Scholar]
- 52.Ghosh RN, Webb WW. Automated detection and tracking of individual and clustered cell surface low density lipoprotein receptor molecules. Biophysical Journal. 1994 May;66(5):1301–1318. doi: 10.1016/S0006-3495(94)80939-7. [DOI] [PMC free article] [PubMed] [Google Scholar]
- 53.Saxton MJ. Single-particle tracking: The distribution of diffusion coefficients. Biophysical Journal. 1997 Apr;72(4):1744–1753. doi: 10.1016/S0006-3495(97)78820-9. [DOI] [PMC free article] [PubMed] [Google Scholar]
- 54.Stauffer Dietrich, Aharony Ammon. Introduction To Percolation Theory. CRC Press; Jul, 1994. Google-Books-ID: v66plleij5QC. [Google Scholar]


