Abstract
As part of a major project to investigate protective and diagnostic immune markers against tuberculosis (TB), we measured antibody isotype responses to Mycobacterium tuberculosis (Mtb) antigens (LAM, Rv2031, and HBHA) in cohorts of 149 pulmonary tuberculosis patients (PTBP), 148 household contacts (HHCs), and 68 community controls (CCs) in an endemic setting. ELISA was used to measure levels of IgA, IgG, and IgM from sera of cohorts at baseline, and at 6 and 12 months from entry. The results show that there were significant differences in IgA, IgG, and IgM responses to the different antigens and in the three cohorts. At baseline, the level of IgM against RV2031 and LAM did not vary between cohorts, but the levels of IgA and IgG against Rv2031 were significantly higher in PTB patients than HHCs and CCs, followed by HHCs, and the lowest in CCs. In patients, there was a significant variation in antibody responses before and after chemotherapy. The levels of IgA and IgG against HBHA, and IgA against Rv2031 decreased significantly and remained low, while IgA and IgG against LAM increased significantly and remained high following chemotherapy. However, the levels of IgM against Rv2031 and LAM increased at 6 months but decreased again at 12 months. IgM against HBHA did not show any significant variation before and after chemotherapy. Similarly, there were also significant variations in antibody responses in HHCs over time. Our results show that there are significant variations in IgA, IgG and IgM responses to the different antigens and in the three cohorts, implying that not all antibody isotype responses are markers of clinical TB. In addition, the current and previous studies consistently show that IgA and IgG against Rv2031 discriminate between clinical disease, Mtb-infected and non-infected individuals.
Introduction
Tuberculosis (TB) caused mainly by Mtb remains one of the leading cause of death due to an infectious agent. According to the World Health Organization [1], there were 1.8 million deaths and 10.4 million clinical TB patients globally in 2015. In addition, it is believed that an estimated one-third of the global population is Mtb infected [1]. The only licensed TB vaccine currently in use, BCG does not control transmission. Efforts to replace BCG with an efficacious vaccine or to augment very little, partly because of lack of knowledge about correlates of protective immunity [2–5]. Efforts made to develop an efficacious vaccine based on cell-mediated immunity (mainly interferon-gamma production by CD4+ T cells) did not yield the desired results. In recent years, however, several studies from animal models and epidemiological studies have shown that antibody isotypes (especially IgA) are protective against TB [6–11]. Mycobacterium tuberculosis employs different virulent factors (antigens) for entry, invasion, and persistence and multiplication within the host cell. Lipo-arabinomannan (LAM), which is one of the major components of Mtb cell wall is associated with virulence and immuno-pathology, including inhibition of interferon-gamma-mediated macrophage activation [12], inhibition of T cell proliferation [13] or induction of T cell anergy [14, 15], inhibition of IL-12 production [16], inhibition of neutrophil recruitment [17], and inhibition of dendritic cell function and Mtb-induced apoptosis [18]. LAM is also involved in inhibition of Kinase C activities and in scavenging cytotoxic oxygen free radicals [19], and phagosomal maturation [20]. Moreover, TB associated clinical manifestations, namely fever, weight loss, and tissue necrosis have been attributed to LAM-induced cytokine production [21].
Similarly, Rv2031, the 16-kDa heat shock protein (hspX) of Mtb (also known as alpha crystalline) is another virulence factor involved in persistence of the bacilli in the host cell during latency. It is also an immuno-dominant protein predominantly produced during the stationary phase and is believed to play a critical role in maintaining long-term protein stability and long term survival of the pathogen [22, 23].
The 28-kDa, heparin-binding hemagglutinin (HBHA) of Mtb is a surface protein which has been shown to promote extra-pulmonary dissemination of Mtb by facilitating Mtb-epithelial cell attachment [24]. As one of Mtb virulence factors, it is known for inhibiting autophagy through induction of cytoplasmic reticulum stress-mediated apoptosis through generation of reactive oxygen intermediates and cytosolic ca2+ in murine macrophages [25]. While detection of LAM in urine is currently used in the diagnosis of TB, especially in TB/HIV co-infected individuals [26], the potential of Rv2031 [27] and HBHA for diagnosis [28, 29] and as candidate vaccine [30, 31] is being investigated.
The current study is part of a major project to assess protective and diagnostic immune markers using immuno-dominant antigens of Mtb in the population in a setting of high endemicity. Earlier, we have reported cytokine responses against immuno-dominant antigens such as recombinant early secreted antigen-6 and culture filtrate protein-10 (ESAT-/CFP-10) [32], HBHA [9], LAM [33] and Tv2031 [34]. In this paper, we present IgA, IgG, and IgM responses to LAM, RV2031, and HBHA in cohorts of pulmonary TB patients (PTBP), their household contacts (HHCs), and community controls (CCs).
Materials and methods
Study setting
The study was conducted in an endemic setting in Addis Ababa, Ethiopia, with a population of 2.6 million. Out of 24 health centers that provide services to directly observed treatment short course (DOTS), 7 were selected for the current study. Smear positive PTBP were recruited before initiation of treatment. Household contacts (HHCs) living in the same house with smear positive PTBP were screened for TB using clinical assessment and chest x-ray, and followed up for 12 months. AFB and culture were done for those with productive cough.
Participants and data collection
Participants were recruited as described previously [35]. Briefly, smear positive PTBP were recruited prospectively before the initiation of anti-TB treatment. At the same time, HHCs, living with smear positive PTBP and healthy community controls (CCs) with no history of TB or known exposure to PTBP were recruited. Contacts had no evidence of active TB.
Clinical assessment including weight, height and BCG scar examination was done for all participants. QuantiFERON-TB Gold In-Tube test was used to screen HHCs, and CCs for Mtb infection as described earlier [35]. Chest x-ray, smear microscopy and sputum culture were used to rule out TB in HHCs and CCs. Patients were treated with anti-TB drugs for 6 months; however, HHCs were not given prophylactic treatment in line with the national guideline [36]. Screening for HIV infection was done according to the national guideline [37], and only those without HIV infection were included in the study. Participants were between 18 and 60 years of age with no apparent immunosuppressive conditions. Patients and HHCs were followed up for 12 months with clinical examination and sample collection at entry, 6 and 12 months. For CCs, blood samples were collected at entry.
Antibody ELISA
Serum levels of antibody isotypes, IgA, IgG, and IgM against LAM, Rv2031, and HBHA were measured using ELISA as described earlier [9]: Nunc MaxiSorp ELISA plates (Sigma Aldrich, Germany) were coated with LAM (10μg/ml); Rv2031 (10μg/ml); and HBHA (4μg/ml) diluted in carbonate-bicarbonate coating buffer (Sigma-Aldrich, Germany) and incubated overnight at 4°C. Plates were washed with PBS containing 0.05% Tween 20 and blocked with PBS containing 2% BSA (Sigma-Aldrich, Germany) overnight at 4°C. After washing, 100μl of samples diluted 1:100 (IgG) and 1:50 (IgM, IgA) in PBS containing 1% BSA and 0.05% Tween 20 were added each well and plates incubated at room temperature (RT) for 2 hour. After washing, 100μl of goat anti-human IgG, IgA, and IgM antibodies (biotinylated, 0.5 μg/ml) (Mabtech, Sweden) diluted at 1:1000 in PBS containing 1% BSA and 0.05% Tween 20 were added into each well of the respective plates. Plates were incubated at RT for an hour and after washing, 100μl streptavidin-horse radish peroxidase enzyme (Mabtech, Sweden) diluted at 1:2000 in PBS containing 1% BSA and 0.05% Tween 20 was added into each well. After washing 100μl of 3, 3`5, 5`-tetramethylbenzidine substrate tablets (Sigma-Aldrich, Germany) diluted in phosphate citrate buffer with sodium perborate (Sigma-Aldrich, Germany) was added into each well. After 15 minutes of incubation, reaction was stopped with 2N sulfuric acid and read at 450nm. Optical density (OD) values were used for analysis.
Recombinant Mtb antigens
As described previously (Franken et al. Protein Expr and Purification 2000), Mtb antigens were amplified by PCR from genomic H37RvDNA and cloned by Gateway technology (Invitron, Carlsbad, CA, USA) in a bacterial expression vector containing histidine(His) tag at the N-terminus. Vectors were overexpressed in Escherichia coli (E.coli) BL21 (DE3) and purified. The size and purity of the recombinant proteins were analyzed by gel electrophoresis and western blotting with an anti-His Ab (Invitron) and an anti-E.coli polyclonal Ab (gift of Statens Serum Institute, Copenhagen, Denmark).
Data analysis
Antibody levels were presented as OD values. Non-parametric test were used to compare groups. Kruskal-Wallis test with Dunn`s multiple comparisons was used to compare antibody responses among TB patients, HHCs, and CCs at baseline. Mann-Whiney U-test was used to compare antibody responses between patients and contacts at 6 and 12 months. Friedmann test with Dunn`s multiple comparisons was used to compare antibody levels in patients and contacts over time. P values less than 0.05 were considered statistically significant. When three groups were compared simultaneously, p values were adjusted to account for multiple comparisons. GraphicPad Prism version 6.00 for window (GraphPad Software, La Jolle California, USA, http://www.graphpad.com) was used for data analyses.
Ethical clearance
The study was approved by the Institutional Review Board of Aklilu Lemma Institute of Pathobiology, Addis Ababa University; the National Research Ethics Review Committee of Ethiopia and the Regional Committee for Medical and Health Research Ethics, South-east Norway (Regionale Komite for Medisink og Helsefaglig Forskningsetikk, Sør-Øst), Norway. Written informed consent was obtained from each participant before inclusion into the study.
Results
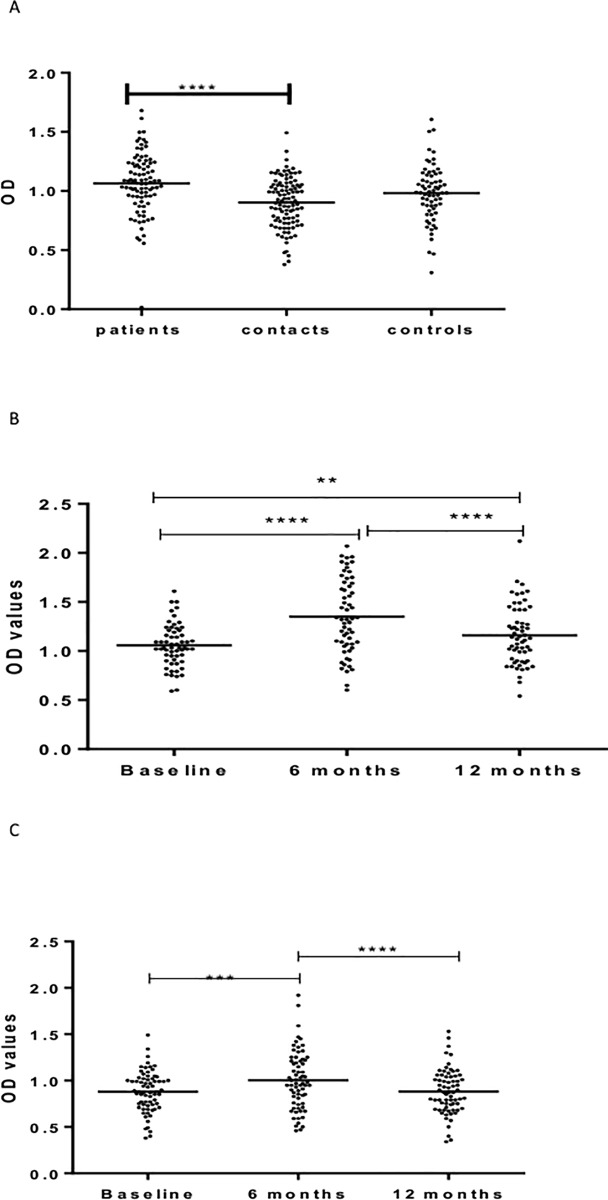
Information on socio-demographic characteristics of the study participants and results of QuantiFERON tests has been published elsewhere [35] (Table 1). Fig 1A–1C shows IgG responses against LAM. At baseline, patients had significantly (p < 0.0001) higher levels of IgG against LAM compared to HHCs and CCs. No significant difference was observed between HHCs and CCs (Fig 1A).
Table 1. Comparison of QFT results at baseline and 12 months among contacts and patients.
| Patients n(%) |
Contacts n(%) |
|||
|---|---|---|---|---|
| Baseline | 12 months | Baseline | 12 months | |
| QFT-negative | 7 (21.9*) | 6 (18.8*) | 24 (32.4) | 14 (18.9) |
| QFT-positive | 25 (78.1*) | 26 (81.2*) | 50 (67.6) | 60 (81.1) |
| MacNemar, p-value | 1.00 | 0.006 | ||
*One patient with indeterminate result at baseline was excluded from the denominator
Fig 1.
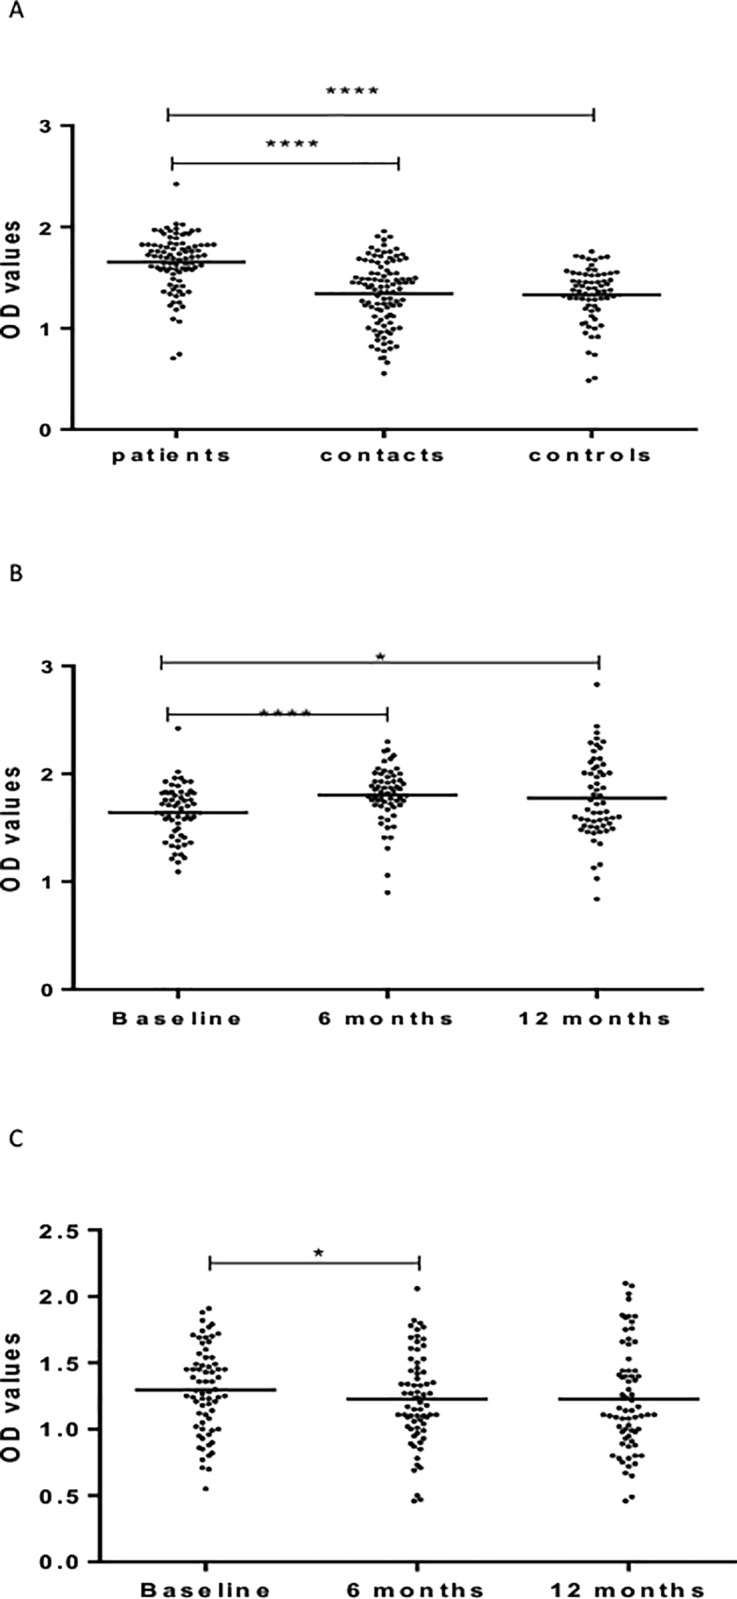
(a-c). IgG responses to LAM at baseline in the three cohorts (Fig a), 6 and 12 months in patients (Fig b) and HHCs (Fig c). Results are individual responses expressed as OD values. The median for each group is shown as horizontal bar. Kruskal-Wallis and Friedman test with Dunn`s multiple comparisons were used to compare antibody responses among groups and over time, respectively. *p<0.05; ****p<0.0001.
Repeated measures of IgG in patients before and after treatment showed a significant (p <0.0001) increase from baseline to 6 months following treatment. Subsequently, there was a non-significant decrease in the level of IgG at 12 months measurements (Fig 1B). In HHCs, the level of IgG against LAM decreased significantly (p < .05) from baseline to 6 months (Fig 1B).
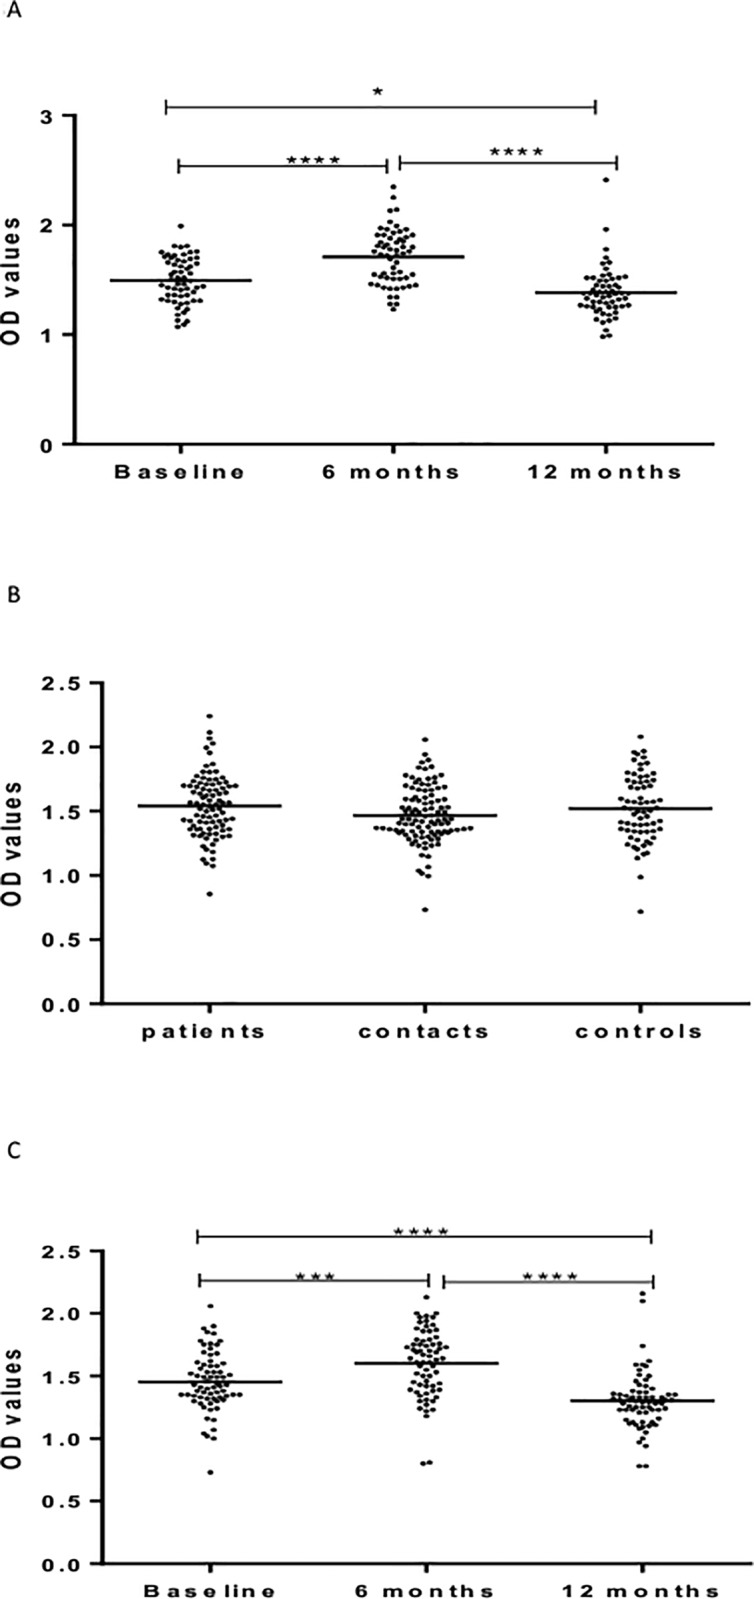
Fig 2A–2C shows IgA responses to LAM. At baseline, untreated patients had significantly (p <0.0001) higher levels of IgA against LAM compared to HHCs and CCs. There was no significant difference between HHCs and CCs (Fig 2A).
Fig 2.
(a-c). IgA responses to LAM at baseline in the three cohorts (Fig a), 6 and 12 months in patients (Fig b) and HHCs (Fig c). Results are individual responses expressed as OD values. The median for each group is shown as horizontal bar. Kruskal-Wallis and Friedman test with Dunn`s multiple comparisons were used to compare antibody responses among groups and over time, respectively. **p<01*p; ***p<0.001; ****p<0.0001.
In patients, IgA level increased significantly (p < 0.0001) from baseline to 6 months after treatment but decreased significantly from 6 to 12 months following treatment (Fig 2B).
In HHCs, the level of IgA against LAM increased significantly (p < 0.001) from baseline to 6 month but decreased significantly at 12 month from baseline (p <0.0001) (Fig 2C).
Fig 3A–3C shows levels of IgM against LAM. No significant difference was observed between patients, HHCs, and CCs in the level of IgM against LAM at baseline (Fig 3A).
Fig 3.
(a-c). IgM responses to LAM at baseline in the three cohorts (Fig a), 6 and 12 months in patients (Fig b) and HHCs (Fig c). Results are individual responses expressed as OD values. The median for each group is shown as horizontal bar. Kruskal-Wallis and Friedman test with Dunn`s multiple comparisons were used to compare antibody responses among groups and over time, respectively. ***p<0.001; ****p<0.0001.
In patients, the level of IgM against LAM increased significantly (p < 0.0001) from baseline to 6 months but decreased significantly from 6 to 12 months from entry. The level of IgM at 12 months was significantly lower (p < 0.05) compared to the level at baseline (Fig 3B).
In HHCs, the level of IgM against LAM was the highest at 6 months, followed at baseline and the lowest at 12 month from entry (Fig 3C).
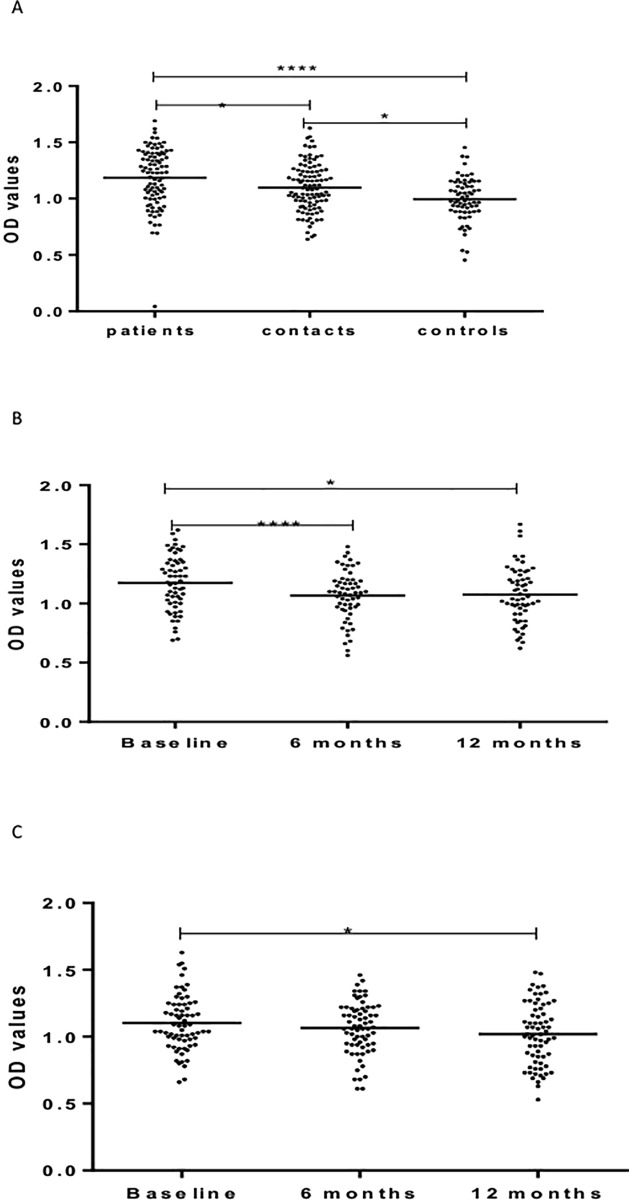
Fig 4A–4C shows results of IgG response to Rv2031. At baseline, the level of IgG was significantly different between the three cohorts, being the highest in untreated patients, followed by HHCs, and the lowest in CCs (Fig 4A).
Fig 4.
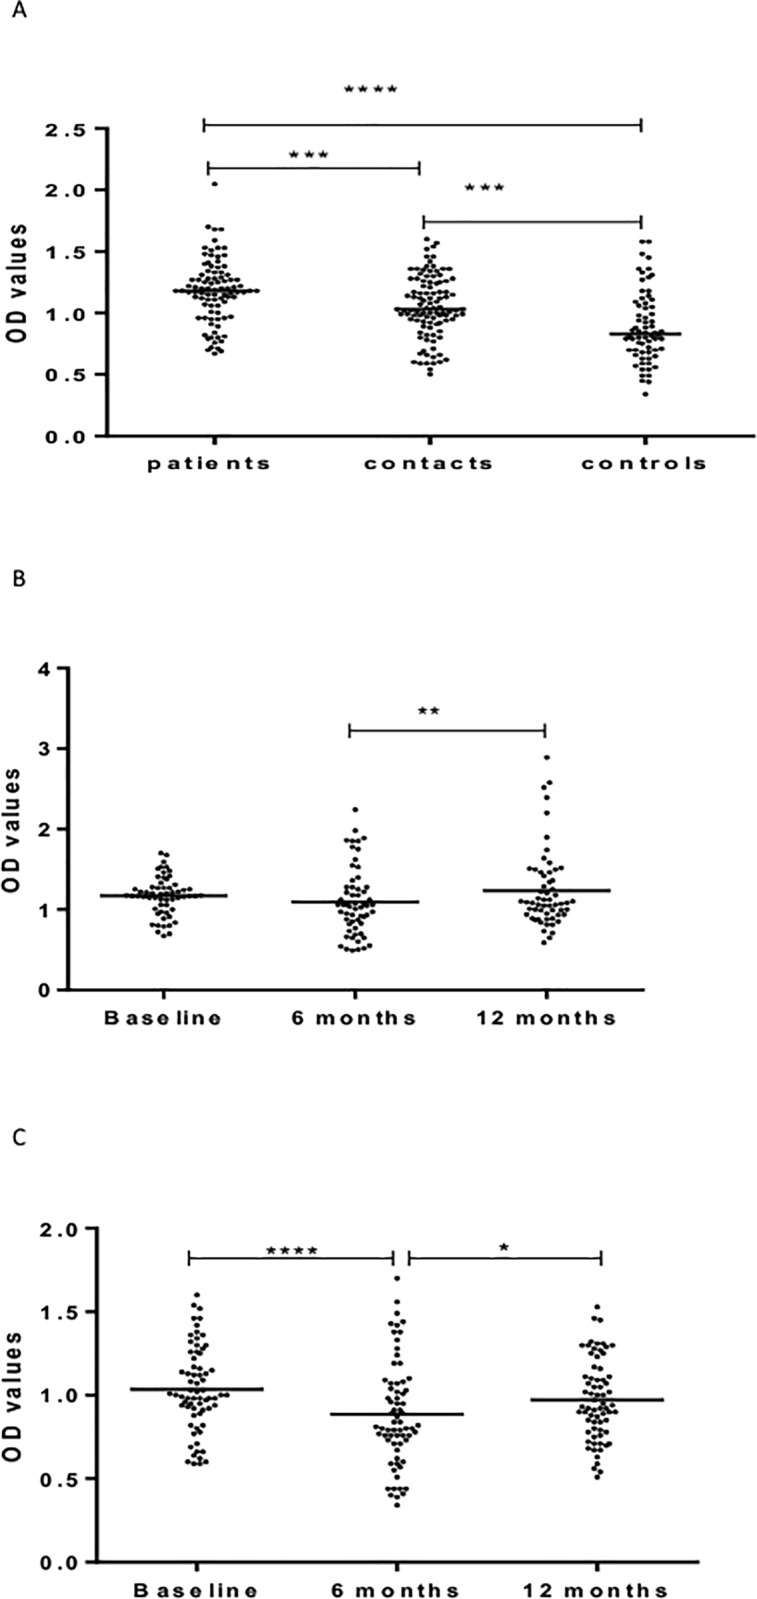
(a-c). IgG responses Rv2031 at baseline (Fig a), 6 and 12 months in patients (Fig b) and HHCs (Fig c). Results are individual responses expressed as OD values. The median for each group is shown as horizontal bar. Kruskal-Wallis and Friedman test with Dunn`s multiple comparisons were used to compare antibody responses among groups and over time, respectively.*p0.05; **p<0.01; ***p<0.001; ****p<0.0001.
Kinetic measurements in patients showed that IgG levels increased significantly (p<0.01) 12 months following treatment compared to baseline or 6 months after treatment (Fig 4B).
However, in HHCs, the level of IgG against Rv2031 decreased significantly (p< 0.0001) at 6 months but increased significantly (p < 0.05) at 12 months from entry (Fig 4C).
Fig 5A–5C shows IgA responses to Rv2031. At baseline, the level of IgA against Rv2031 was significantly (p < 0.0001) higher in patients compared to CCs, and HHCs (p < 0.05). HHCs had significantly higher (p < 0.05) higher levels of IgA than CCs (Fig 5A).
Fig 5.
(a-c). IgA responses to Rv2031 at baseline (Fig a), 6 and 12 months in patients (Fig b) and HHCs (Fig c). Results are individual responses expressed as OD values. The median for each group is shown as horizontal bar. Kruskal-Wallis and Friedman test with Dunn`s multiple comparisons were used to compare antibody responses among groups and over time, respectively. *p<0.05; ****p<0.0001.
The level of IgA decreased significantly (p< 0.0001) from baseline to 6 months and remained low following treatment in patients (Fig 5B).
In HHCs, the levels of IgA was significantly (p < 0.05) higher at baseline compared to 6 and 12 months from entry but there was no difference between 6 and 12 months (Fig 5C).
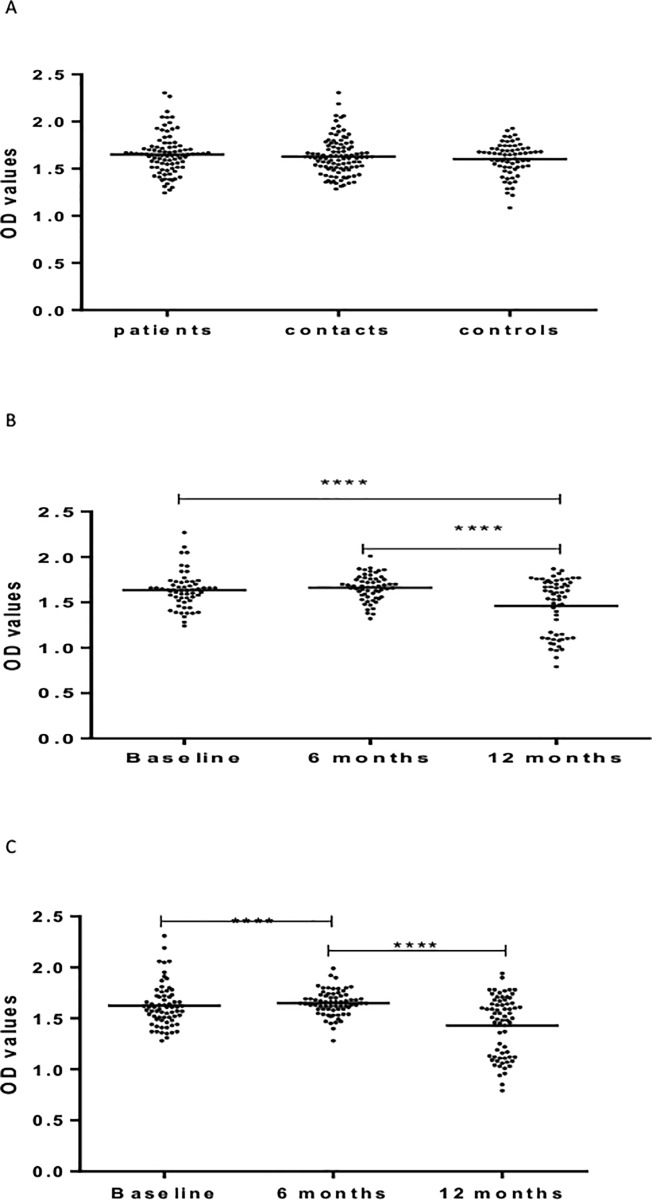
Fig 6A–6C shows IgM responses to Rv2031. There was no difference between patients, HHCs and CCs in the level of IgM at baseline (Fig 6A). In patients, there was no significant difference between baseline and 6 months following treatment. However, the level of IgM decreased significantly (p< 0.0001) 12 months following treatment (Fig 6B). In HHCs, the level of IgM against Rv2031 increased from baseline to 6 months (p<0.0001) but decreased again at 12 months from baseline (p<0.0001) (Fig 6C).
Fig 6.
(a-c). IgM responses to Rv2031 at baseline (Fig a), 6 and 12 months in patients (Fig b) and HHCs (Fig c). Results are individual responses expressed as OD values. The median for each group is shown as horizontal bar. Kruskal-Wallis and Friedman test with Dunn`s multiple comparisons were used to compare antibody responses among groups and over time, respectively. ****p<0.0001.
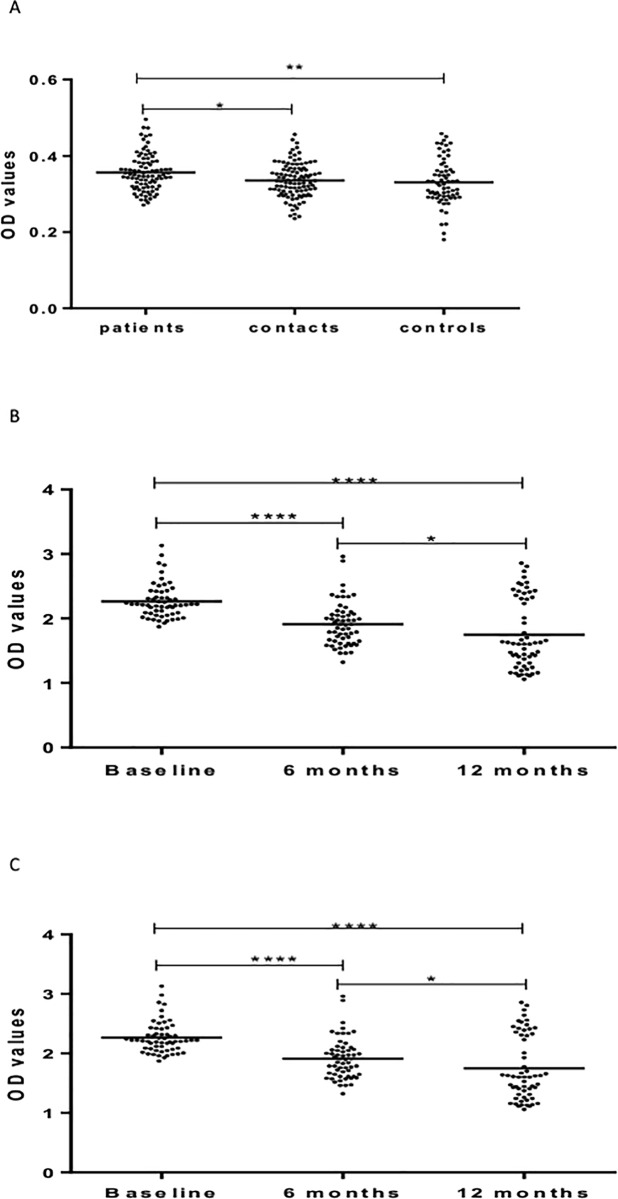
Fig 7A–7C shows IgG responses to HBHA. At baseline, patients had significantly higher levels of IgG against HBHA than HHCs (p < 0.05) and CCs (p < 0.01) (Fig 7A). However, the levels of IgG against HBHA decreased significantly and progressively 6 months (p < 0.0001) and 12 months (p< 0.05) following treatment (Fig 7B). There was a similar significant and progressive decline over a period of 12 months in the level of IgG against HBHA in HHCFs (Fig 7C).
Fig 7.
(a-c). IgG responses to HBHA at baseline (Fig a), 6 and 12 months in patients (Fig b) and HHCs (Fig c). Results are individual responses expressed as OD values. The median for each group is shown as horizontal bar. Kruskal-Wallis and Friedman test with Dunn`s multiple comparisons were used to compare antibody responses among groups and over time, respectively. ****p<0.0001.
Fig 8A–8C shows the level of IgM against HBHA. At baseline, the level of IgM against HBHA was significantly higher in patients and HHCs (p< 0.0001) compared to CCs but there was no significant difference between patients and HHCs (Fig 8A). However, repeated measures in both patients and HHCs did not show any significant difference (Fig 8B & 8C). Results of IgA responses to HBHA have been published elsewhere [2]
Fig 8.
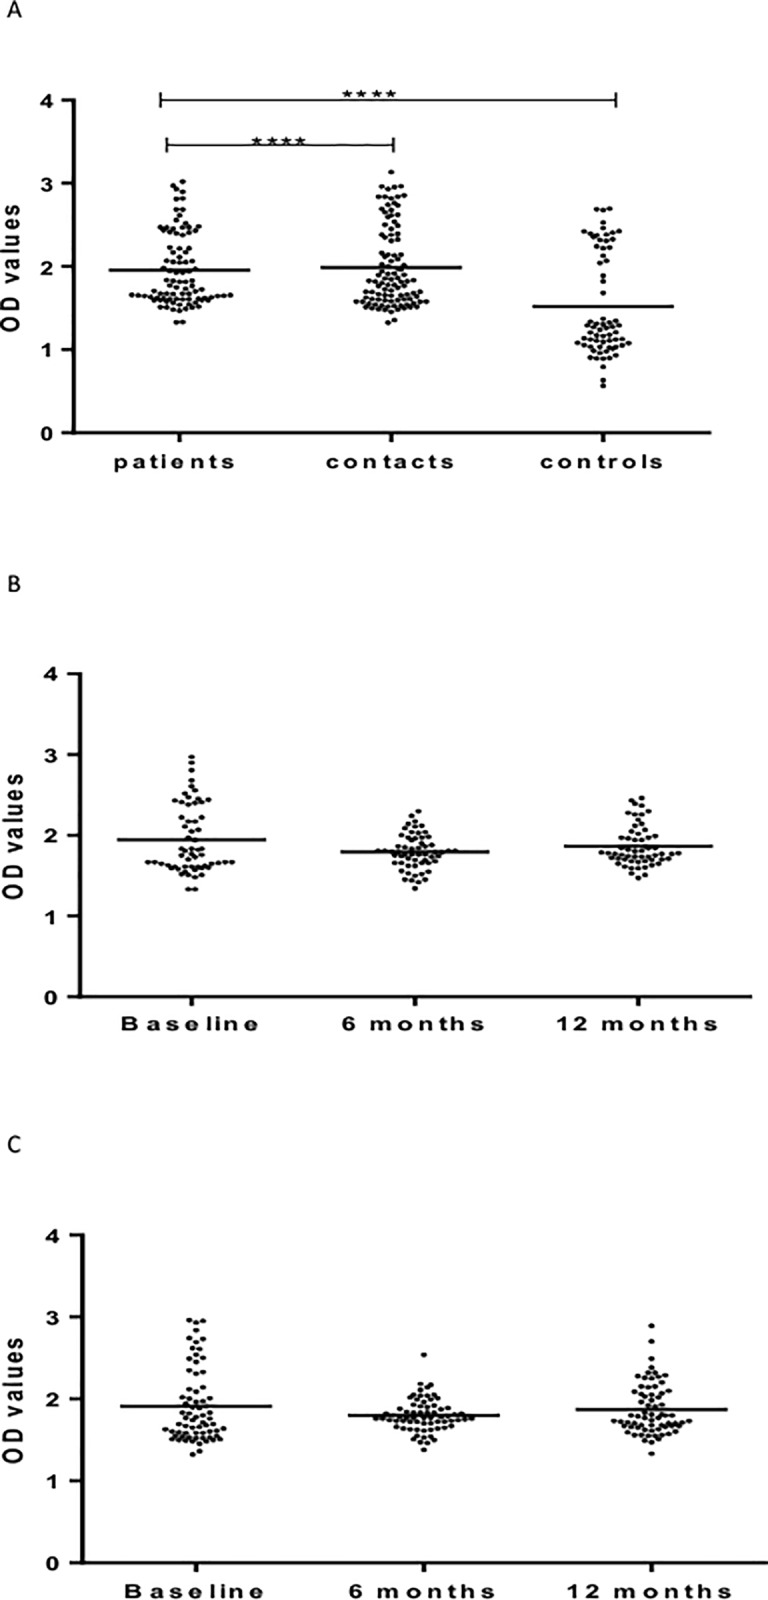
(a-c). IgM responses to HBHA at baseline (Fig a), 6 and 12 months in patients (Fig b) and HHCs (Fig c). Results are individual responses expressed as OD values. The median for each group is shown as horizontal bar. Kruskal-Wallis and Friedman test with Dunn`s multiple comparisons were used to compare antibody responses among groups and over time, respectively. ****p<0.0001.
Discussion
In the present study, we compared IgA, IgG, and IgM responses to Mtb antigens, LAM, Rv2031, and HBHA in cohorts of PTBP, HHCs, and CCs in an endemic setting. The results show that the levels of IgA and IgG against Rv2031 were significantly higher in untreated PTB patients, followed by HHCs and the lowest in CCs. This may imply that there is a strong correlation between the levels of IgA and IgG with bacillary load. Earlier, in a study carried out in a pastoral community, our group reported that IgA against ESAT-6/CFP-10 and Rv2031 discriminated between pulmonary TB patients, healthy-Mtb-infected and non-infected individuals [27]. These results are in agreement with other studies that showed antibody levels against Mtb components are markers for bacterial load [38], which are in turn associated with risk of disease [39–41]. Results of other studies [42–44] also suggest that IgA against Rv2031 could discriminate between clinical TB patients and healthy controls. In addition, a study carried out by Kunnath-Velayudhan et al [39] in which TB suspects were stratified into groups of absent, low and high, based on results of sputum-smear microscopy and bacterial load, have shown that antibody levels correlated with bacillary load. Recently, Baumann et al [45] have shown that IgA levels against L-alanine dehydrogenase AlaDH (Rv2780), nitrate/nitrite response transcriptional regulator NarL (Rv0844c), 19-kDa lipoprotein antigen precursor LpqH (Rv3763), periplasmic phosphate-binding lipoprotein pstS3 (Rv0928), and MPT83 (Rv2873) were consistently elevated in a small control sub-group, and suggested that IgA, together with IgG could have a prognostic potential. The above reports have been further augmented by a recent study [46], which has documented that IgA and IgG against selected mycobacterial antigens provide promising diagnostic signatures for active TB. Put together, results of all the above studies from different geographic communities consistently suggest that Mtb antigen specific IgA and IgG could be used to develop an accurate and simple ELISA test for the diagnosis of TB.
Second, results of this study show that there are significant variations in the levels of antibody isotypes against the three antigens in PTB patients (before and after treatment) and contacts over time. For instance, while the levels of IgG and IgA against Rv2031 (heat shock protein) were significantly different between PTB patients, HHCs and CCs (Figs 4A & 5A), no significant difference was observed in the levels of IgM against LAM between untreated patients, HHCs, and CCs (Fig 3A). Moreover, the level of IgM against HBHA was similar in untreated patients and HHCs but was significantly lower in CCs (Fig 8A). Earlier, our group [9] has shown that healthy community controls had a significantly higher (p<0.0001) level of IgA against HBHA compared to untreated patients, implying that IgA against HBHA could be a marker for protective immunity against TB. Therefore, results of the present study suggest that not all antibody responses are markers of clinical TB [29] or carry risk of disease progression as suggested earlier [39–41].
Such differences are primarily related to structural, antigenic and functional differences in constant region of heavy chain of antibody isotypes. For instance, the fact that the levels of IgA and IgG against Rv2031 (heat shock protein) increased with antigen load could be due to affinity maturation of activated B cells/isotype switching and production of high affinity IgA and IgG. IgG is the most abundant antibody isotype in plasma because it is produced by plasma cells derived from B cells that have undergone class switching [47]. However, the fact that the level of IgM against LAM did not show any significant difference between PTB patients, HHCs, and CCs (with different bacillary load) could be because LAM being a mycobacterial glycolipid, may not induce affinity maturation of B cells and class switching (which requires T cell help) in the same manner as protein antigens.
There was also a significant variation in antibody responses against these antigens in patients before and following chemotherapy. Some antibody isotypes (e.g. IgG against HBHA, IgA and IgM against Rv2031) decreased significantly, while others (IgA against LAM, and IgM against LAM) increased 6 months following chemotherapy, while still others (IgG against Rv2031, IgM against HBHA) did not show any significant change 6 months after treatment.
There are two plausible explanations for the increase in antibody responses following chemotherapy. The fact that some antibody isotypes (IgG and IgA against LAM) increased following treatment and remained high 12 months following treatment may suggest reinfection in this endemic area, whereas the transient increase in antibody responses (IgM against LAM and Rv2031) might be explained by disintegration of the bacteria and associated release of antigens, which may result in an increase in antibody isotype responses. Earlier, Mattos et al. [48] have reported that the level of antibody responses against some antigens (16-kDa antigen) increase temporarily following chemotherapy and attributed this transient increase to disintegration of the bacilli and release of cytosolic antigens. In a study in Schistosoma haematobium infection in Zimbabwe, it was shown that chemotherapy has an immunizing effect, in addition to a transient reduction in the level of infection [49]. However, the decline in the levels of some antibody responses (IgA and IgG against RV2031 and HBHA) following chemotherapy can be explained by the removal of the pathogen and decrease in bacillary load. In favor of our view, several studies have reported that the level of IgG against Rv2031 decreased significantly following chemotherapy and a decrease in bacterial load [50–52]. Imaz et al [52] have reported that the level of antibodies (IgG) to different mycobacterial antigens decreased significantly after anti-tuberculous treatment compared to baseline. Baumann et al [46] have also reported that patients with elevated levels of antibody isotypes before treatment respond to treatment slowly.
Variations in antibody responses are not limited to pulmonary TB patients. However, there were significant variations in antibody responses in HHCs over time. Some antibody levels decreased from baseline to 6 months and remained the same (IgG against LAM); some increased from baseline to 6 months and returned to the original level at 12 months (IgA, IgM against LAM; IgA against Rv2031); and some decreased significantly and progressively over 12 months period (IgG against HBHA).
It is difficult to provide definitive explanations but one possible explanation for the increase over time of some antibody isotypes could be due to disease progression, super-infection or infection by environmental mycobacteria. Our results are supported by results from different studies [53–55]. In a study carried out in Spain [54], it was reported that antibody response to the 16-kDa antigen was non-specific for the control of non-TB pneumonia population. Similarly, Raja et al [55] have reported that 31% of individuals with non-TB lung diseases have antibodies to the 16-kDa antigen.
There are reports that show cross-reactive antibodies generated by exposure to environmental mycobacteria or non-pathogenic enteric or pulmonary bacteria [56, 57]. It has also been shown that the development of low level humoral immune responses to Mycobacterium avium sonic extracts and mycobacterial LAM in children correlates with increasing age, and by 18 years of age many individuals were sero-reactive to mycobacterial antigens [58].
Conclusion
Results of the current study involving a large sample of PTBP, their HHCs and CCs show that the levels of IgA and IgG against Rv2031 were significantly higher in PTBP compared to HHCs and CCs. The levels of these antibody isotypes were also significantly higher in HHCs compared to CCs. The results suggest that IgA and IgG against Rv2031 discriminate between clinical TB patients, Mtb-infected and non-infected individuals, implying the potential for the diagnosis of tuberculosis. The fact the levels of IgA, IgG, and IgM varied significantly for the different antigens and cohorts may suggest that not all antibody responses are markers of clinical TB as suggested earlier.
Acknowledgments
The authors would like to thank health workers at the selected DOTS clinics for collecting data; Miss Mahlet Chanyalew (Aklilu Lemma Institute of Pathobiology, Addis Ababa University) for assisting in laboratory work. Our gratitude goes to participants for taking part in the study.
Funding: The study was funded by the Research Council of Norway (GLOBVAC Project No. 196397/S50). The funder has no role in the study design, data collection, and preparation of the manuscript or decision to publish.
Data Availability
Data are available from the Norwegian Center for Research data (dataarkivering@nsd.no) after competition of research projects. The purpose of storing data with this center is for data protection (personal information). Therefore, any institution or individual that is interested in accessing such data must make a formal request and agreement with the Norwegian Center for Research data.
Funding Statement
This work was supported by The Research Council of Norway (GLOBVAC PROJECT: 196397/S50).
References
- 1.WHO. Global Tuberculosis Report 2016. WHO, Geneva; 2016 [Google Scholar]
- 2.Kaufmann SHE, Weiner J, von Reyn CF. Novel approaches to tuberculosis vaccine development. Int J Infect dis 2017; 56: 263–267. doi: 10.1016/j.ijid.2016.10.018 [DOI] [PubMed] [Google Scholar]
- 3.Kaufmann SHE, Fortune S, Pepponi H, Ruwald M, Schrager LK, Ottenhoff TMH. TB biomarkers, TB correlates and human challenge models: New tools for improving assessment of new TB vaccines. Tuberculosis 2016; 99: S8–S11. doi: 10.1016/j.tube.2016.05.010 [DOI] [PubMed] [Google Scholar]
- 4.Chegou NN, Essone PN, Loxton AG, Stanley K, Black GF, van der Spuy GD et al. potential of host markers produced by infection phase-dependent antigen-stimulated cells for diagnosis of tuberculosis in a highly endemic area. Plos One 2012;7(8). doi: 10.1371/journal.pone.0038501 [DOI] [PMC free article] [PubMed] [Google Scholar]
- 5.Abebe F. Is interferon-gamma the right marker for bacilli-Calmette-Guerin-induced immune protection? The missing link in our understanding of tuberculosis immunology. Clin Exp Immunol 2012; 169 (3):213–219. doi: 10.1111/j.1365-2249.2012.04614.x [DOI] [PMC free article] [PubMed] [Google Scholar]
- 6.Jacobs AJ, mongkolsapaya J, Screaton GR, McShane H, Wilkinson RJ. Antibodies and tuberculosis. Tuberculosis 2016: 101: 102–113. doi: 10.1016/j.tube.2016.08.001 [DOI] [PMC free article] [PubMed] [Google Scholar]
- 7.Lu LL, Chung AW, Rosebrock TR, Day C, Fortune SM, alter G. A functional role for.antibodies in tuberculosis. Cell 2016; 167: 433–443. doi: 10.1016/j.cell.2016.08.072 [DOI] [PMC free article] [PubMed] [Google Scholar]
- 8.Zimmermann N, Thormann V, Hu B, Kohler AB, Imai-Matsushuma A, Locht C, et al. Human Isotype-dependent inhibitory antibody responses against Mycobacterium tuberculosis. EMBO Mol Med 2015; 8 (11): 1325–1339. [DOI] [PMC free article] [PubMed] [Google Scholar]
- 9.Belay M, Legesse M, Mihret A, Ottenhoff THM, Franken KS, Bjune G, et al. IFN-g and IgA against non-methylated heparin-binding haemmagglutnin as markers of protective immunity and latent tuberculosis: results of a longitudinal study from an endemic setting. J Infect 2016; 72: 189–200. doi: 10.1016/j.jinf.2015.09.040 [DOI] [PubMed] [Google Scholar]
- 10.Anchkar JM, Chan J, Casadevall A. B cells and antibodies in the defence against Mycobacterium tuberculosis infection. Immunol Rev 2015; 264 (1): 167–181. doi: 10.1111/imr.12276 [DOI] [PMC free article] [PubMed] [Google Scholar]
- 11.Abebe F & Bjune G. The protective role antibody responses during Mycobacterium tuberculosis infection. Clin Exp Immunol 2009; 157:235–243. doi: 10.1111/j.1365-2249.2009.03967.x [DOI] [PMC free article] [PubMed] [Google Scholar]
- 12.Sibley LD, Hunter SW, Brennan PJ, Krahenbuhl JL. Mycobacterial lipoarabinomannan inhibits gamma interferon-mediated activation of macrophages. Infect Immun 1988; 56: 1232–1236. [DOI] [PMC free article] [PubMed] [Google Scholar]
- 13.Moreno C, Mehlert A, & Lamb J. The inhibitory effects of mycobacterial lipoarabinomannan and polysaccharides upon polyclonal and monoclonal human T cell proliferation. Clin Exp Immunol 1988; 74: 206–201. [PMC free article] [PubMed] [Google Scholar]
- 14.Athman JJ, Sande OJ, Groft SG, Reba SM, Nagy N, Wearsch et al. Mycobacterium tuberculosis membrane vesicles inhibit cell activation. J Immunol 2017: 198: 2028–2037. doi: 10.4049/jimmunol.1601199 [DOI] [PMC free article] [PubMed] [Google Scholar]
- 15.Sande OJ, Karm AF, Li Q, Ding X, Harding CV, Rojas RF, et al. Mannose-Capped Lipoarabinomannan from Mycobacterium tuberculosis induces VD4+ T cell anergy via GRAIL. J Immunol 2016; 196: 691–702. doi: 10.4049/jimmunol.1500710 [DOI] [PMC free article] [PubMed] [Google Scholar]
- 16.Pathak SK, Basu S, Battacharyya A, Pathak S, Kundu M, Basu J. Mycobacterium tuberculosis lipoarabinomannan-mediated IRAK-M induction negatively regulates Toll-like receptor-dependent interleukin -12p40 production in macrophages. J Bio Chem 2005; 280; 42794–42800. [DOI] [PubMed] [Google Scholar]
- 17.Blattes E, Vercellona A, Eutamene H, Turrin CO, Theodorou V, Majoral JP, et al. Mannodimers preventa cute lung inflammation by inhibiting neutrophil recruitment. Proc Natl Acad Sci USA 2013; 110: 8795–800. doi: 10.1073/pnas.1221708110 [DOI] [PMC free article] [PubMed] [Google Scholar]
- 18.Nigou J, Gilleron M, Rojas M, Garcia LF, Thurnher M, Puzo G. Mycobacterial lipoarabinomannan:modulators of dendritic cell function and apopoptic response. Microbes Infect 2002; 4:945–953. [DOI] [PubMed] [Google Scholar]
- 19.Chan J, Fan X, Hunter SW, Brenann PJ, Bloom BR. Lipoarabinomannan, a possible viruelence factor involvd in in persistence of Mycobacterium tuberculosis within macrophages. Infect Immun 1991; 59: 1755–1761. [DOI] [PMC free article] [PubMed] [Google Scholar]
- 20.Wilen A, Winberg ME, Abdalla H, Samdahl E, Rasmusson B, Stendahl O, et al. Incorporation of Mycobacterium tuberculosis lipoarabinomannan into macrophage memebrane rafts is a prerequisite for the phagosomal maturation block. Immun 2008; 76: 2882–2887. [DOI] [PMC free article] [PubMed] [Google Scholar]
- 21.Rook GAW, Al Attiyah R, Foley N. The role of cytokines in the immunopathology of tuberculosis and in the regulation of agalactosyl IgG. Lymphokine Res 1989; 8: 323–328. [PubMed] [Google Scholar]
- 22.Yuan Y, Crane DD, Simpson RM, Zhu YQ, Hickey MJ, Sherman DR, et al. The 16-kDa alpha crystalline (Acr) protein of Mycobacterium tuberculosis is required for growth in macrophages. Proc Natl Acad Sci USA 1998; 95: 9578–9583. [DOI] [PMC free article] [PubMed] [Google Scholar]
- 23.Yuan Y, Crane DD, Barry CE. Stationary phase associated protein expression in Mycobacterium tuberculosis: function of the mycobacterial alpha crystalline homolog. J Bacterio 1996; 178: 4484–4492. [DOI] [PMC free article] [PubMed] [Google Scholar]
- 24.Menozzi FD, Rouse JH, Alavi M, Laude-Sharp M, Muller J, Bischoff R et al. Identification of heparin binding hemaaglutnin present in mycobacteria. J Exp Med 1996; 184: 993–1001. [DOI] [PMC free article] [PubMed] [Google Scholar]
- 25.Zheng Q, Li Z, Zhou S, Zhang Q, Zhou L, Yang L, et al. Heparin-binding hemagglutnin of Mycobacterium tuberculosis is an inhibitor of autophagy. Fron Cell Infect Microbiol 2017; 7: 33 doi: 10.3389/fcimb.2017.00033 [DOI] [PMC free article] [PubMed] [Google Scholar]
- 26.Scott L, da Silva P, Boehme CC, Stevens W, Gilpin CM. Diagnosis of opportunistic infections:HIV co-infections-tuberculosis. Curr Opin HIV AIDS 2017; 12: 129–138 doi: 10.1097/COH.0000000000000345 [DOI] [PMC free article] [PubMed] [Google Scholar]
- 27.Legesse M, Ameni G, Medhin G, Mamo G, Franken KLMC, Ottenhoff THM, et al. IgA response to ESAT-6/CFP-10 and Rv2031 antigens varies in patients with culture-confirmed pulmonary tuberculosis, healthy Mycobacterium tuberculosis endemic setting, Ethiopia. Human Immunol 2013; doi: 10.1111/sji.2080 [DOI] [PubMed] [Google Scholar]
- 28.Wen HL, Li CL, Li G, Li HC, Zhao HM, Wu K, et al. Involvement of HBHA expressed from Mycobacterium smegmatis in an IFN-g release assay to aid discrimination between latent infection and active tuberculosis in BCG vaccinated populations. Eur J Clin Microbiol Infect Dis 2017; 36: 1415–1423. doi: 10.1007/s10096-017-2948-1 [DOI] [PubMed] [Google Scholar]
- 29.Delogu G, Vanni V, Cuzzi G, Chiacchio T, De Maaio F, Battah B, et al. Lack of response to HBHA in HIV-infected patients with latent tuberculosis infection. Scand J Immunol 2016; 84: 344–352. doi: 10.1111/sji.12493 [DOI] [PubMed] [Google Scholar]
- 30.Fukui M, Shinjo K, Umemura M, Shegeno S, Harakuni T, Arakawa T, et al. Enhanced effect of BCG vaccine against pulmonary Mycobacterium tuberculosis infection in mice with lung Th17 response to mycobacterial heparin-binding hemagglutnin adhesion antigen. Microbial Immunol 2015; 59: 735–743. [DOI] [PubMed] [Google Scholar]
- 31.Parra M, Pickett T, Delogu G, Dheenadhayalan V, Debrie AS, Locht C, et al. The mycobacterial heparin-binding hemagglutnin is protective antigen in the mouse aerosol challenge model of tuberculosis. Infect Immun 2004; 72: 6799–6805. doi: 10.1128/IAI.72.12.6799-6805.2004 [DOI] [PMC free article] [PubMed] [Google Scholar]
- 32.Abebe F, Belay M, Legesse M, Mihret A, Franken KS. Association of ESAT/CFP-10 induced IFN-γ TNF-α and IL-10 with clinical tuberculosis: evidence from cohorts of pulmonary tuberculosis patients, household contacts and community controls in an endemic setting. Cin Exp Immunol 2017; doi: 10.1111/cei.12972 [DOI] [PMC free article] [PubMed] [Google Scholar]
- 33.Belay M, Legesse M, Mihret A, Bekele Y, Bjune G, Abebe F. Lipoarabinomanna-specific TNFαand IFNγas markers of protective immunity against tuberculosis: a cohort study in an endemic setting. APMIS 2015; doi: 10.1111/apm.12423 [DOI] [PubMed] [Google Scholar]
- 34.Belay M, Legesse M, Mihret A, Bekele Y, Ottenhoff THM, Franken KLMC, et al. Pro-and anti-inflammatory cytokines against Rv2031 are elevated during latent tuberculosis: a study in cohorts of tuberculosis patients, household contacts and community controls in an endemic setting. Plos One 2015; doi: 10.1371/journal.pone.0124134 [DOI] [PMC free article] [PubMed] [Google Scholar]
- 35.Belay M, Legesse M, Dagne D, Mihret A, Bekele Y, Medhin G, et al. QunatiFERON-TB Gold In-Tube test conversions and reversions among tuberculosis patients and their household contacts in Addis Ababa: a one year follow up study. BMC Infect Dis 2014; 14: 654 doi: 10.1186/s12879-014-0654-5 [DOI] [PMC free article] [PubMed] [Google Scholar]
- 36.MOH. Guidelines for clinical and programmatic management of TB, leprosy and TB/HIV in Ethiopia Ministry of Health, Addis Ababa, 2012. Available:http://www.medbox.org/Ethiopia/guidelines-for clinical-and programmatic-management-of-tb-tb/hiv-and leprosy-in-ethiopia [Google Scholar]
- 37.MOH. Guidelines for HIV counseling and testing in Ethiopia Ministry of Health, Addis Ababa; 2007. available: http://www.who.int/hiv/topics/vct/ETH-HCT-guidelines [Google Scholar]
- 38.Robertson D, Altmann D, Barry C, Beshai B, Cole S, Dick T, et al. Detection and treatment of subclinical tuberculosis. Tuberculosis 2012; 92: 447–452. doi: 10.1016/j.tube.2012.06.004 [DOI] [PubMed] [Google Scholar]
- 39.Kunnath-Velayudhan S, Davdow L, Wang HY, Molina DM, Huynh VT, Salamon H, et al. Proteome-scale antibody responses and out-come of Mycobacterium tuberculosis infection in non-human primates and in tuberculosis patients. J Infct Dis 2012; 206: 697–705. [DOI] [PMC free article] [PubMed] [Google Scholar]
- 40.Chan ED, Reves R, Belisle JT, Brennan PJ & Hahn WE. Diagnosis of tuberculosis by a visually detectable immunoassay for lipoarabinomannan. Am J Resp Crit Care Med 2000; 161: 1713–1719 doi: 10.1164/ajrccm.161.5.9908125 [DOI] [PubMed] [Google Scholar]
- 41.David HL, Papa F, Papa P, Cruad P, Barlie HC, Maroja MF, et al. Relationships between titres of antibodies immunoreacting against glycolipid antigens from Mycobacterium leprae and M.tuberculosis, the Mitsuda and Mantoux reactions, and bacteriological loads: implications in the pthogenesis, epidemiology and serodiagnosis of leprosy and tuberculosis. Int J Leprosy 1992; 60: 208–224. [PubMed] [Google Scholar]
- 42.Kaushik A, Singh UB, Porwal C, Venugopal SJ, Mohan A, Krishnan A, et al. diagnostic potential of 16-kDa (HspX, alpha crystalline) antigen for serodiagnosis of tuberculosis. Ind J med Res 2012; 135: 771–777. [PMC free article] [PubMed] [Google Scholar]
- 43.Limongi LC, Olival L, Conde MB, Junkueira-Kipnis AP. Determination of levels of specific IgA to HspX recombinant antigen of Mycobacterium tuberculosis for the diagnosis of pleural tuberculosis. J BrasPneumol 37: 302–307. [DOI] [PubMed] [Google Scholar]
- 44.Sireci G, Dieli F, Liberto DD, Buccheri S, La Manna MP, Scarpa E, et al. anti-16-kilodalton mycobacterial protein immunoglobulin M levels in healthy but purified protein derivative-reactive children decrease after chemoprophylaxis. Clin Vacc Immunol 2007; 14: 1231–1234. [DOI] [PMC free article] [PubMed] [Google Scholar]
- 45.Baumann R, Kaempfer S, Chegou NN, Oehlmann W, Spallek R, Loxton AG, et al. A subgroup of latently Mycobacterium tuberculosis infected individuals is characterized by consisitently elevated IgA responses to several mycobacterial antigens. Mediators Inflamm 2015; http://dx.doi.org/10.1155/364758. [DOI] [PMC free article] [PubMed] [Google Scholar]
- 46.Awoniyi DO, Baumann R, Chegou NN, Kriel B, Jacobs R, Kidd M, et al. Detection of a combination of serum IgG and IgA antibodies against selected mycobacterial targets provides promising diagnostic signature for active TB. Oncotarget 2017; 8: 37525–37537. doi: 10.18632/oncotarget.16401 [DOI] [PMC free article] [PubMed] [Google Scholar]
- 47.Schroeder H & Cavacini L. Structure and function of immunoglobulins. J Allergy Clin Immunol 2010; 125: S41–S52. doi: 10.1016/j.jaci.2009.09.046 [DOI] [PMC free article] [PubMed] [Google Scholar]
- 48.Mattos AM, Almeida CS, Frankne KLMC, Alves CC, Abramo C, de Saouza MA, et al. Increased IgG1, IFN-γ, TNF-α and IL-6 responses to Mycobacterium tuberculosis antigens in patients with tuberculosis are lower after chemotherapy. Int Immunol 2010; 22: 775–782. doi: 10.1093/intimm/dxq429 [DOI] [PubMed] [Google Scholar]
- 49.Mutapi F, Ndhlovu PD, Hagan P, Spicer JT, Mduluga T, Turner CM, et al. Chemotherapy accelerates the development of acquired immune responses to Schistosoma haematobium infection. J Infect Dis 1998; 178: 289–293. [DOI] [PubMed] [Google Scholar]
- 50.Baumann R, Kaempfer S, Chegou NN, Nene NF, Veenstra M, Spallek R, et al. Serodiagnostic markers for the prediction of the outcome of intensive phase tuberculosis therapy. Tuberculosis 2013; 93: 239–245. doi: 10.1016/j.tube.2012.09.003 [DOI] [PubMed] [Google Scholar]
- 51.Fujita A, Doi T, Sato K, Yano I. Diverse humoral immune responses and changes in IgG antibody levels against mycobacterial lipid antigens in active tuberculosis. Microbiol 2005; 151: 2065–2074. [DOI] [PubMed] [Google Scholar]
- 52.Imaz MS, Comini MA, Zerbini E, Saqueira MD, Spoletti MJ, Etchart AA, et al. Evaluation of the diagnostic value of measuring IgG, IgM, and IgA antibodies to the recombinant 16-kDa antigen of Mycobacterium tuberculosis in childhood tuberculosis. Int J Tubrc Lung Dis 2000; 5: 1036–1043. [PubMed] [Google Scholar]
- 53.Julian E, Matas L, Ausina V, Luquin M. Detection of lipoarabinomannan antibodies in patients with newly acquired tuberculosis and patients with relapse tuberculosis. J Clin Microbiol 1997; 35: 2663–2663. [DOI] [PMC free article] [PubMed] [Google Scholar]
- 54.Julian E, Matas L, Alcaide J, Luquin M. Comparison of antibody responses to a potential combination of specific glycolipids and proteins for test sensitivity improvement in tuberculosis serodiagnosis. Clin Diagn Lab Immunol 2004; 11: 70–76. doi: 10.1128/CDLI.11.1.70-76.2004 [DOI] [PMC free article] [PubMed] [Google Scholar]
- 55.Raja A. Immunology of tuberculosis. Ind J Med Res 2009; 56: 255–268. [Google Scholar]
- 56.Lemassu A, Ortalo-Magne A, Bardou F, Silve G, Laneelle MA, Daffe M. Extracellular and surface-exposed polysaccharides of non-tuberculous mycobacteria. Microbiol 1996; 142:1513–1520. [DOI] [PubMed] [Google Scholar]
- 57.Rastogi N, Rauzier JY, Papa FP, David HL. Biochemical and cultural analysis of mycobacterial recombinants obtained by spheroplast fusion.Ann Inst Pasteur Microbiol 1986; 137A: 135–142. [DOI] [PubMed] [Google Scholar]
- 58.Fairchok MP, Rouse JH, Morris SL.Age-dependent humoral responses of children to mycobacterial antigens.Clin diagn Lab Immunol 1995; 2: 443–447. [DOI] [PMC free article] [PubMed] [Google Scholar]
Associated Data
This section collects any data citations, data availability statements, or supplementary materials included in this article.
Data Availability Statement
Data are available from the Norwegian Center for Research data (dataarkivering@nsd.no) after competition of research projects. The purpose of storing data with this center is for data protection (personal information). Therefore, any institution or individual that is interested in accessing such data must make a formal request and agreement with the Norwegian Center for Research data.


