Abstract
In ventricular myocytes, membrane depolarization during the action potential (AP) causes synchronous activation of multiple L-type CaV1.2 channels (LTCCs), which trigger the release of calcium (Ca2+) from the sarcoplasmic reticulum (SR). This results in an increase in intracellular Ca2+ (Cai) that initiates contraction. During pulsus alternans, cardiac contraction is unstable, going from weak to strong in successive beats despite a constant heart rate. These cardiac alternans can be caused by the instability of membrane potential (Vm) due to steep AP duration (APD) restitution (Vm-driven alternans), instability of Cai cycling (Ca2+-driven alternans), or both, and may be modulated by functional coupling between clustered CaV1.2 (e.g. cooperative gating). Here, mathematical analysis and computational models were used to determine how changes in the strength of cooperative gating between LTCCs may impact membrane voltage and intracellular Ca2+ dynamics in the heart. We found that increasing the degree of coupling between LTCCs increases the amplitude of Ca2+ currents (ICaL) and prolongs AP duration (APD). Increased AP duration is known to promote cardiac alternans, a potentially arrhythmogenic substrate. In addition, our analysis shows that increasing the strength of cooperative activation of LTCCs makes the coupling of Ca2+ on the membrane voltage (Cai→Vm coupling) more positive and destabilizes the Vm-Cai dynamics for Vm-driven alternans and Cai-driven alternans, but not for quasiperiodic oscillation. These results suggest that cooperative gating of LTCCs may have a major impact on cardiac excitation-contraction coupling, not only by prolonging APD, but also by altering Cai→Vm coupling and potentially promoting cardiac arrhythmias.
Author summary
Recent experimental studies have suggested that clusters of L-type CaV1.2 channels (LTCCs) can open and close in unison (i.e., cooperative or coupled gating) and that this gating modality may regulate excitation-contraction coupling in the heart. However, whether amplification of Ca2+ influx by cooperative gating of LTCCs promotes alternans is unknown. In this study, we developed a novel computational model of cooperative gating of LTCCs from experimental data. We incorporate the model into a physiologically detailed action potential (AP) model and investigated how changes in coupling strength of LTCCs may impact dynamics of AP and Ca2+ alternans. Our data suggest that increasing coupling strength of LTCCs prolongs AP duration and leads to Ca2+ overload. In addition, our theoretical and computational approaches elucidate that increasing coupling strength of LTCCs promotes positive Cai→Vm coupling, which could lead to Vm-driven and Ca2+-driven alternans.
Introduction
L-type CaV1.2 channels (LTCC) play a critical role in triggering cardiac muscle contraction during the action potential (i.e., excitation-contraction (EC) coupling) [1]. LTCCs are distributed in small clusters of about 10–12 [2–5] channels along the sarcolemma of these cells [1]. At the membrane potential reached during the plateau phase of the ventricular action potential (AP), LTCCs open, allowing Ca2+ ions to enter the cell. This Ca2+ signal is amplified via Ca2+-induced Ca2+ release through opening of ryanodine receptors (RyRs) from the sarcoplasmic reticulum (SR), which causes a cell-wide increase in Ca2+ that triggers cell contraction [6, 7].
Recent experimental studies [2, 8, 9, 28] have suggested that clusters of LTCCs can open and close in unison (i.e., cooperative or coupled gating). Functional coupling between LTCCs requires Ca2+ for the induction of physical interactions between adjacent channels that ultimately leads to amplification of Ca2+ influx. This suggests the intriguing hypothesis that cooperative gating of LTCCs may impact membrane voltage (Vm) and intracellular Ca2+ (Cai) cycling dynamics.
In cardiac myocytes, the dynamics of Vm are highly nonlinear. The LTCC current (ICaL) is one of the major currents, which determines the plateau membrane potential and regulates Vm dynamics. For example, a slower recovery of LTCC steepens the action potential duration (APD) restitution curve and promotes APD alternans [10–12]. Also, reactivation of LTCC during the plateau phase can cause early afterdepolarizations [13–15]. Furthermore, intracellular Ca2+ cycling also has its own nonlinear dynamics [12, 16]. In fact, AP clamp experiments showed that the unstable Cai cycling can induce Cai transient alternans without APD alternans [16]. The dynamics of Cai cycling is primary regulated by a steep SR Ca2+ release vs. SR Ca2+ load relationship [17–19] and thus RyR sensitization or Ca2+ overload often leads to Ca2+ alternans.
In this study, we generated a novel computational model of ICaL based on experimental data and APs that incorporates cooperative gating of LTCCs and used it in physiologically detailed AP models to investigate the effects of varied degrees of LTCC coupling on Ca2+ entry, APD, and the likelihood of promoting voltage and Ca2+ alternans.
Materials and methods
We developed two computational models. One is a totally stochastic model of cooperative gating (hereafter, we call it ‘stochastic model’). In this model, we simulated individual LTCCs described by a stochastic Markov model. Using this model, we investigated ICaL properties by comparing with experimental observations. The other is a deterministic model based on the stochastic model (hereafter, we call it ‘ionic model’). Since simulation of the stochastic model is highly computationally intensive and thus time-consuming, we developed the ionic model to permit the investigation of steady state alternans within a practical time frame.
Stochastic model
We used a physiologically detailed subcellular Ca2+ cycling model as in our previous studies [20–22], which is based on the rabbit ventricular myocyte model by Restrepo et al. [23]. Whereas the main structure of our model is similar to the Restrepo model, a key difference in our model is the open probability of RyRs. We reduced the number of RyRs opening during a spark from nearly 100 in the Restrepo model to only 5–10 to fit the experimental observation [20].
Cell geometry
The dimension of this model is 121 μm × 25 μm × 11 μm and there are 19,305 (65×27×11) Ca2+ release units (CRUs). The separations of CRU are 1.84 μm and 0.9 μm in the longitudinal direction and transverse direction, respectively. Experimental observations indicate that each CRU contains about 10 LTCCs [24, 25]. Each CRU in this model contains at least 1 LTCC, but no more than 25. The cluster size obeys Gaussian distribution with a mean of 10 and standard deviation of 3. One CRU contains 100 RyRs, thus yielding ~1,930,500 RyRs in the cell. In each CRU, there are 5 compartments for Ca2+; cytosolic Ca2+ ([Ca2+]i, ci in equations), sub-membrane Ca2+ ([Ca2+]s, cs in equations), cleft space Ca2+ ([Ca2+]Cleft, cp in equations), network SR Ca2+ ([Ca2+]SR, cNSR in equations), and junctional SR Ca2+ ([Ca2+]JSR, cJSR in equations). CRUs are connected by Ca2+ diffusion in the cytosol and the network SR. The RyR is described by a four-state Markovian model and each RyR also opens stochastically depending on cleft space Ca2+ concentration ([Ca2+]Cleft) and junctional SR Ca2+ concentration ([Ca2+]JSR). SERCA pumps are distributed equally over the cell.
Ca2+ cycling
Intracellular Ca2+ cycling is governed by the following equations:
where vi is the local cytosolic volume, vs is the local submembrane space volume, vp is the local proximal space volume, vJSR is the local JSR volume, βi is the instantaneous buffer function for ci, βs is the instantaneous buffer function for cs, βp is the instantaneous buffer function for cp, βJSR is the instantaneous buffer function for cJSR, ITCi is time-dependent buffering to Troponin C for ci, ITCs is time-dependent buffering to Troponin C for cs, Idsi is the diffusive current between cs and ci, Iup is the uptake current, Ici is the nearest-neighbor diffusive current for ci, Ics is the nearest-neighbor diffusive current for cs, Idps is the diffusive current between cp and cs, INCX is the sodium-calcium exchange current, ICaBk is the background sarcolemmal membrane Ca flux, ISLCaP is the sarcolemmal membrane Ca pump, Ir is the release current, ICaL is the L-type Ca current, Itr is the JSR refilling current, IcNSR is the nearest-neighbor diffusive current for cNSR, superscript n shows the n-th compartment.
The diffusive currents between different compartments are the same as those previously employed by Restrepo et al. [23].
Cooperative gating of LTCCs and L-type Ca current
As stated above, each CRU contains between 1 and 25 LTCCs. ICaL is described by
where iCaL is the single channel current, NL is the number of open channels from 0 to 25, z = VF/(RT). LTCC activity is described by a Markov model with stochastic openings (Fig 1). NL is determined by the number of open states of the Markov model within the CRU. Channel coupling and its [Ca2+]Cleft dependence were incorporated in the LTCC model as follows. α in Fig 1 was replaced with α∙γ1 where
and r1 in Fig 1 was replaced with r1∙γ2 where
pox and cpx are parameters, which control the sensitivity of the coupling, w1 and w2 are the coupling strength. Other rates in Fig 1 are given by:
Fig 1. 7-state Markov model of the L-type Ca channel.
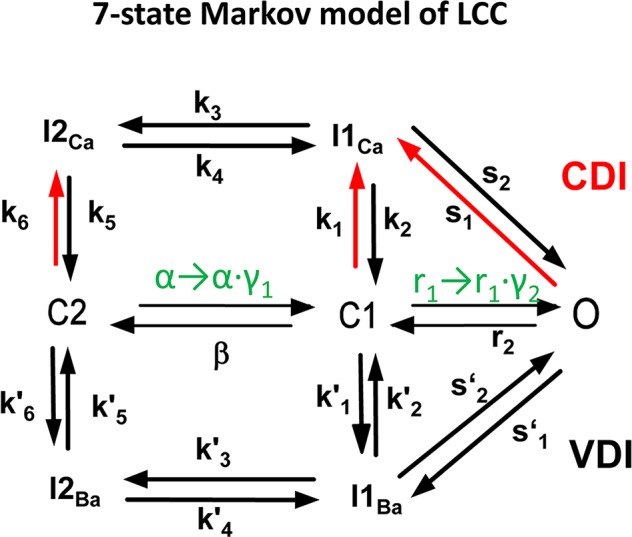
γ1 and γ2 are Ca2+ and the number of open channels dependent.
Note that the notations employed here are the same as those used by Mahajan et al. in [26]. A table of constants and the detailed formulation for other current fluxes to reproduce our results can be found in the supplemental material section.
Ionic model
In order to investigate physiological and dynamic regulation of alternans by cooperative gating of LTCCs, we use the action potential (AP) and Cai cycling model of the ventricular myocyte by Shiferaw et al. [12] since we know which parameters control Vm and Ca2+ dynamics in this model.
The dynamics of membrane voltage (Vm) are described by the equation:
where Iion is the total membrane current density, Istim is the stimulus current, and where Cm is the cell membrane capacitance. The total membrane current is given by:
where INa is the fast sodium current, Ito is the transient outward potassium current, IKr is the rapid component of the delayed rectifier potassium current, IKs is the slow component of the delayed rectifier potassium current, IKp is the plateau potassium current, IK1 is the inward rectifier potassium current, INaCa is the sodium-Ca2+ exchanger, and ICaL is the L-type Ca2+ current.
Ca2+ cycling was modeled by following Shiferaw et al. [19]. This model describes Ca2+ released from the SR as a summation of local release fluxes distributed throughout the cell. The equations for Ca2+ cycling are:
where cs, ci and cj are the average concentrations of free Ca2+ in a thin layer just below the cell membrane, in the cytosol, and the SR, with volumes vs, vi and vsr respectively. Here the SR volume includes both JSR and NSR. Also is the average JSR Ca2+ concentration within dyadic junctions in the whole cell. The factors βi and βs describe instantaneous buffering to Calmodulin, the SR membrane, and Troponin C.
All Ca fluxes are divided by vi and have units of μM/ms, which can be converted to units of μA/μF using the conversion factor nFvi/Cm, where n is the ionic charge of the charge carrier, and where F is Faraday's constant. Therefore, ionic fluxes can be converted to currents by:
where α = Fvi/Cm, and where the ion currents are in units of μA/μF.
The L-type Ca2+ current flux (JCaL):
JCaL is given by
where gCa is the maximum conductance of JCaL, d is activation, f is voltage-dependent inactivation and fCa is the Ca2+ dependent inactivation, iCa is the single channel current.
To replicate the Markov model shown above, cooperative gating and its Ca2+ dependence were incorporated in the LTCC model as follows:
where γd is the coupling, which depends on the open probability of LTCC (poCa = d ∙ f ∙ fCa) and submembrane [Ca2+] (cs), pox and csx are parameters, which control the sensitivity of the coupling, w is the coupling strength.
Voltage-dependent inactivation and the Ca2+ dependent inactivation are given by
The single channel current is given by
with a = VmF/RT.
We varied the recovery time constant (τf) of the inactivation gate (f) of LTCCs to control the stability of the Vm system since it is known that the steepness of APD restitution is sensitive to it. In order to control the stability of the Ca2+ system, we varied the steepness of the slope (u) of the SR Ca2+ release function, which controls the sensitivity of release to SR load. The degree of Ca2+ dependent inactivation (γ) was varied to obtain positive Cai→Vm coupling (γ = 0.7) and negative Cai→Vm coupling (γ = 1.5).
Tables of constants and the detailed formulation for other current fluxes and buffers can be found in the supplemental material section. All programs were written in C++ and run on a 24-node High-Performance Computing cluster and Amazon Cloud Computing Services. An expanded section with all equations can be found in the supplemental material section. The C++ code is available via our website.
Results and discussion
Model of cooperative gating (Stochastic model)
We built a stochastic model of cooperative gating of LTCCs and incorporated this gating modality into the subcellular Ca2+ cycling model, which has realistic Ca2+ compartments and diffusion. In this model, LTCC and RyR activity depends on the Vm, [Ca2+]Cleft, the degree of LTCC coupling within a cluster as well as [Ca2+]Cleft and [Ca2+]JSR (RyR).
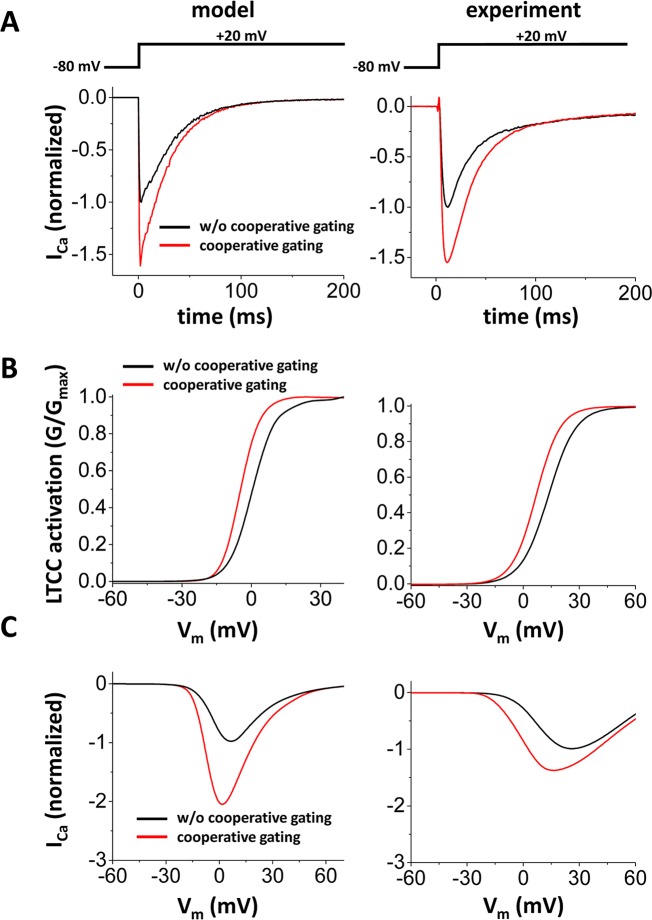
Validation of the model involved the use of experimental data. When LTCCs are coupled, simultaneous opening events occurred more often (Fig 2A). Without cooperative gating, events of simultaneous opening of >2 channels are rare. On the other hand, with cooperative gating, events of simultaneous opening of 2 to 6 channels often occurred. Also, open dwell time of the LTCC cluster becomes longer with cooperative gating of LTCCs (Fig 2B vs 2C). We also measured the current-voltage relationship of ICaL and the activation curve. To measure these curves, we used the same protocol used in the experimental study by Dixon et al. [9]. To be more specific, the membrane potential was depolarized from a holding potential of -80 mV to a specified test potential. Fig 3A shows one example of ICaL vs time when Vm is depolarized from -80 mV to +20 mV. When cooperative gating is introduced, the peak of ICaL was about 1.5 times larger than that of ICaL without coupling. Cooperative gating of LTCCs shifted the activation curve to the left about 5 or 6 mV (Fig 3B) and nearly doubled the peak ICaL (Fig 3C). Activation occurs at slightly lower voltage in the model. This discrepancy could be due to species differences as the model is built based on rabbit experiments [26] yet the experimental data collected by Dixon et al. was obtained from mouse cardiomyocytes [9]. Regardless of this, our in silico results are generally consistent with the previously reported experimental observations [9, 27]. Furthermore, they support the use of this model to examine the effects of LTCC coupling on Ca2+ entry, APD, and voltage and Ca2+ alternans.
Fig 2. The stochastic model of cooperative gating of LTCCs.
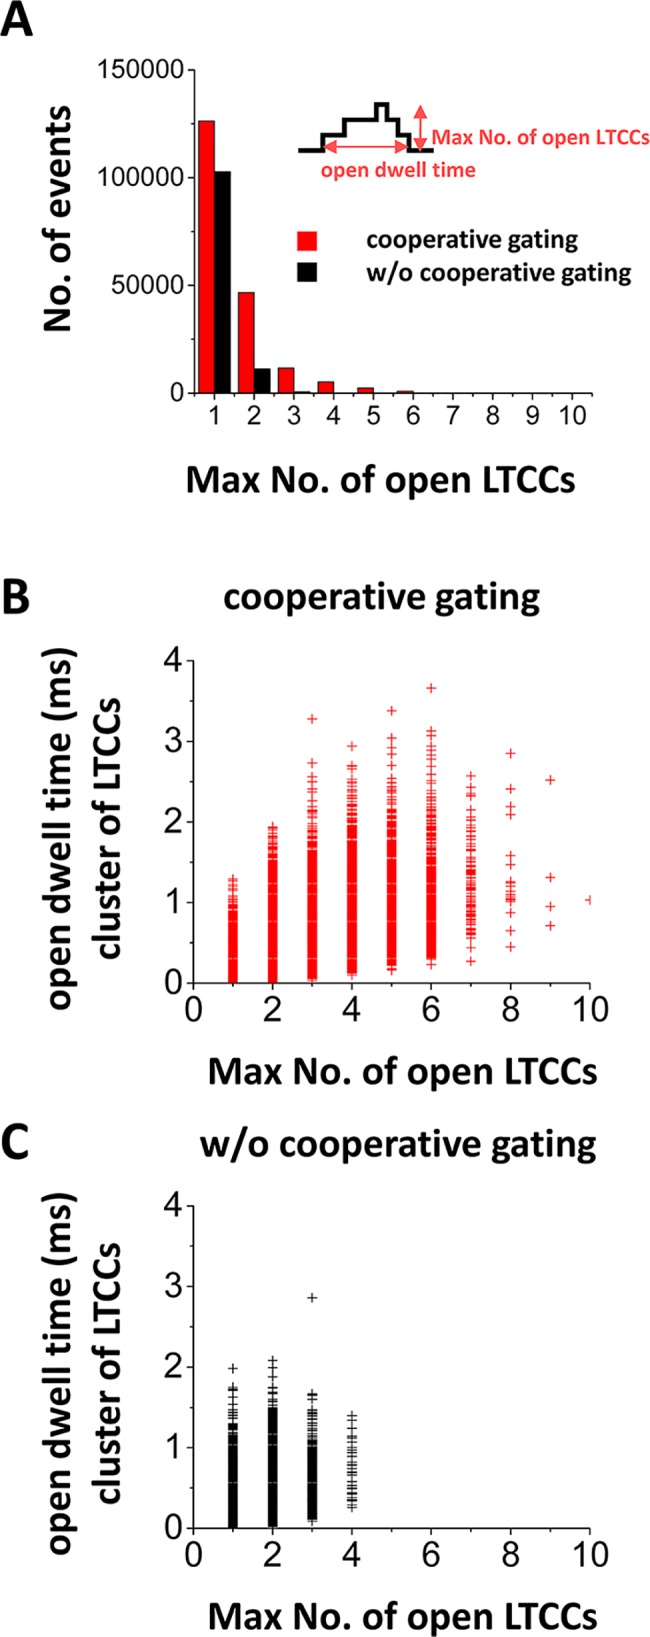
In this model, LTCCs and RyRs open stochastically. (A) The histogram of the maximum number of open LTCCs. Cooperative gating promotes simultaneous opening. (B) open dwell time of the cluster of LTCCs with coupling gating of LTCCs. (C) open dwell time of the cluster of LTCCs without coupling gating of LTCCs. In these simulations, the CRU contains 10 LTCCs.
Fig 3. The stochastic model of cooperative gating of LTCCs (properties of ICaL).
Left panels: Model results Right panels: Experimental results reconstructed from ref [9]. (A) ICaL vs time when Vm is depolarized from -80 mV to +20 mV. (B) Activation curve of LTCC without cooperative gating (black) and with cooperative gating (red). (C) I-V curve of ICaL without cooperative gating (black) and with cooperative gating (red).
To test if cooperative gating promotes alternans, the cell was paced with and without cooperative gating at fast rates. Fig 4 shows the development of alternans and its steady states. The cell was paced at pacing cycle length (PCL) = 300 ms. Without cooperative gating, alternans was not observed (black traces in each panel). However, when cooperative gating was introduced, alternans was developed within 100 beats (Fig 4A: voltage and Fig 4B: Ca2+). It reached the steady state after ~30 beats (Fig 4C & 4D). APD alternans amplitude (ΔAPD) is defined as
Fig 4. Cooperative gating promotes alternans.
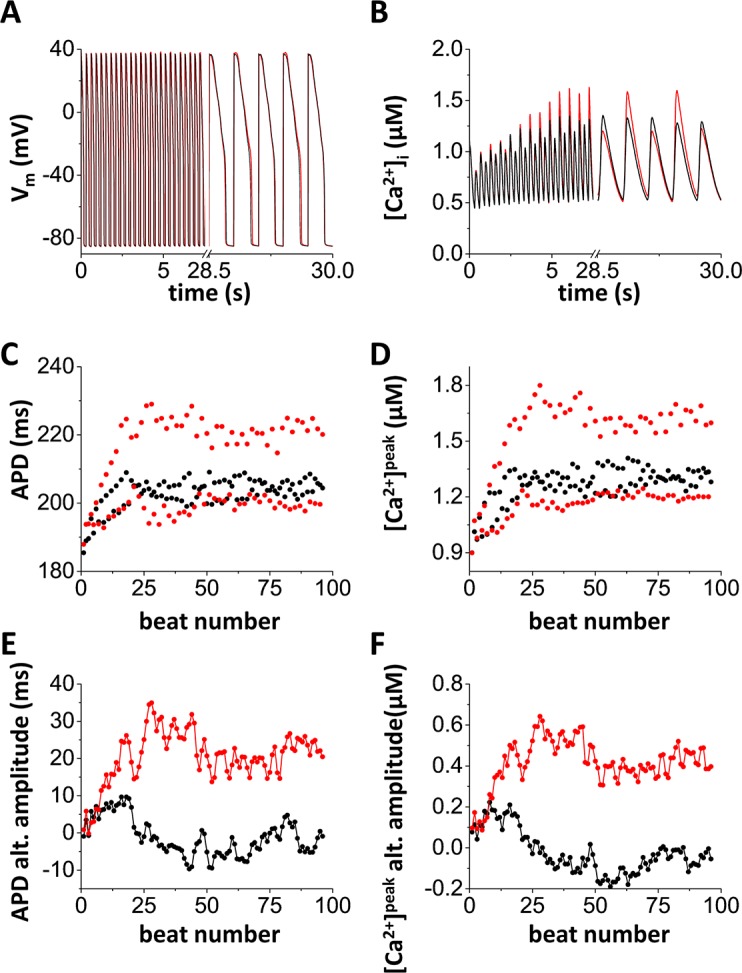
The cell with (red) /without (black) cooperative gating was paced at PCL = 300 ms. The initial conditions are the same in both cases. Alternans was developed within 100 beats only if cooperative gating was introduced. (A) The membrane potential vs time. (B) cytosolic [Ca2+] vs time. (C) APD vs the beat number. (D) peak cytosolic [Ca2+] vs the beat number. (E) APD alternans amplitude vs the beat number. (C) peak cytosolic [Ca2+] alternans amplitude vs the beat number.
Ca2+ transient alternans amplitude (ΔCa2+) is defined as
Without cooperative gating, alternans amplitudes fluctuate around zero. On the other hand, if cooperative gating is introduced, alternans amplitudes stay and fluctuate around certain values (Fig 4E & 4F). When the cell is paced at a faster rate (PCL = 290 ms), alternans occurred in both cases. However, APD and Ca2+ transient alternans amplitudes were much larger when LTCCs were coupled (S1 Fig). These results are consistent with experimental results [9]. Ca2+ transient alternans was observed when the cell was paced at PCL = 300 ms using a clamped AP waveform. This implies that Ca2+ cycling is unstable and contributes development of alternans.
Functional effects of cooperative gating on alternans: Mathematical analysis
Alternans can be caused by instability of Vm due to steep APD restitution or instability of Cai cycling due to steep SR Ca2+ release vs. SR Ca2+ load relationship, or both [11, 12] (Fig 5A). The Vm dynamics and Ca2+ dynamics are coupled via Ca2+-sensitive currents such as ICaL and the Na+-Ca2+ exchanger (NCX). When the Cai transient becomes larger, NCX prolongs the APD, whereas the ICaL shortens the APD due to Ca2+-induced inactivation of the channel. Therefore, if NCX dominates, APD becomes longer as the Cai transient becomes larger. In our previous study [12], we defined this as positive coupling of Ca2+ on Vm (positive Cai→Vm coupling, Fig 5B left). On the other hand, if ICaL dominates, APD becomes shorter as the Ca2+ transient becomes larger. We defined this as negative coupling of Ca2+ on Vm (negative Cai→Vm coupling, Fig 5B right). The stability of the coupled system is determined by the eigenvalues of a two dimensional map (see ref. [12] for details). The eigenvalues are:
where λv is the eigenvalue associated with the map of the voltage system and λc is the eigenvalue associated with the map of the Ca2+ system, and C is coupling of Ca2+ on the membrane voltage. If Vm and Cai are uncoupled (C = 0), the system becomes unstable (i.e. alternans occurs) when λv or λc exceeds unity in absolute value. Black lines in Fig 6A and 6B show stability boundaries (|λ| = 1) when the Cai→Vm coupling is positive (C = 0.1, Fig 6A) and negative (C = -0.1, Fig 6B) from our previous study [12].
Fig 5. Cell dynamics and positive and negative Cai→Vm coupling.
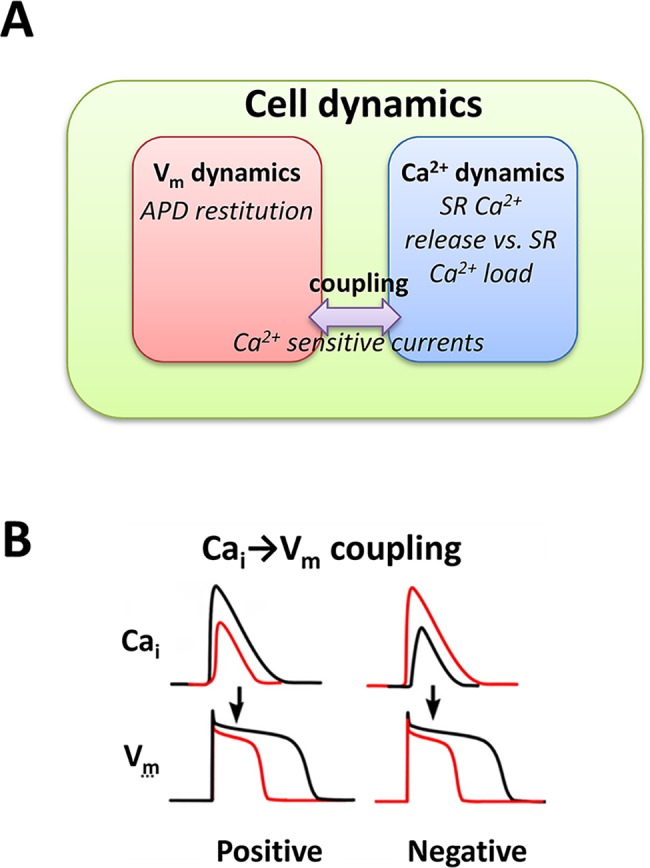
(A) Coupled dynamics of Vm and Ca2+. The Vm dynamics is governed by APD restitution. Ca2+ dynamics is governed by SR Ca2+ release vs. SR Ca2+ load relationship. The Vm dynamics and Ca2+ dynamics are coupled via Ca2+-sensitive currents. (B) Positive and negative Cai→Vm coupling.
Fig 6. Theoretical analysis of the effects of coupled gating of LTCCs.
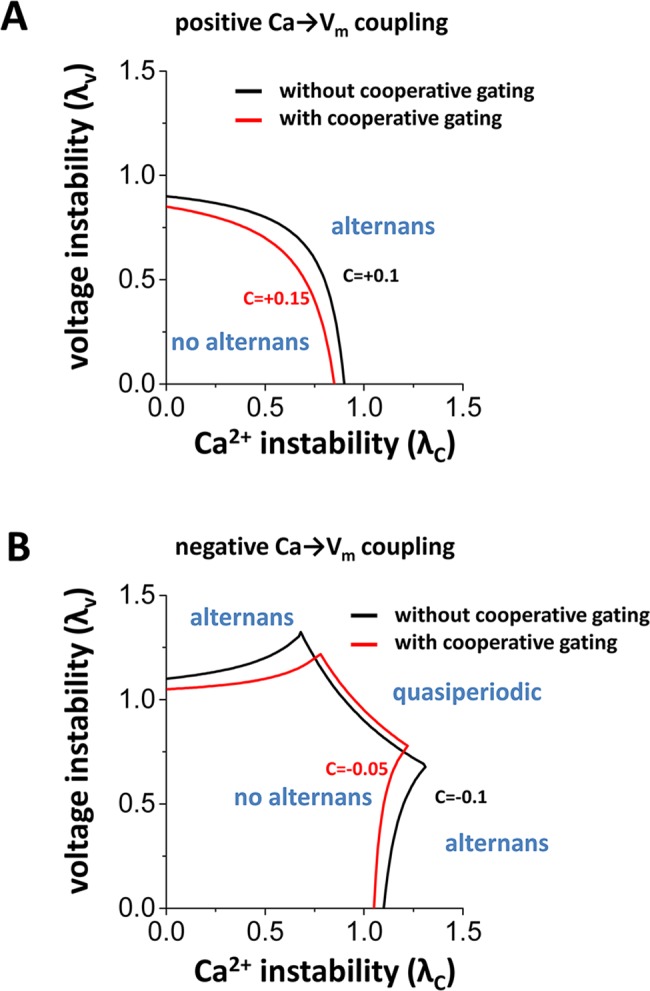
(A) Stability boundary in the case of positive Cai→Vm coupling. Black line C = 0.1 (without cooperative gating). Red line C = 0.15 (with cooperative gating). (B) Stability boundary in the case of negative Cai→Vm coupling. Black line C = -0.1 (without cooperative gating). Red line C = -0.05 (with cooperative gating).
It is also known that Ca2+ is required for the process of cooperative gating of LTCCs [2, 29]. Therefore, larger Ca2+ transients could tend to prolong APD due to increased strength of cooperative gating of LTCCs. In other words, cooperative gating of LTCCs may promote positive Cai→Vm coupling. Consistent with this, red lines in Fig 6A and 6B show the stability boundary of alternans when Cai→Vm coupling became more positive (C = 0.15, Fig 6A) and less negative (C = -0.05, Fig 6B). An increase in the strength of cooperative gating of LTCCs prolongs APD, which promotes steep APD restitution and increases Ca2+ influx, which may destabilize Ca2+ cycling. In addition, this analysis suggests that cooperative gating of LTCCs may destabilize the system (the stable areas became smaller) and promotes alternans except for the quasiperiodic regime.
Functional effects of cooperative gating on alternans: Simulation (ionic model)
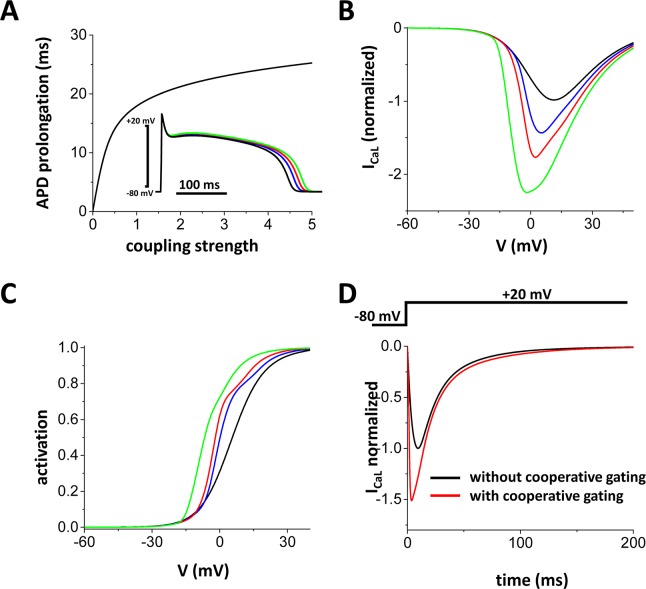
To test our theoretical predictions above, we simulated alternans with the ionic model as described in the Methods section. Fig 7A shows that as the coupling strength became larger, APDs became longer. In this simulation, the cell was paced until it reaches the steady state. We chose parameters that do not cause alternans (τf = 45 ms, u = 3 s-1) without coupling (w = 0). Subsequently, the coupling strength was varied and the APD prolongation was measured. The inset shows the action potentials with w = 0.3 and 1.0. When the coupling strength is increased to 1.0, The peak of the current-voltage curve of ICaL was almost doubled (Fig 7B). Increased coupling strength of LTCCs also shifts the activation curve to the left (Fig 7C). In Fig 7D, ICaL vs time is shown when Vm is depolarized from -80 mV to 20 mV. Cooperative gating resulted in a 1.5-fold increase in peak ICaL. These data are consistent with the results with the stochastic model (Fig 3) and experimental observations [9, 27].
Fig 7. The deterministic model of cooperative gating of LTCCs.
(A) Coupling gating of LTCCs prolongs APs. Inset: Vm vs time. Black: w = 0, Blue: w = 0.3, Red: w = 1, Green: w = 5. (B) I-V curve of ICaL. Black: w = 0, Blue: w = 0.3, Red: w = 1, Green: w = 5. (C) Activation curve of LTCC. Black: w = 0, Blue: w = 0.3, Red: w = 1, Green: w = 5. (D) ICaL vs time when Vm is depolarized from -80 mV to +20 mV. w = 1.
We also measured the stability boundary to test if increased strength of cooperative gating of LTCCs alters the stability as we predicted in the mathematical analysis (Fig 6). To investigate the effect of the change in channel cooperativity on alternans, we perturbed the cell by changing the coupling strength from w = 0 to w = 0.03. Fig 8A shows the stability boundary when Cai→Vm coupling is positive and Fig 8B shows the stability boundary when Cai→Vm coupling is negative. In both cases, Vm-driven alternans and Ca2+-driven alternans are promoted with increased coupling strength of LTCCs. On the other hand, quasiperiodic oscillations are not affected. These results are consistent with the theoretical prediction (Fig 6A vs Fig 8A & Fig 6B vs Fig 8B). We note that this is not due to APD prolongation but due to Cai→Vm coupling. In fact, unlike Fig 8B, simple prolongation of APD by the reduced potassium current stabilizes Ca2+-driven alternans when the coupling is negative (S3 Fig). If the coupling strength is within the physiological range, cooperative gating can change the sign of Cai→Vm coupling from negative to positive (S4 Fig).
Fig 8. Coupling gating of LTCCs promotes positive Cai→Vm coupling.
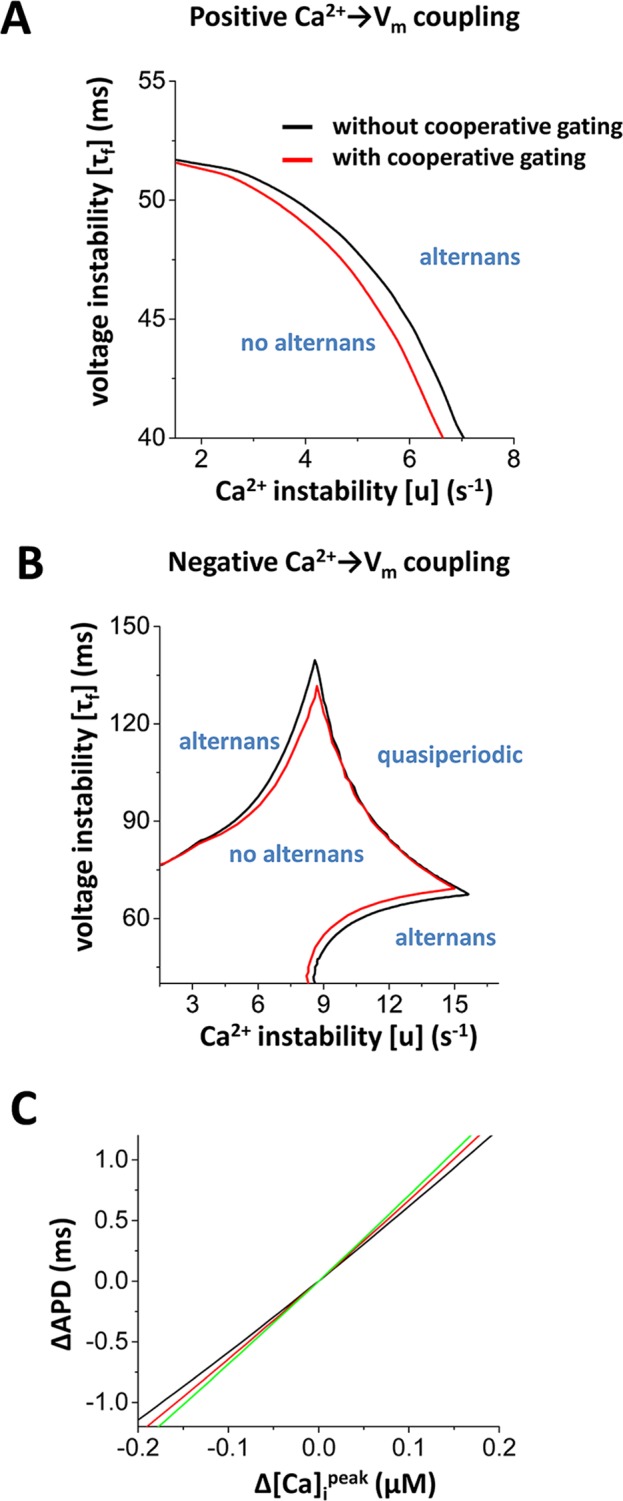
(A) Stability boundary in the case of positive Cai→Vm coupling. The coupling strength is 0.03. (B) Stability boundary in the case of negative Cai→Vm coupling. The coupling strength is 0.03. (C) Coupling gating of LTCCs promotes positive Cai→Vm coupling. The original Cai→Vm coupling is positive. The slope became steeper with cooperative gating of LTCCs. The coupling strength is 0 (black), 0.05 (red), and 0.1 (green).
Fig 8C shows that as the coupling strength became larger, Cai→Vm coupling became more positive. In this simulation, after reaching the steady state, initial [Ca2+]SR was varied to change the amplitude of the Ca2+ transients and then the cell was paced once and the change in the APD was measured. The slope of Δ Ca2+ vs ΔAPD shows Cai→Vm coupling. In Fig 8C, the slope became more positive as the coupling strength becomes larger, thus indicating that cooperative gating of LTCCs promotes positive Cai→Vm coupling.
Cooperative gating, excitation-contraction coupling, and arrhythmias
Cooperative gating of LTCCs facilitates synchronized opening of LTCCs, which may have a major impact on cardiac excitation-contraction coupling due to Ca2+ signal amplification. In this study, we built stochastic and deterministic computational models of cooperative gating of LTCCs and investigated how this gating modality may affect dynamics of the Vm and Cai cycling system, especially focusing on alternans, which is the arrhythmogenic substrate.
The novelty of our work is three-fold. Firstly, we model cooperative gating of LTCCs for the first time and add the complexity of this gating phenomenon to the existing models, bringing it more in-line with current thinking on Ca2+ signaling. We have thus generated a computational model encompassing cooperative gating of LTCCs, which has not been done before. Secondly, we model the effects of cooperative gating on alternans, finding that, in agreement with previously published experimental data [9], aberrant levels of cooperative gating can lead to Ca2+ alternans. Our theoretical and computational approaches suggest that increases in the strength of cooperative gating of LTCCs promotes positive Cai→Vm coupling and thus promotes Vm-driven and Ca-driven alternans. Finally, we confirmed that our model could reproduce experimental data, by specifically examining the effects of changes in the strength of cooperative gating of LTCCs on L-type Ca2+ currents. The degree of LTCC cooperativity can vary depending on physiological and pathological conditions. Our model provides an in silico means to explore the effects of LTCC cooperative gating under various conditions. In addition, Cai→Vm coupling at the cellular level has been linked to mechanisms of spatially discordant alternans in tissue [30–32]. These findings underscore the importance of cooperative gating of LTCCs in excitation-contraction coupling and cardiac arrhythmias.
Supporting information
The initial conditions are the same in both cases. Alternans was developed within 100 beats in both cases. (A) The membrane potential vs time. (B) cytosolic [Ca2+] vs time. (C) APD vs the beat number. (D) peak cytosolic [Ca2+] vs the beat number. (E) APD alternans amplitude vs the beat number. (C) peak cytosolic [Ca2+] alternans amplitude vs the beat number.
(TIFF)
Ca2+ transient alternans was observed. This demonstrate Ca2+ cycling is unstable and contributes development of alternans.
(TIFF)
GKr was reduced by 50%. (A) positive Cai→Vm coupling (B) negative Cai→Vm coupling.
(TIFF)
Black: w = 0, Red: w = 1.
(TIFF)
Data Availability
All relevant data are within the paper and its Supporting Information files. The mathematical model is available via our website (http://www.ucdmc.ucdavis.edu/pharmacology/).
Funding Statement
This work was supported by National Institutes of Health (https://www.nih.gov/) grant R00-HL111334, American Heart Association (http://www.heart.org/) Grant-in-Aid 16GRNT31300018, and Amazon (https://aws.amazon.com/) AWS Cloud Credits for Research (DS), American Heart Association (http://www.heart.org/) Scientist Development Grant 15SDG25560035 (RED), National Institutes of Health grant R01-HL085686 and R01-HL085870 (LFS) and National Institutes of Health grant R01-HL121059 and R01-HL098200 (MFN). The funders had no role in study design, data collection and analysis, decision to publish, or preparation of the manuscript.
References
- 1.Bers DM. Cardiac excitation-contraction coupling. Nature. 2002;415(6868):198–205. doi: 10.1038/415198a . [DOI] [PubMed] [Google Scholar]
- 2.Dixon RE, Moreno CM, Yuan C, Opitz-Araya X, Binder MD, Navedo MF, et al. Graded Ca2+/calmodulin-dependent coupling of voltage-gated CaV1.2 channels. eLife. 2015;4:e05608 doi: 10.7554/eLife.05608 [DOI] [PMC free article] [PubMed] [Google Scholar]
- 3.Bers DM, Stiffel VM. Ratio of ryanodine to dihydropyridine receptors in cardiac and skeletal muscle and implications for E-C coupling. Am J Physiol. 1993;264(6 Pt 1):C1587–93. Epub 1993/06/01. doi: 10.1152/ajpcell.1993.264.6.C1587 . [DOI] [PubMed] [Google Scholar]
- 4.Franzini-Armstrong C, Protasi F, Ramesh V. Shape, size, and distribution of Ca(2+) release units and couplons in skeletal and cardiac muscles. Biophys J. 1999;77(3):1528–39. Epub 1999/08/31. doi: 10.1016/S0006-3495(99)77000-1 ; PubMed Central PMCID: PMCPMC1300440. [DOI] [PMC free article] [PubMed] [Google Scholar]
- 5.Soeller C, Crossman D, Gilbert R, Cannell MB. Analysis of ryanodine receptor clusters in rat and human cardiac myocytes. Proc Natl Acad Sci U S A. 2007;104(38):14958–63. Epub 2007/09/13. doi: 10.1073/pnas.0703016104 ; PubMed Central PMCID: PMCPMC1986595. [DOI] [PMC free article] [PubMed] [Google Scholar]
- 6.Cheng H, Lederer MR, Xiao RP, Gomez AM, Zhou YY, Ziman B, et al. Excitation-contraction coupling in heart: new insights from Ca2+ sparks. Cell Calcium. 1996;20(2):129–40. . [DOI] [PubMed] [Google Scholar]
- 7.Cheng H, Lederer WJ, Cannell MB. Calcium sparks: elementary events underlying excitation-contraction coupling in heart muscle. Science. 1993;262(5134):740–4. . [DOI] [PubMed] [Google Scholar]
- 8.Navedo MF, Cheng EP, Yuan C, Votaw S, Molkentin JD, Scott JD, et al. Increased coupled gating of L-type Ca2+ channels during hypertension and Timothy syndrome. Circulation research. 2010;106(4):748–56. Epub 2010/01/30. doi: 10.1161/CIRCRESAHA.109.213363 ; PubMed Central PMCID: PMCPmc2834417. [DOI] [PMC free article] [PubMed] [Google Scholar]
- 9.Dixon RE, Yuan C, Cheng EP, Navedo MF, Santana LF. Ca2+ signaling amplification by oligomerization of L-type Cav1.2 channels. Proceedings of the National Academy of Sciences. 2012;109(5):1749–54. doi: 10.1073/pnas.1116731109 [DOI] [PMC free article] [PubMed] [Google Scholar]
- 10.Fox JJ, McHarg JL, Gilmour RF Jr. Ionic mechanism of electrical alternans. Am J Physiol Heart Circ Physiol. 2002;282(2):H516–30. doi: 10.1152/ajpheart.00612.2001 . [DOI] [PubMed] [Google Scholar]
- 11.Weiss JN, Karma A, Shiferaw Y, Chen PS, Garfinkel A, Qu Z. From pulsus to pulseless: the saga of cardiac alternans. Circulation research. 2006;98(10):1244–53. doi: 10.1161/01.RES.0000224540.97431.f0 . [DOI] [PubMed] [Google Scholar]
- 12.Shiferaw Y, Sato D, Karma A. Coupled dynamics of voltage and calcium in paced cardiac cells. Phys Rev E Stat Nonlin Soft Matter Phys. 2005;71(2 Pt 1):021903 doi: 10.1103/PhysRevE.71.021903 . [DOI] [PMC free article] [PubMed] [Google Scholar]
- 13.Sato D, Xie LH, Sovari AA, Tran DX, Morita N, Xie F, et al. Synchronization of chaotic early afterdepolarizations in the genesis of cardiac arrhythmias. Proc Natl Acad Sci U S A. 2009;106(9):2983–8. doi: 10.1073/pnas.0809148106 ; PubMed Central PMCID: PMC2651322. [DOI] [PMC free article] [PubMed] [Google Scholar]
- 14.Viswanathan PC, Rudy Y. Pause induced early afterdepolarizations in the long QT syndrome: a simulation study. Cardiovascular Research. 1999;42(2):530–42. doi: 10.1016/s0008-6363(99)00035-8 [DOI] [PubMed] [Google Scholar]
- 15.Xie Y, Izu LT, Bers DM, Sato D. Arrhythmogenic transient dynamics in cardiac myocytes. Biophys J. 2014;106(6):1391–7. doi: 10.1016/j.bpj.2013.12.050 ; PubMed Central PMCID: PMC3984988. [DOI] [PMC free article] [PubMed] [Google Scholar]
- 16.Chudin E, Goldhaber J, Garfinkel A, Weiss J, Kogan B. Intracellular Ca 2+ dynamics and the stability of ventricular tachycardia. Biophysical journal. 1999;77(6):2930–41. doi: 10.1016/S0006-3495(99)77126-2 [DOI] [PMC free article] [PubMed] [Google Scholar]
- 17.Diaz ME, O'Neill SC, Eisner DA. Sarcoplasmic reticulum calcium content fluctuation is the key to cardiac alternans. Circulation research. 2004;94(5):650–6. doi: 10.1161/01.RES.0000119923.64774.72 . [DOI] [PubMed] [Google Scholar]
- 18.Bassani JW, Yuan W, Bers DM. Fractional SR Ca release is regulated by trigger Ca and SR Ca content in cardiac myocytes. Am J Physiol. 1995;268(5 Pt 1):C1313–9. Epub 1995/05/01. doi: 10.1152/ajpcell.1995.268.5.C1313 . [DOI] [PubMed] [Google Scholar]
- 19.Shiferaw Y, Watanabe MA, Garfinkel A, Weiss JN, Karma A. Model of intracellular calcium cycling in ventricular myocytes. Biophys J. 2003;85(6):3666–86. doi: 10.1016/S0006-3495(03)74784-5 . [DOI] [PMC free article] [PubMed] [Google Scholar]
- 20.Sato D, Bers DM. How does stochastic ryanodine receptor-mediated Ca leak fail to initiate a Ca spark? Biophysical journal. 2011;101(10):2370–9. Epub 2011/11/22. doi: 10.1016/j.bpj.2011.10.017 ; PubMed Central PMCID: PMCPMC3218344. [DOI] [PMC free article] [PubMed] [Google Scholar]
- 21.Sato D, Despa S, Bers DM. Can the sodium-calcium exchanger initiate or suppress calcium sparks in cardiac myocytes? Biophys J. 2012;102(8):L31–3. doi: 10.1016/j.bpj.2012.03.051 ; PubMed Central PMCID: PMC3328690. [DOI] [PMC free article] [PubMed] [Google Scholar]
- 22.Sato D, Bartos DC, Ginsburg KS, Bers DM. Depolarization of cardiac membrane potential synchronizes calcium sparks and waves in tissue. Biophys J. 2014;107(6):1313–7. doi: 10.1016/j.bpj.2014.07.053 ; PubMed Central PMCID: PMC4167289. [DOI] [PMC free article] [PubMed] [Google Scholar]
- 23.Restrepo JG, Weiss JN, Karma A. Calsequestrin-mediated mechanism for cellular calcium transient alternans. Biophys J. 2008;95(8):3767–89. doi: 10.1529/biophysj.108.130419 ; PubMed Central PMCID: PMC2553104. [DOI] [PMC free article] [PubMed] [Google Scholar]
- 24.Scriven DRL, Asghari P, Schulson MN, Moore EDW. Analysis of Ca(v)1.2 and Ryanodine Receptor Clusters in Rat Ventricular Myocytes. Biophysical Journal. 2010;99(12):3923–9. doi: 10.1016/j.bpj.2010.11.008. PMC3000512. [DOI] [PMC free article] [PubMed] [Google Scholar]
- 25.Inoue M, Bridge JH. Ca2+ sparks in rabbit ventricular myocytes evoked by action potentials: involvement of clusters of L-type Ca2+ channels. Circulation research. 2003;92(5):532–8. Epub 2003/03/01. doi: 10.1161/01.RES.0000064175.70693.EC . [DOI] [PubMed] [Google Scholar]
- 26.Mahajan A, Shiferaw Y, Sato D, Baher A, Olcese R, Xie LH, et al. A rabbit ventricular action potential model replicating cardiac dynamics at rapid heart rates. Biophys J. 2008;94(2):392–410. doi: 10.1529/biophysj.106.98160 . [DOI] [PMC free article] [PubMed] [Google Scholar]
- 27.Navedo MF, Amberg GC, Votaw VS, Santana LF. Constitutively active L-type Ca2+ channels. Proceedings of the National Academy of Sciences of the United States of America. 2005;102(31):11112–7. doi: 10.1073/pnas.0500360102 [DOI] [PMC free article] [PubMed] [Google Scholar]
- 28.Navedo MF, Santana LF. CaV1.2 sparklets in heart and vascular smooth muscle. J Mol Cell Cardiol. 2013;58:67–76. Epub 2012/12/12. doi: 10.1016/j.yjmcc.2012.11.018 ; PubMed Central PMCID: PMCPmc3678956. [DOI] [PMC free article] [PubMed] [Google Scholar]
- 29.Moreno CM, Dixon RE, Tajada S, Yuan C, Opitz-Araya X, Binder MD, et al. Ca2+ entry into neurons is facilitated by cooperative gating of clustered CaV1.3 channels. eLife. 2016;5:e15744 doi: 10.7554/eLife.15744 [DOI] [PMC free article] [PubMed] [Google Scholar]
- 30.Sato D, Bers DM, Shiferaw Y. Formation of spatially discordant alternans due to fluctuations and diffusion of calcium. PLoS One. 2013;8(12):e85365 Epub 2014/01/07. doi: 10.1371/journal.pone.0085365 ; PubMed Central PMCID: PMCPMC3877395. [DOI] [PMC free article] [PubMed] [Google Scholar]
- 31.Sato D, Shiferaw Y, Garfinkel A, Weiss JN, Qu Z, Karma A. Spatially discordant alternans in cardiac tissue: role of calcium cycling. Circulation research. 2006;99(5):520–7. doi: 10.1161/01.RES.0000240542.03986.e7 . [DOI] [PubMed] [Google Scholar]
- 32.Sato D, Shiferaw Y, Qu Z, Garfinkel A, Weiss JN, Karma A. Inferring the cellular origin of voltage and calcium alternans from the spatial scales of phase reversal during discordant alternans. Biophys J. 2007;92(4):L33–5. doi: 10.1529/biophysj.106.100982 ; PubMed Central PMCID: PMC1783870. [DOI] [PMC free article] [PubMed] [Google Scholar]
Associated Data
This section collects any data citations, data availability statements, or supplementary materials included in this article.
Supplementary Materials
The initial conditions are the same in both cases. Alternans was developed within 100 beats in both cases. (A) The membrane potential vs time. (B) cytosolic [Ca2+] vs time. (C) APD vs the beat number. (D) peak cytosolic [Ca2+] vs the beat number. (E) APD alternans amplitude vs the beat number. (C) peak cytosolic [Ca2+] alternans amplitude vs the beat number.
(TIFF)
Ca2+ transient alternans was observed. This demonstrate Ca2+ cycling is unstable and contributes development of alternans.
(TIFF)
GKr was reduced by 50%. (A) positive Cai→Vm coupling (B) negative Cai→Vm coupling.
(TIFF)
Black: w = 0, Red: w = 1.
(TIFF)
Data Availability Statement
All relevant data are within the paper and its Supporting Information files. The mathematical model is available via our website (http://www.ucdmc.ucdavis.edu/pharmacology/).


