

Abstract
An array of four independently wired indium tin oxide (ITO) electrodes was used for electrochemically stimulated DNA release and activation of DNA-based Identity, AND and XOR logic gates. Single-stranded DNA molecules were loaded on the mixed poly(N,N-di-methylaminoethyl methacrylate) (PDMAEMA)/poly-(methacrylic acid) (PMAA) brush covalently attached to the ITO electrodes. The DNA deposition was performed at pH 5.0 when the polymer brush is positively charged due to protonation of tertiary amino groups in PDMAE-MA, thus resulting in electrostatic attraction of the negatively charged DNA. By applying electrolysis at −1.0 V(vs. Ag/AgCl reference) electrochemical oxygen reduction resulted in the consumption of hydrogen ions and local pH increase near the electrode surface. The process resulted in recharging the polymer brush to the negative state due to dissociation of carboxylic groups of PMAA, thus repulsing the negatively charged DNA and releasing it from the electrode surface. The DNA release was performed in various combinations from different electrodes in the array assembly. The released DNA operated as input signals for activation of the Boolean logic gates. The developed system represents a step forward in DNA computing, combining for the first time DNA chemical processes with electronic input signals.
Keywords: DNA release, Modified electrode, Polymer brush, Electrochemical signal, DNA computing, Logic gate
1 Introduction
Research in unconventional computing [1,2] or, in a broader definition, in unconventional information processing is motivated by the fact that the present computer technology based on silicon materials and binary algorithms is coming to the end of its exponential development being limited by further component-miniaturization and speed of system operation. Conceptually novel ideas to breakthrough to another level of information processing technology are needed in order to maintain its fast progress. Biologically inspired novel approaches to unconventional information processing resulted in the rapid progress in molecular [3] and biomolecular [4] computing systems. These systems, still being limited to low scale information processing, are represented by individually operating molecular [5–14] or biomolecular [15–21] Boolean logic gates or their small networks performing basic logic and simple computing operations, e.g., operating as full-adder/full-subtractor systems. Most of the studies in this research area are limited by formulation of chemical or biochemical systems performing the logic/computing operations, giving little attention to the engineering aspects of the system operation. Indeed, when the input signals are represented by chemicals added to the molecular/bio-molecular information systems, their addition is usually performed manually, meaning literally pipetting input-solutions to the computing-composite solution. In some recently developed enzyme-based logic systems their operation, including injection of chemical inputs, was performed in flow systems composed of many interconnected flow cells, where the solutions were driven by a peristaltic pump [22–24]. DNA-based logic gates have been activated by oligonucleotide-inputs released from alginate gel-modified electrodes where the gel dissolution and oligonucleotide release were stimulated by electrochemical signals [25,26]. It should be noted that the majority of bio-molecular logic gates and computing networks is represented by DNA-based systems [18,19,27], thus signal-stimulated application of DNA input-signals is particularly important for developing novel biocomputing systems.
Electrochemically stimulated DNA release has been achieved using various chemically modified electrodes with DNA species incorporated in chemical composites, which can be decomposed by electrochemical reactions, thus resulting in their dissolution and concomitant DNA release [28–32]. Alternative approach uses electrode surfaces being recharged from positive state allowing electrostatic binding of DNA to negative state resulting in DNA repulsion and release. The electrostatic DNA loading-release processes were studied with bare electrodes [33–37], electrodes modified with redox polymers [38,39] and electrodes functionalized with polyelectrolyte brushes [40,41]. Charge formation on the bare electrodes was achieved due to electrochemical polarization of electrode interfaces and its change was used for the electrostatic loading and release of the negatively charged DNA. The electrodes modified with redox polymers were recharged due to reduction-oxidation processes of the redox-polymer, thus coupling the electrostatic load-release of DNA with the redox process of the polymer layer on the electrode surface. Recharging of the polyelectrolyte brushes attached to the electrode surface originated from local pH change produced by electrochemical reaction, particularly in course of electrochemical O2 reduction resulting in consumption of hydrogen ions and local pH increase. The pH values corresponding to the positive and negative charges of the polyelectrolyte are dependent on the pKa values of the polymers used in the composite polymer brush. It should be noted that for changing the electrode charge from positive to negative states, corresponding to the DNA loading and release, respectively, the polymer brush should be composed of two kinds of polyelectrolyte, one being positively charged upon its protonation and another being negatively charged upon deprotonation. In our recent work we have demonstrated that using various polyelectrolytes the pH values used for the DNA load and release can be changed and optimized for specific applications [40,41]. A mixed polymer brush composed of poly(N,N-dimethylaminoethyl methacrylate) (PDMAEMA)/poly(methacrylic acid) (PMAA) covalently attached to ITO electrodes was loaded with DNA at pH 5.0 and the DNA release was achieved by the local pH increase at the electrode surface due to electrochemical reduction of O2 [41]. The present paper extends this system to a 4-electrode array. The DNA released from the electrodes in different combinations was used for activating Identity, AND and XOR molecular logic gates made of DNA. The novelty and importance of the present study is mostly the integration of the DNA input delivering system with logically processed DNA inputs.
2 Experimental
2.1 Chemicals and Materials
Poly(N,N-dimethylaminoethyl methacrylate) (PDMAE-MA; Mn = 82,700 gmol−1; Sample #: P6167-DMAEMA) and amino terminated poly(t-butyl methacrylate) (APBMA; Mn = 26,000 gmol−1; Sample #: P3544-tBu-MANH2) were purchased from Polymer Source, Inc., Dorval, Canada. (3-Bromopropyl)trimethoxysilane (BPS; Aldrich 18265) and other standard organic and inorganic materials and reactants were purchased from Sigma-Al-drich. Indium tin oxide (ITO) single-side coated conducting glass (15÷25 Ω/sq surface resistivity) was purchased from Sigma-Aldrich. 4-Electrode ITO array was custom produced (see experimental details below and Figure SI–1 in the Supporting Information). Diamond™ Nucleic Acid Dye was purchased from Promega Corp., WI, USA. All commercial chemicals were used as supplied without further purification (except the DNA samples which were specially purified, see below). Ultrapure water (18.2 MΩcm) from a NANOpure Diamond (Barnstead) source was used in all of the experiments. The structures of the used silane (BPS) and two polymers (PDMAEMA and APBMA) are shown in Figure 1.
Fig. 1.

Modification of the ITO electrode with the mixed polymer brush. Note that the same procedure was used for modification of a single-ITO-coated glass slide electrode used for the AFM characterization as well as for modification of individual ITO electrodes in the electrode array used for the electrochemical study and DNA load/release. The following abbreviations are used in the scheme: BPS=(3-Bromopropyl)trimethoxysilane; APBMA=amino terminated poly(t-butyl methacrylate); PDMAEMA=poly(N,N-dimethylaminoethyl methacrylate); PMAA=poly(methacrylic acid).
2.2 Oligonucleotides Used in the Study
All custom-made oligonucleotides were purchased from Integrated DNA Technologies (Coralville, IA, USA) and purified according to the procedures specified in the tables below. Single-stranded oligonucleotide with a fluorescent label, FAM-DNA, (6-FAM-5′-TGC AGA CGT TGA AGG ATC CTC-3′), was used in the primary experiments, particularly mimicking the DNA Identity logic gate (FAM attached to the DNA is a fluorescein derivative; https://www.idtdna.com/site/Catalog/Modifications/Product/1108).
The following abbreviations are used in the tables: BHQ (“Black Hole Quencher3)” is a trademark registered in USA for a fluorescence quencher; FAM attached to the DNA is a fluorescein derivative; Qz6 is a Quasar 670 fluorescent dye. SD is standard desalting and HPLC is high performance liquid chromatography used for purification of the DNA samples. The concentrations of the DNA inputs released from the modified electrodes were measured using Diamond™ Nucleic Acid Dye according to the procedure specified in the Supporting Information, see also Figure SI–2.
2.3 Electrode Modification
Indium tin oxide (ITO) single-side coated conducting glass slides were cut into slices of 0.8 cm02.5 cm and used for the AFM characterization of the modified surface (note that ITO electrode array composed of 4 ITO electrodes was used in the electrochemical experiments and for DNA release; see the details below). Firstly, the electrodes were cleaned with ethanol in an ultrasonic bath for 30 minutes and dried under argon. Next, the electrodes were cleaned using a H2O :NH4OH :H2O2 solution (1 :1 :1) at 40°C for 1 hour and rinsed with water several times. (The cleaning solution is extremely energetic and may result in explosion or skin burns if not handled with extreme caution.) Afterward, the electrodes were surface-functionalized overnight at room temperature with 1% (v/v) (3-bromopropyl)trimethoxysilane solution in ethanol. The silanized surface was rinsed with ethanol and characterized by ellipsometry showing ca. 0.7 nm uniform layer. Amino-terminated poly (t-butyl methacrylate) (APBMA) (note two amino groups at the ends of the polymeric chains) was dissolved (5% w/v) in chloroform. The silanized ITO electrodes were immersed in the APBMA solution and then slowly pulled out to produce ca. 200 nm polymer film on the surface. The film was dried and incubated in Ar atmosphere overnight in an oven at 70°C. Then the electrodes were carefully rinsed with chloroform and ethanol and characterized with ellipsometry. The grafted polymer brush layer of 3.6 nm was found on the surface. Then the second polymer, poly(N,N-dimethylaminoethyl methacrylate) (PDMAE-MA) was deposited on the electrode surface from 2% (w/v) THF solution by spin-coating to achieve ca. 40 nm polymer layer. The electrode was incubated in an oven at 110°C for 4 hours. The electrode surface was rinsed with acidic water (pH 2; acidified with HCl), THF and ethanol to remove the ungrafted polymer. The grafted APBMA was hydrolyzed to poly(methacrylic acid) (PMAA) by treatment with dry 2% (v/v) solution of methanesulfonic acid in CH2Cl2 for 10 minutes (note that this reaction step aimed at removing protecting groups and converting ester groups to carboxylic groups). Ellipsometry measurements showed 9.8 nm total mixed brush layer thickness, which is in the agreement with AFM measurements and corresponds to the value expected for the “grafting to” method.
The array of ITO electrodes was prepared by means of a magnetron sputtering from an In2O3 :SnO2 target (95 :5 w/w) on 1.1 mm thick Corning Eagle XG glass substrate. The thickness and sheet resistance of the prepared ITO films were about 100 nm and 40 Ohm, respectively. After deposition of contact pads (300 nm Ag or 20 nm Cr/200 nm Au), the glass substrate was separated into chips (15 mm015 mm) combining four ITO electrodes with a diameter of 2 mm. The chip was glued onto printed circuit board and four ITO conducting electrodes were independently wired to the external circuitry (see Figure SI–1 in the Supporting Information). The ITO electrodes in the array were modified with the mixed polymer brush according to the same procedure as described above for a single ITO electrode. The electrode array was used in all electrochemical experiments and controlled DNA release.
2.4 AFM Characterization of the Mixed Polymer Brush
AFM experiments were conducted as described elsewhere [42,43]. Briefly, polymer-modified ITO-coated glass slides were mounted in the AFM instrument (MultiMode 8 scanning probe microscope, Bruker) and the polymer layer was scratched using a sharpened pipette tip to leave an ITO layer intact. Then, polymer-brush height was measured in air by scanning the scratched trench in the tapping mode using a NPS-10 silicon nitride probe (Bruker Instruments).
Other experimental details, including electrochemical and fluorescence measurements, etc. are specified in the Supporting Information.
3 Results and Discussion
3.1 Modification of the ITO Electrode with the Mixed-polymer Brush
The ITO electrode surface was silanized to yield bromo-alkane functional groups and then let to react with amino-terminated poly(t-butyl methacrylate) (APBMA) followed by reaction with poly(N,N-dimethylaminoethyl methacrylate) (PDMAEMA), Figure 1. The alkylation reaction resulted in the covalent binding of the polymers, producing a grafted PDMAEMA-APBMA mixed polymer brush. The APBMA methacrylate-based polymer was used in the form of t-butyl ester protecting carboxylic groups to avoid complexation with PDMAEMA in the grafting stage. After formation of the grafted mixed-polymer brush, the ester groups were hydrolyzed and removed, thus deprotecting the carboxylic groups and yielding PDMAEMA/PMAA-polymer brush used in all experiments.
This modification procedure (see technical details above) was specifically designed and optimized for improving the structure of the polymer brush, allowing its characterization by AFM. Note that in our previous work [41] another modification procedure was used resulting in much less defined structure of the mixed-polymer brush.
3.2 Dependence of the Polymer-brush Charge on the pH Value of the Electrolyte Solution – Charge-Controlled Electrochemical Reactions and DNA Load/Release
The charge formation on the polymer brush-modified electrode and its variation with the pH value were studied in details in our previous work [41] and explained briefly below. The composite polymer brush consisting of two different polyelectrolytes demonstrates different charges depending on the protonation-deprotonation equilibrium controlled by the solution pH value. When the polymer brush is exposed to an acidic solution below pH 6 the tertiary amino groups in PDMAEMA are protonated and positively charged, while the carboxylic groups in PMAA are not dissociated and therefore neutral. Under this condition, the PDMAEMA chains are swollen and exposed to the solution, while the PMAA chains are in a less swollen conformation reside at the modified surface, Figure 2, left panel. The overall charge of the composite polymer film on the electrode surface is positive. On the other hand, when the modified electrode is exposed to the solution with pH above 9, the PDMAEMA chains are not protonated (neutral) and they are in a more compact conformation on the electrode surface. At the same time, the carboxylic groups in the PMAA chains are dissociated and negatively charged. Under this condition the PMAA chains are swollen and exposed to the solution, Figure 2, right panel. Then the overall charge of the composite polymer film on the electrode surface is negative. The pH-controlled transition from the positively charged interface to the negative state can be probed electro-chemically using charged redox species. Indeed, when negatively charged redox species, [Fe(CN)6]3−/4−, were used in Faradaic impedance measurements at the modified electrode, the electron transfer resistance, Ret, was dramatically increased at pH 9.0 comparing to the Ret measured at pH 5.0, Figure 2. This result can be explained by electrostatic effect facilitating the electrochemical process of the negatively charged redox probe at the positively charged electrode surface (pH 5.0) and inhibiting this process at the negatively charged interface (pH 9.0) (Frumkin effect [44]). The transition from the positively charged composite polymer brush to its negatively charged state was studied in more details [41] using differential pulse voltammetry to follow the facilitation-inhibition effects on electrochemistry of differently charged redox species, [Fe(CN)6]4− and [Ru(NH3)6]3+. In the experiments described above the pH change was produced by changing the background solution, meaning that the bulk solution pH was varied.
Fig. 2.

Impedance spectra measured on the mixed-polymer-brush modified ITO electrode (one of the electrodes in the array) in the presence of 1 mM [Fe(CN)6]3−/4− redox probe. The experiments were performed at pH 5.0 and 9.0 (curves a and b, respectively), when the mixed-polymer brush is positively and negatively charged, respectively. The bias potential is +0.25 V vs. Ag/AgCl reference.
In another set of experiments the pH change resulting in the re-charging of the composite polymer brush from the positive to negative state was achieved by electrochemical reduction of O2 by applying −1.0 V(vs. Ag/AgCl) and yielding H2O and H2O2 as the products [41]:
The electrochemical process resulted in the consumption of hydrogen ions and produced local pH increase at the modified electrode interface. The local pH change was analyzed by following redox potential of thionine (note that the redox potential of thionine is pH-dependent) and the pH value achieved locally at the electrode surface was found to be ca. 9.9. Note that the bulk pH was not changed in the course of the electrolysis due to the buffer properties of the background solution [41]. Negatively charged DNA molecules were electrostatically bound to the positively charged polymer brush at pH 5.0 and then released from the electrode surface when the local pH was increased to pH ca. 9.9 upon electrochemical reduction of O2 [41], Figure 3.
Fig. 3.

Schematic representation of the electrostatic loading of DNA on the negatively charged polymer brush at pH 5.0 (A), electro-chemically generated pH increase in course of O2 reduction (B), and electrostatic repulsion and release of DNA from the negatively charged electrode at pH ca. 9.9 locally produced at the electrode surface (C).
3.3 AFM Characterization of the Modified Electrodes and Fluorescent Analysis of the DNA Load/Release Process
The AFM study of the mixed PDMAEMA/PMAA-polymer brush revealed 7±1 nm thickness prior to the DNA deposition, when measured dry under air, Figure 4AB. The AFM analysis of the polymer film thickness demonstrated its increase by ca. 10 nm upon DNA deposition on the polymer mixed brush (FAM-DNA was used in this experiment), Figure 4CD. The thickness of the polymer film was returned back to the original value (ca. 7–8 nm) after the adsorbed and electrostatically retained DNA was removed from the surface by rinsing with a solution with pH 9.9 mimicking the pH change upon electrochemical reduction of O2, Figure 4EF. As it was explained above, this basic pH value results in re-charging of the polymer brush, thus resulting in electrostatic repulsion and release of the DNA load. The AFM experiments were conducted on the ITO single-side coated conducting glass (note that this electrode was modified with the composite polymer brush in the same way as the ITO-electrode array).
Fig. 4.

AFM characterization of the mixed polymer brush thickness: (A) before deposition of FAM-DNA, (C) after deposition of FAM-DNA, 200 pmol, and (E) after removing FAM-DNA from the electrode surface upon its washing with a lactate solution, 1 mM, with pH 9.9. Plots B, D and F show the corresponding scratch profiles. Note that the AFM measurements were performed on the ITO-coated glass slide in air by scanning in tapping mode.
Since DNA used in this set of experiments was labeled with a fluorescent dye (FAM-DNA), the DNA deposition on the modified ITO electrode and then its release upon changing the pH value was followed by measuring fluorescence directly from the electrode surface as well as in the solution. These experiments were performed on the 4-ITO electrode array (note that all experiments described below were conducted on this array). The FAM-DNA loaded on the modified electrode at pH 5.0 produced green fluorescence observed directly from the electrode surface (see Figure SI–3A in the Supporting Information). Application of −1.0 V resulting in the local pH ca. 9.9 decreased dramatically the green fluorescence observed from the electrode surface, being consistent with the FAM-DNA release (Figure SI–3B). The fluorescence measured directly from the electrode surface before and after the DNA release allows quantitative analysis of the decrease in the DNA content on the electrode surface, which corresponds to ca. 90% FAM-DNA release comparing with the original load. On the other hand, the fluorescence measured in the solution was increased when FAM-DNA was released from the electrode surface, Figure 5. It should be noted that the leakage of FAM-DNA from the electrode surface prior to the potential application (bulk solution pH 5.0) was negligible. The FAM-DNA release shown in Figure 5 was observed from one ITO electrode in the array. When all 4 electrodes in the array were tested, each one separately, the amount of the released FAM-DNA was found to be very similar, thus indicating the reproducible loading and release processes (Figure SI–4A in the Supporting Information). Applying −1.0 V potential simultaneously to 1, 2, 3 and 4 electrodes in the array resulted in the linear increase of the amount of the released FAM-DNA (Figure SI–4B). High reproducibility of the DNA release from the individual electrodes in the electrode array allowed their use in the controlled DNA release for activating DNA logic gates. The present result with the electrochemically stimulated FAM-DNA release and its fluorescence analysis in the solution can be considered as a realization of the trivial Identity logic gate when the electrochemical input signal is directly copied to the fluorescence output signal, Figure 5.
Fig. 5.
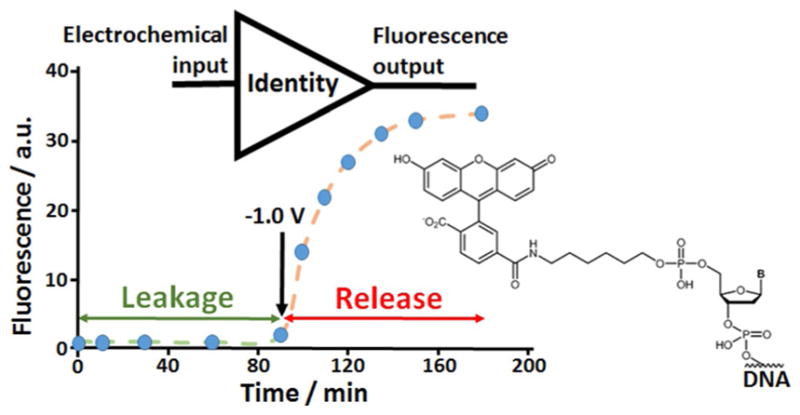
Time-dependent fluorescence measured at λ =520 nm in 1 mM lactic solution containing 100 mM Na2SO4, pH 5.0, upon leakage and electrochemically stimulated FAM-DNA release. The FAM-DNA load and release were performed on one of the ITO electrodes in the array. The structure of the FAM fluorescent label attached to the DNA molecule is shown at the right. The process can be considered as a model of the DNA-based Identity gate where the input signal (potential applied on the electrode) is directly copied to the output signal (fluorescence measured in the solution).
3.4 Realization of DNA-based Logic Gates Activated by DNA Signals Released from the Modified Electrode Array
While different approaches to DNA logic gates and circuitries have been realized in the last two decades [18,19,27,45,46], we selected the most advanced version of DNA switchable systems based on deoxyribozymes (DZ), also called DNAzymes [47]. Deoxyribozyme logic gates controlled by DNA oligonucleotide inputs are most well-developed DNA logic constructs up to date [48–56]. Indeed, such gates can be assembled in automaton that plays tic-tac-toe game with human [49], they can be organized in multi-layer computational cascades [51–54] and a molecular calculator with 7-segment digital display [55]. The advantage of DNAzymes, when they are used in the construction of logic gates, is their high sensitivity to oligonucleotide inputs applied at nanomolar concentrations, which is hard to achieve by most of other DNA-signal responsive systems [25,26]. This property was particularly important for realization of our experimental systems since the concentration of DNA-signals activating the DNAzymes was limited by the amount of DNA released from the polymer brush-modified electrodes (ca. 10 nM). The high sensitivity of our DNAzyme logic gates is attributed to the ability of the DNAzymes constructs to amplify input signals catalytically using the most catalytically efficient DNAzymes known, DZ 10–23 [57,58]. In the present study we realized AND and XOR logic systems as the most typical examples of Boolean logic gates used in biomolecular computing [4]. Four DNA inputs (Input A, Input B for activation of AND gate and Input C, Input D for activation of XOR gate) were loaded on four ITO electrodes in the array and released by electrochemical signals (application of −1.0 V potential) applied to the corresponding electrodes. The solution where the inputs were released included all other components (“machinery”) for the operation of both logic gates (see the “machinery” solution composition in the Supporting Information).
3.4.1 Realization of the AND Logic Gate Activated by DNA Signals Released from the Modified Electrode Array
The design of the AND gate takes advantage of the original concept of split (binary) deoxyribozyme sensors [59–62]. The whole composition of the DNA system includes 6 oligonucleotides, which can be assembled in the catalytic DNAzyme only when all oligonucleotide components are available [26], Figure 6. Thus, the DNAzyme can be produced only when both DNA Input A and Input B are added to the solution which contains all other DNA species (“machinery”). DNA Input A and Input B were loaded on two brush-modified ITO electrodes in the array and then released by applying electrical signals to the electrodes. The DNA inputs were released in different combinations: 0,0; 0,1; 1,0 and 1,1, Figure 6. When all required DNA strands were present in the solution (this happened only in the case of 1,1 input combination) the DNAzyme catalytic core was assembled and then the DNA, FAM-BHQ, functionalized with a dye and quencher (FAM and BHQ, respectively) was catalytically cut in two pieces, thus separating the dye and quencher. This resulted in the increased fluorescence of FAM, which was not any more quenched by BHQ. The fluorescence much above the background level was observed only for 1,1 input combination as expected for the AND gate (see the truth table in Figure 7A and corresponding fluorescence spectra in Figure 7B). The bar chart, Figure 7C, shows the fluorescence observed in the system after applying signals to the DNA-loaded electrodes and releasing DNA signals (Input A and Input B) in various combinations. The high fluorescence signal was defined as output 1, when it was above the threshold, otherwise the output signal was considered as logic 0 value, Figure 7C. The low intensity fluorescence corresponding to the logic output 0 originated from the incomplete quenching of the dye.
Fig. 6.

The operation of the DNA-based AND logic gate activated by Input A and Input B signals released from two electrodes in the array upon application of −1.0 V to the electrodes in different combinations. The output signal was measured in the solution as the fluorescence of the FAM dye. The exact solution composition and other experimental details are given in the Supporting Information.
Fig. 7.

(A) Truth table of the Boolean AND gate. (B) Fluorescence spectra measured in the solution upon application of −1.0 V to two DNA-loaded electrodes and Input A and Input B release in different combinations. (C) The bar chart demonstrating the output signal for different combinations of the input signals.
3.4.2 Realization of the XOR Logic Gate Activated by DNA Signals Released from the Modified Electrode Array
The XOR logic function has been already realized with many different DNA-based systems [63–69], however there is only one report demonstrating activation of XOR gates with electrochemically released DNA signals [25]. This recently published paper demonstrated DNA release and XOR gate activation through electrochemical sensing-releasing process, while the releasing electrode was able to deliver only one kind of DNA species representing one input signal. The present study is one step forward with the use of a multi-electrode array for the logic gate activation.
Input C and Input D loaded on the brush-modified electrodes in the array were released when the electrochemical signals, −1.0 V, were applied to the electrodes in different combinations, Figure 8. The solution included the DNA “machinery” (a non-variable part of the logic gate), DNA species: A1, B1, A2, B2 and Q–F (the last DNA was functionalized with a fluorescent dye and a quencher, Qz6 and BHQ, respectively). The released DNA signals were combined with the DNA molecules existing in the solution: Input C was combined with the DNA species A1 and B1, while leaving non-reacted DNA species A2 and B2. On the other hand, Input D was combined with the DNA species A2 and B2, while leaving non-reacted DNA species A1 and B1. In both cases the hybridization of the DNA signal with the DNA molecules in the solution resulted in the formation of a catalytic DZ core capable to cut the Q–F molecule. This process resulted in separation of the dye and quencher, thus increasing the fluorescence of the dye. The fluorescence increase was considered as the logic output 1, which was obtained in the 0,1 and 1,0 combinations of the DNA input signals, Figure 8. However, simultaneous release of Input C and Input D (1,1 combination) from the electrode resulted in their hybridization with the DNA “machinery” in a different way. Both DNA input signals hybridized with the DNA “machinery” produce no catalytic DZ core, Figure 8. In this configuration DNA species A1 and B1 were hybridized with both inputs, thus blocking the site needed for the formation of the catalytic DNAzyme. The same happened with A2 and B2 which were also reacting with both inputs resulting in blocking the catalytic site. Therefore, the Q–F molecule was not cut in two pieces and the fluorescence was not increased, producing logic output 0, Figure 8. Obviously, with no addition of the DNA signals (0,0 combination) the catalytic DNAzyme was not formed and the Q–F was not cut, thus producing output 0.
Fig. 8.

The operation of the DNA-based XOR logic gate activated by Input C and Input D signals released from two electrodes in the array upon application of −1.0 V to the electrodes in different combinations. The output signal was measured in the solution as the fluorescence of the Qz6 dye (shown in the scheme as F). The exact solution composition and other experimental details are given in the Supporting Information.
The response-function of the assembled DNA system corresponded to the XOR logic truth table, Figure 9A. The experimental results in the form of the fluorescence spectra and corresponding bar chart measured for different combinations of the DNA inputs (0,0; 0,1; 1,0; 1,1) are shown in Figure 9B–C. The experimentally observed difference between logic 0 (low fluorescence) and logic 1 (high fluorescence) was not large, but statistically enough to distinguish 0 and 1 outputs. Further optimization of the DNA system is needed for improving the output difference.
Fig. 9.

(A) Truth table of the Boolean XOR gate. (B) Fluorescence spectra measured in the solution upon application of −1.0 V to two DNA-loaded electrodes and Input C and Input D release in different combinations. (C) The bar chart demonstrating the output signal for different combinations of the input signals.
4 Conclusions
The present study demonstrated the activation of various DNA-based logic gates with the DNA signals released in different combinations from the electrode array by applying potentials to the individual electrodes loaded with the DNA species. Together with our recent results on the DNA-based circuitries composed of multiple DNA gates mimicking reversible logic processes [25,26], the present results promise sophisticated biocomputing systems integrated with electronics. Further miniaturization of the DNA-releasing electrode arrays will result in microelectronic (potentially nanoelectronic) devices activating bio-computing circuitries performing parallel computing operations, finally realizing the original goal of DNA computing systems. The readout of the computing results could be also performed in the electronic format, thus assembling the computation process in the form of an integrated electronic-biomolecular-electronic process, doing one step forward in the direction of biomolecular computing devices [16]. It should be noted that the research directed to the design of biomolecular computers is presently limited by formulation of biomolecular (mostly DNA-based) systems performing logic/computational functions [15,16], why the engineering aspects of assembling these systems in the form of devices is not advanced enough. The present paper introduces the first steps to advancing the bio-computing devices, thus making one step forward to the realization of biocomputors.
Supplementary Material
Table 1.
Oligonucleotides used to realize the AND gate:
| Name | Sequence | Conc., nM | Purification |
|---|---|---|---|
| Input A | 5′-CCA GGG A GG CTA GCT AAC GTC TGCA CAC AAA TTC GGT TCT ACA GGG TA CGTTAGC | 10 | SD |
| Input B | 5′-GTGAAGG CAA ACA CCA TTG TCA CAC TCC A GAG GAT CCT TC A CAA CGA GAG GAA AC | 10 | SD |
| I1 | 5′-TGG AGT GTG ACA ATG GTG TTT G | 10 | SD |
| I2 | 5′-TAC CCT GTA GAA CCG AAT TTG TG | 10 | SD |
| OP1 | 5′-TGC AGA C GT T GA AG G ATC CTC | 5 | SD |
| FAM-BHQ | 5′-AAG GT(dT-FAM) TCC TCg uCC CTG GGC A(BHQ)-3′ | 200 | HPLC |
Table 2.
Oligonucleotides used to realize the XOR gate:
| Name | Sequence | Conc., nM | Purification |
|---|---|---|---|
| Input C | 5′-TAG AGT AAC CTC ACA CGG AAT GTT TC | 5 | HPLC |
| Input D | 5′-GCT TAC AACC AAT GAA GGA TCC TC | 5 | SD |
| A1 | 5′-GAA ACA TTC CGT ACA ACG AGG TTG TGC | 2 | HPLC |
| B1 | 5′-GAG GAT CCT TCG TTG GTG AGG CTA GCT GTG AGG TTA CTC TA | 2 | HPLC |
| A2 | 5′-GAG GAT CCT TCA CAA CGA GGT TGT GC | 2 | HPLC |
| B2 | 5′-GAA ACA TTC CGT GTT GGT GAG GCT AGC TAT TGG TTG TAA GC | 2 | HPLC |
| Q-F | Qz6-CAG CAC AAC Cgu CAC CAA CCG-BHQ | 100 | HPLC |
Acknowledgments
This work at Clarkson University and at the University of Georgia was supported by the NSF awards # CBET-1403208 and DMR-1309469. DMK is grateful to NSF CCF (1117205, 1423219) and NIH (R15AI10388001A1) for financial support. The authors thank A. Doumit and J. H4pkes (Research Centre Jülich, IEK5) for providing ITO-electrode arrays.
Footnotes
Supporting information for this article is available on the WWW under http://dx.doi.org/10.1002/elan.201600389.
References
- 1.Calude CS, Costa JF, Dershowitz N, Freire E, Rozenberg G. Unconventional Computation. Lecture Notes in Computer Science. Vol. 5715 Springer; Berlin: 2009. [Google Scholar]
- 2.Adamatzky A, De Lacy Costello B, Bull L, Stepney S, Teuscher C. Unconventional Computing 2007. Luniver Press; UK: 2007. [Google Scholar]
- 3.Katz E. Molecular and Supramolecular Information Processing – From Molecular Switches to Unconventional Computing. Wiley-VCH; Weinheim: 2012. [Google Scholar]
- 4.Katz E, editor. Biomolecular Computing – From Logic Systems to Smart Sensors and Actuators. Wiley-VCH; Weinheim: 2012. [Google Scholar]
- 5.Szacilowski K. Infochemistry – Information Processing at the Nanoscale. Wiley; Chichester: 2012. [Google Scholar]
- 6.de Silva AP. Molecular Logic-Based Computation. Royal Society of Chemistry; Cambridge: 2013. [Google Scholar]
- 7.de Silva AP. Nature. 2008;454:417–418. doi: 10.1038/454417a. [DOI] [PubMed] [Google Scholar]
- 8.de Silva AP. Nat Nanotechnol. 2007;2:399–410. doi: 10.1038/nnano.2007.188. [DOI] [PubMed] [Google Scholar]
- 9.de Silva AP, Uchiyama S, Vance TP, Wannalerse B. Coord Chem Rev. 2007;251:1623–1632. [Google Scholar]
- 10.Credi A. Angew Chem Int Ed. 2007;46:5472–5475. doi: 10.1002/anie.200700879. [DOI] [PubMed] [Google Scholar]
- 11.Pischel U, Andreasson J, Gust D, Pais VF. ChemPhys-Chem. 2013;14:28–46. doi: 10.1002/cphc.201200157. [DOI] [PubMed] [Google Scholar]
- 12.Pischel U. Angew Chem Int Ed. 2010;49:1356–1358. doi: 10.1002/anie.200906705. [DOI] [PubMed] [Google Scholar]
- 13.Szacilowski K. Chem Rev. 2008;108:3481–3548. doi: 10.1021/cr068403q. [DOI] [PubMed] [Google Scholar]
- 14.Andreasson J, Pischel U. Chem Soc Rev. 2015;44:1053–1069. doi: 10.1039/c4cs00342j. [DOI] [PubMed] [Google Scholar]
- 15.Benenson Y. Mol BioSyst. 2009;5:675–685. doi: 10.1039/b902484k. [DOI] [PMC free article] [PubMed] [Google Scholar]
- 16.Benenson Y. Nature Rev Genet. 2012;13:455–468. doi: 10.1038/nrg3197. [DOI] [PubMed] [Google Scholar]
- 17.Qian L, Winfree E. J Royal Soc Interface. 2011;8:1281–1297. doi: 10.1098/rsif.2010.0729. [DOI] [PMC free article] [PubMed] [Google Scholar]
- 18.Stojanovic MN, Stefanovic D, Rudchenko S. Acc Chem Res. 2014;47:1845–1852. doi: 10.1021/ar5000538. [DOI] [PMC free article] [PubMed] [Google Scholar]
- 19.Stojanovic MN, Stefanovic D. J Comput Theor Nanosci. 2011;8:434–440. [Google Scholar]
- 20.Katz E, Privman V. Chem Soc Rev. 2010;39:1835–1857. doi: 10.1039/b806038j. [DOI] [PubMed] [Google Scholar]
- 21.Katz E. Curr Opin Biotechnol. 2015;34:202–208. doi: 10.1016/j.copbio.2015.02.011. [DOI] [PubMed] [Google Scholar]
- 22.Fratto BE, Lewer JM, Katz E. ChemPhysChem. 2016 doi: 10.1002/cphc.201600173. in press. [DOI] [PubMed] [Google Scholar]
- 23.Fratto BE, Katz E. ChemPhysChem. 2016;17:1046–1053. doi: 10.1002/cphc.201501095. [DOI] [PubMed] [Google Scholar]
- 24.Fratto BE, Katz E. ChemPhysChem. 2015;16:1405–1415. doi: 10.1002/cphc.201500042. [DOI] [PubMed] [Google Scholar]
- 25.Guz N, Fedotova TA, Fratto BE, Schlesinger O, Alfonta L, Kolpashchikov D, Katz E. ChemPhysChem. 2016 doi: 10.1002/cphc.201600129. in press. [DOI] [PubMed] [Google Scholar]
- 26.Mailloux S, Gerasimova YV, Guz N, Kolpashchikov DM, Katz E. Angew Chem Int Ed. 2015;54:6562–6566. doi: 10.1002/anie.201411148. [DOI] [PMC free article] [PubMed] [Google Scholar]
- 27.Ezziane Z. Nanotechnology. 2006;17:R27–R39. [Google Scholar]
- 28.Aytar BS, Prausnitz MR, Lynn DM. ACS Appl Mater Interfaces. 2012;4:2726–2734. doi: 10.1021/am3003632. [DOI] [PMC free article] [PubMed] [Google Scholar]
- 29.Wang F, Li D, Li G, Liu X, Dong S. Biomacromolecules. 2008;9:2645–2652. doi: 10.1021/bm800766t. [DOI] [PubMed] [Google Scholar]
- 30.Wang F, Wang J, Zhai Y, Li G, Li D, Dong S. J Contr Release. 2008;132:65–73. doi: 10.1016/j.jconrel.2008.08.016. [DOI] [PubMed] [Google Scholar]
- 31.Wang F, Liu X, Li G, Li D, Dong S. J Mater Chem. 2009;19:286–291. [Google Scholar]
- 32.Moore EJ, Curtin M, Ionita J, Maguire AR, Ceccone G, Galvin P. Anal Chem. 2007;79:2050–2057. doi: 10.1021/ac0618324. [DOI] [PubMed] [Google Scholar]
- 33.Wang J, Jiang M, Mukherjee B. Bioelectrochemistry. 2000;52:111–114. doi: 10.1016/s0302-4598(00)00081-7. [DOI] [PubMed] [Google Scholar]
- 34.Wang J, Rivas G, Jiang M, Zhang X. Langmuir. 1999;15:6541–6545. [Google Scholar]
- 35.Wang J, Zhang X, Parrado C, Rivas G. Electrochem Commun. 1999;1:197–202. [Google Scholar]
- 36.Jiang M, Ray WW, Mukherjee B, Wang J. Electrochem Commun. 2004;6:576–582. [Google Scholar]
- 37.Takeishi S, Rant U, Fujiwara T, Buchholz K, Usuki T, Arinaga K, Takemoto K, Yamaguchi Y, Tornow M, Fujita S, Abstreiter G, Yokoyama N. J Chem Phys. 2004;120:5501–5504. doi: 10.1063/1.1643729. [DOI] [PubMed] [Google Scholar]
- 38.Minehan DS, Marx KA, Tripathy SK. Macromolecules. 1994;27:777–783. [Google Scholar]
- 39.Pande R, Ruben GC, Ok Lim J, Tripathy S, Marx KA. Biomaterials. 1998;19:1657–1667. doi: 10.1016/s0142-9612(98)00043-x. [DOI] [PubMed] [Google Scholar]
- 40.Renata Sempionatto J, Gamella M, Guz N, Pingarrón JM, Pedrosa VA, Minko S, Katz E. Electroanalysis. 2015;27:2171–2179. [Google Scholar]
- 41.Masi M, Gamella M, Guz N, Katz E. Electroanalysis. 2016 doi: 10.1002/elan.201600275. in press. [DOI] [PMC free article] [PubMed] [Google Scholar]
- 42.Roiter Y, Minko S. J Phys Chem B. 2007;111:8597–8604. doi: 10.1021/jp070518q. [DOI] [PubMed] [Google Scholar]
- 43.Trotsenko O, Roiter Y, Minko S. Langmuir. 2012;28:6037–6044. doi: 10.1021/la300584k. [DOI] [PubMed] [Google Scholar]
- 44.Frumkin AN, Petrii OA, Damaskin BB. In: Comprehensive Treatise of Electrochemistry. Bockris JO’M, Conway BE, Yeager E, editors. Springer; 1980. pp. 221–289. [Google Scholar]
- 45.Adleman LM. Science. 1994;266:1021–1024. doi: 10.1126/science.7973651. [DOI] [PubMed] [Google Scholar]
- 46.Gerasimova YV, Kolpashchikov DM. Chem Asian J. 2012;7:534–540. doi: 10.1002/asia.201100664. [DOI] [PubMed] [Google Scholar]
- 47.Hollenstein M. Molecules. 2015;20:20777–20804. doi: 10.3390/molecules201119730. [DOI] [PMC free article] [PubMed] [Google Scholar]
- 48.Stojanovic MN, Mitchell TE, Stefanovic D. J Am Chem Soc. 2002;124:3555–3561. doi: 10.1021/ja016756v. [DOI] [PubMed] [Google Scholar]
- 49.Stojanovic MN, Stefanovic D. Nature Biotechnol. 2003;21:1069–1074. doi: 10.1038/nbt862. [DOI] [PubMed] [Google Scholar]
- 50.Macdonald J, Li Y, Sutovic M, Lederman H, Pendri K, Lu W, Andrews BL, Stefanovic D, Stojanovic MN. Nano Lett. 2006;6:2598–2603. doi: 10.1021/nl0620684. [DOI] [PubMed] [Google Scholar]
- 51.Stojanovic MN, Semova S, Kolpashchikov D, Macdonald J, Morgan C, Stefanovic D. J Am Chem Soc. 2005;127:6914–6915. doi: 10.1021/ja043003a. [DOI] [PubMed] [Google Scholar]
- 52.Yashin R, Rudchenko S, Stojanovic MN. J Am Chem Soc. 2007;129:15581–15584. doi: 10.1021/ja074335t. [DOI] [PubMed] [Google Scholar]
- 53.Brown CW, III, Lakin MR, Horwitz EK, Fanning ML, West HE, Stefanovic D, Graves SW. Angew Chem Int Ed Engl. 2014;53:7183–7187. doi: 10.1002/anie.201402691. [DOI] [PMC free article] [PubMed] [Google Scholar]
- 54.Brown CW, III, Lakin MR, Stefanovic D, Graves SW. ChemBioChem. 2014;15:950–954. doi: 10.1002/cbic.201400047. [DOI] [PubMed] [Google Scholar]
- 55.Poje JE, Kastratovic T, Macdonald AR, Guillermo AC, Troetti SE, Jabado OJ, Fanning ML, Stefanovic D, Macdonald J. Angew Chem Int Ed Engl. 2014;53:9222–9225. doi: 10.1002/anie.201402698. [DOI] [PubMed] [Google Scholar]
- 56.Gerasimova YV, Kolpashchikov DM. Chem, Commun. 2015;51:870–872. doi: 10.1039/c4cc08241a. [DOI] [PMC free article] [PubMed] [Google Scholar]
- 57.Fokina AA, Stetsenko DA, Francois JC. Expert Opin Biol Therapy. 2015;15:689–711. doi: 10.1517/14712598.2015.1025048. [DOI] [PubMed] [Google Scholar]
- 58.Santoro SW, Joyce GF. Biochemistry. 1998;37:13330–13342. doi: 10.1021/bi9812221. [DOI] [PubMed] [Google Scholar]
- 59.Kolpashchikov DM. ChemBioChem. 2007;8:2039–2042. doi: 10.1002/cbic.200700384. [DOI] [PMC free article] [PubMed] [Google Scholar]
- 60.Gerasimova YV, Cornett E, Kolpashchikov DM. Chem-BioChem. 2010;11:811–817. doi: 10.1002/cbic.201000006. [DOI] [PMC free article] [PubMed] [Google Scholar]
- 61.Mokany E, Bone SM, Young PE, Doan TB, Todd AV. J Am Chem Soc. 2010;132:1051–1059. doi: 10.1021/ja9076777. [DOI] [PMC free article] [PubMed] [Google Scholar]
- 62.Gerasimova YV, Kolpashchikov DM. Chem Biol. 2010;17:104–106. doi: 10.1016/j.chembiol.2010.02.003. [DOI] [PMC free article] [PubMed] [Google Scholar]
- 63.Stojanovic MN, Stefanovic D. J Am Chem Soc. 2003;125:6673–6676. doi: 10.1021/ja0296632. [DOI] [PubMed] [Google Scholar]
- 64.Gao W, Zhang L, Liang RP, Qiu JD. Chem Eur J. 2015;21:15272–15279. doi: 10.1002/chem.201502122. [DOI] [PubMed] [Google Scholar]
- 65.Gao W, Zhang L, Zhang YM, Liang RP, Qiu JD. J Phys Chem C. 2014;118:14410–14417. [Google Scholar]
- 66.Zadegan RM, Jepsen MDE, Hildebrandt LL, Birkedal V, Kjems J. Small. 2015;11:1811–1817. doi: 10.1002/smll.201402755. [DOI] [PubMed] [Google Scholar]
- 67.Liu YZ, Dong BR, Wu ZT, Fang W, Zhou GH, Shen AG, Zhou XD, Hu JM. Chem Commun. 2014;50:12026–12029. doi: 10.1039/c4cc01883d. [DOI] [PubMed] [Google Scholar]
- 68.Yang CN, Chen YL, Lin HY, Hsu CY. Chem Commun. 2013;49:8860–8862. doi: 10.1039/c3cc44823a. [DOI] [PubMed] [Google Scholar]
- 69.Cornett EM, Campbell EA, Gulenay G, Peterson E, Bhaskar N, Kolpashchikov DM. Angew Chem Int Ed. 2012;51:9075–9077. doi: 10.1002/anie.201203708. [DOI] [PMC free article] [PubMed] [Google Scholar]
Associated Data
This section collects any data citations, data availability statements, or supplementary materials included in this article.