

Abstract
Ribosomes are abundant cellular machines1,2 regulated by assembly, supernumerary subunit turnover, and nascent chain quality control mechanisms1–5. Moreover, nitrogen starvation in yeast has been reported to promote selective ribosome delivery to the vacuole in an autophagy conjugation system-dependent manner, a process called “ribophagy”6,7. However, whether ribophagy in mammals is selective or regulated is unclear. Using Ribo-Keima flux reporters, we find that starvation or mTOR inhibition promotes VPS34-dependent ribophagic flux, which unlike yeast, is largely ATG8 conjugation independent and occurs concomitantly with other cytosolic protein autophagic flux reporters8,9. Ribophagic flux was not induced upon inhibition of translational elongation or nascent chain uncoupling, but was induced in a comparatively selective manner upon proteotoxic stress via arsenite10 or chromosome mis-segregation11 dependent upon VPS34 and ATG8 conjugation. Unexpectedly, agents typically used to induce selective autophagy also promoted increased ribosome and cytosolic protein reporter flux, suggesting significant bulk or “by-stander” autophagy during what is often considered selective autophagy12,13. These results emphasize the importance of monitoring non-specific cargo flux when assessing selective autophagy pathways.
Substantial cellular resources are used to produce the 106–107 ribosomes present in a typical mammalian cell (~10% of protein mass), raising the question of to what extent ribosome recycling into building blocks is regulated. Previous studies in S. cerevisiae revealed ~3—fold faster delivery of ribosomes to the vacuole when compared with other cytosolic proteins under conditions of nitrogen starvation. Ribophagic flux in yeast required conjugation of the Atg8p Ub-like protein to phosphatidylethanolamine via Atg7p, and the Atg1p-Atg17p kinase which promotes phagophore formation6,8. In mammals, starvation-induced autophagy requires the VPS34-BECN1 PI3 kinase and the ULK1 protein kinase for phagophore initiation. In contrast, ATG8 conjugation pathway (employing ATG7 E1 enzyme and ATG5-ATG12 E3 complex) isn’t essential for starvation-induced flux but its deletion reduces the success rate autophagosomal closure by ~70% and productive lysosome fusion by ~30 min9. Conservatively, ~103 ribosomes may be randomly engulfed into a 0.5 μm3 autophagosome14 during starvation induced autophagy in a 3000 μm3 mammalian cell. However, the extent to which mammalian ribosomes are degraded through autophagy in healthy or stressed cells is unknown, as is whether selective forms of ribophagy are used to degrade, for example, translationally defective ribosomes3,4,5. Conversely, are particular cytosolic constituents excluded from autophagosomal engulfment during selective autophagy? If not, to what extent are cytosolic contents degraded through “by-stander” autophagy12,13during specific turnover of damaged organelles? Stated differently – how selective is selective autophagy?
To address these questions, we established a “Ribo-Keima” system (Fig. 1a) wherein chromosomal RPS3 (a 40S protein) or RPL28 (a 60S protein) in HCT116 and HEK293 cells were C-terminally tagged with Keima via gene-editing in heterozygous or homozygous form (Fig. 1b–d; Supplemental Fig. 1a). Keima is a pH-responsive reporter that undergoes a chromophore resting charge state change upon trafficking to the lysosome (pH~4.5), allowing flux measurements by flow cytometry or microscopy (Fig. 1a)15. Keima itself is also stable to lysosomal proteases in mammals, and appearance of a “processed” Keima protein therefore reveals lysosomal trafficking15,16,17. Ribo-Keima proteins formed ribosomes and polysomes (Fig. 1e,f; Supplemental Fig. 1b) and efficiently incorporated puromycin into nascent chains, indicating little effect on global translation (Supplemental Fig. 1c). Excess ribosomal subunits are degraded via the proteasome4,5. Ribo-Keima treated cells with the proteasome inhibitor Bortezomib (BTZ, 4h) failed to accumulate free monomeric RPS3-Keima or RPL28-Keima protein (Fig. 1e,f; Supplemental Fig. 1b), indicating stoichiometric assembly into ribosomes. As with DsRed18, heat induced hydrolysis of the N-acyl imine in Keima during denaturation produced a ~9 kDa N-terminal Keima fragment (fused with either RPS3 or RPL28) and a 21 kDa C-terminal Keima-Flag fragment (Supplemental Fig. 1d–f), accounting for bands indicated by an asterisk in immunoblots for RPS3 or RPL28 (Fig. 1d; Supplemental Fig. 1b,d).
Figure 1. Construction of a system for monitoring ribophagy flux in human cells.

(a) Schematic of ribophagy detection in mammalian cells using a Ribo-Keima reporter system. (b) View of the C terminus of RPL28 and RPS3 in a structure of 80S complex showing the solvent exposed site for Keima protein tagging. (PDB: 5AJ0) (c) Generation of homozygous RPL28-Keima and heterozygous RPS3-Keima reporter cell lines via CRISPR-Cas9 based gene editing. (d) Confirmation of the RPL28-Keima and RPS3-Keima expression in HEK293 and HCT116 cells by immunoblotting. Asterisk indicates Ribo-Keima protein fragments formed after the hydrolysis of the N-acyl imine in Keima chromophore during heat denaturation (see Supplemental Fig. 1d–f). Data shown represent more than three independent experiments with similar results. (e-f) Sucrose density gradient centrifugation shows proper assembly of RPL28-Keima and RPS3-Keima with 60S, 40S, 80S, and polysomes with or without 4h BTZ treatment (0.1 μM) to stabilize any unassembled subunits. Two independent experiments showed similar results. Unprocessed original scans of blots are shown in Supplemental Fig. 6.
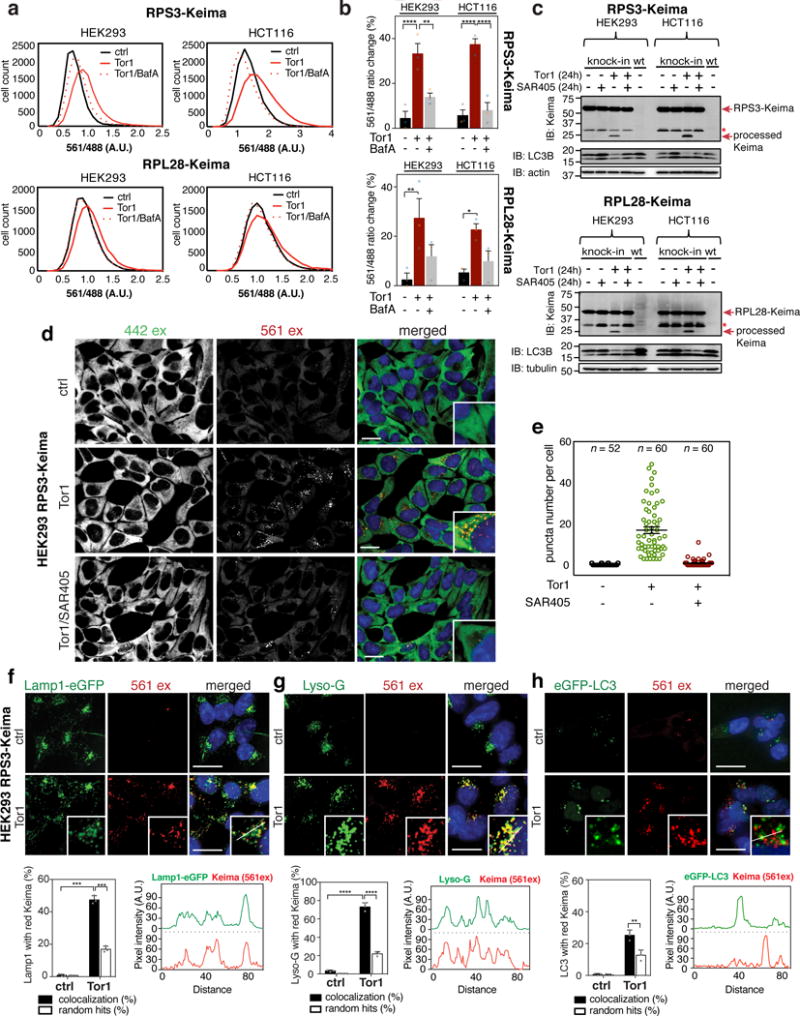
To examine ribophagic flux, we initially treated cells with the mTOR inhibitor Torin1 (Tor1). Inhibition of mTOR, a negative regulator of ULK119,20, results in increased bulk autophagic flux in a manner that partially mimics starvation. We found that all 4 Ribo-Keima cell lines displayed an increase in the 561/488 excitation ratio by flow cytometry that was reversed by addition of the lysosomal acidification inhibitor Bafilomycin (BafA) (Fig. 2a,b). Similarly, we observed formation of a “processed” form of Keima (25 kDa) reflecting degradation of the RPS3 and RPL28 fragments of each fusion protein by lysosomal hydrolases (Fig. 2c), and this was also blocked by the VPS34 inhibitor SAR405 (Fig. 2c). In parallel, we found that Tor1 promoted the formation of VPS34-dependent cytoplasmic Keima-positive (red) puncta15 (Fig. 2d,e) that co-localize with lysosomal markers (LAMP1-eGFP and Lysotracker Green, Lyso-G) (Fig. 2f,g). A subset (~20%) of Keima puncta were co-incident with eGFP-LC3B-positive puncta observed upon Tor1 addition (24h) (Fig. 2h), indicative of trafficking through the autophagosome. Control experiments wherein Keima signal was monitored by confocal microscopy at various times after washout of Tor1 (24h treatment) revealed that Keima puncta are maintained for at least 8h and the number of puncta isn’t altered by treatment with lysosomal hydrolase inhibitors, indicating that Keima is very stable within the lysosome, as previously reported15 (Supplemental Fig. 1h,i). An estimate of ~10% of ribosomes trafficking to lysosomes over the 24h period in Tor1-treated cells was obtained by comparing Keima fluorescence of cells at pH 7.5 and pH 4.5 with that of Tor1 treated cells in the presence of BafA (see METHODS). By contrast, <1% of ribosomes trafficked into lysosomes in complete growth media based on flow cytometry (see METHODS), and this level of ribophagy is generally undetectable by immunoblotting for processed Keima in Ribo-Keima reporter cells (Fig. 2c), indicating low basal ribophagic flux.
Figure 2. mTOR inhibition promotes ribophagy flux in a VPS34-dependent manner.
(a) Ribo-Keima reporter cells were treated with BafA (50 nM, 1h), Torin1 (150 nM, 24h), or combination of the two, then analyzed by flow-cytometry. Frequency distributions of 561/488 nm excitation ratios are shown (n = 10,000 cells per condition). (b) The mean value of the biological triplicate experiments for 561/488 nm excitation ratios (from panel b) is shown in the histogram. Error bars represent S.E.M. (****p <0.0001, **p <0.01, *p <0.04, Two-way ANOVA). (c) Ribo-Keima reporter cell lines treated with Torin1 (150 nM, 24h), SAR405 (an inhibitor of VPS34, 1 μM, 24h), or combination of the two were immunoblotted for Keima and LC3B. (For asterisk, see Supplemental Fig. 1d) (d) Confocal images of live HEK293 cells expressing RPS3-Keima after Torin1 (150 nM, 24h) or Torin1 (150 nM, 24h)/SAR405 (1 μM, 24h) co-treatment. (Scale bar = 20 μm) (e) Unbiased quantitation of the live-cell images in panel d for number of red Keima puncta per cell are shown. Mean ± S.E.M. (n=52, 60, 60 cells from three independent experiments) (f) HEK293 RPS3-Keima cells stably expressing LAMP1-eGFP were incubated in the presence or absence of Torin1 for 24h prior to live-cell imaging. (Scale bar = 20 μm) (g) HEK293 RPS3-Keima cells treated as in (f) were stained with LysoTracker Green prior to live-cell fluorescence microscopy. (Scale bar = 20 μm) (h) HEK293 RPS3-Keima cells stably expressing eGFP-LC3 were treated as in (f), then subjected to live-cell fluorescence microscopy. (Scale bar = 20 μm) For panels f-h, co-occurrence (%) of red Keima puncta with LAMP1-eGFP (n > 1800 puncta), LysoTracker Green (n > 2000 puncta), and eGFP-LC3 n > 110 puncta) were calculated and plotted as black bars. Random co-occurrence (%) is shown as white bars (see METHODS). Mean ± S.E.M. (****p < 0.0001, ***p < 0.001, **p < 0.01, Two-way ANOVA) Statistical source data for b, f, g, h can be found in Supplementary Table 2. All experiments were performed three times with similar results. Unprocessed original scans of blots are shown in Supplemental Fig. 6.
Ribophagy in yeast upon nitrogen deprivation requires Atg8p conjugation, the Ubp3p deubiquitylating enzyme, and Cdc48p ATPase6,7. Surprisingly, ATG5 deletion in HEK293 Ribo-Keima cells had no effect on ribophagic flux in response to Tor1 or starvation (Fig. 3a–g Supplemental Fig. 2a,c,e), while as expected based on VPS34 inhibition, deletion of the VPS34 regulatory subunit BECN120 greatly reduced ribophagic flux by flow cytometry, confocal imaging, or immunoblotting for processed Keima (Fig. 3a–d, Supplemental Fig. 2a–d). Moreover, ribophagic flux in HEK293 RPS3-Keima;ATG5−/− cells induced by Tor1 (24h) was reversed by treatment with SAR405 (Fig. 3c,d, Supplemental Fig. 2c), indicating that ATG5-independent flux nevertheless requires VPS3420,21. HEK293 RPS3-Keima;ATG5−/− cells also generated lysosomally processed Keima with rates similar to that seen in ATG5-expressing cells (Supplemental Fig. 2c). Ribophagic flux in HEK293 RPS3-Keima cells was initially detectable 8h post-starvation and increased slightly at 16h (Fig. 3e–g). However, no discernable kinetic differences in Keima puncta per cell were found to depend upon ATG5 status (Fig. 3e–g). In HCT116 RPL28-Keima cells, starvation promoted a time-dependent increase in Keima puncta per cell, which was 24-44% lower in parallel ATG5−/− cells (Fig. 3h, Supplemental Fig. 2f–i). The reduced autophagic flux was rescued upon stable expression of ATG5 in ATG5−/− cells, as examined by immunoblotting for lysosomally processed Keima (Supplemental Fig. 2i). Additional evidence that ribophagy in HEK293 cells upon mTOR inhibition is conjugation system independent includes: 1) presence of ribosomes in autophagosomal structures of ATG5−/− cells by electron microscopy (Fig. 3i), 2) co-localization of Keima signal (561 nm excitation) with LAMP1-eGFP-labeled lysosomes (Supplemental Fig. 2j), 3) no effect on Keima puncta number or intensity in ATG5−/− cells treated with lysosomal hydrolase inhibitors for 14h during mTOR inhibition, indicating that the Keima turnover rate in the lysosome is similar in ATG5+/+ and ATG5−/− cells (Supplemental Fig. 2k), and 4) absence of eGFP-LC3 puncta associated with 561 nm excitation puncta (Supplemental Fig. 2l). Thus, neither Tor1 nor starvation induced ribophagy absolutely requires ATG8 conjugation but both require the VPS34 pathway. Similar results were obtained using HEK293 cells expressing levels of free Keima protein comparable to that in cells expressing RPS3-Keima (Supplemental Fig. 3a), consistent with the absence of selectivity in ribophagy flux observed upon Tor1 treatment or starvation. Interestingly, Keima-LC3 protein expressed in ATG5−/− cells showed lysosomal flux comparable to ribosomes, further suggesting ATG8 conjugation independent bulk autophagy.
Figure 3. Ribophagy in response to mTOR inhibition in HEK293 cells is ATG5-independent but BECN1-dependent.
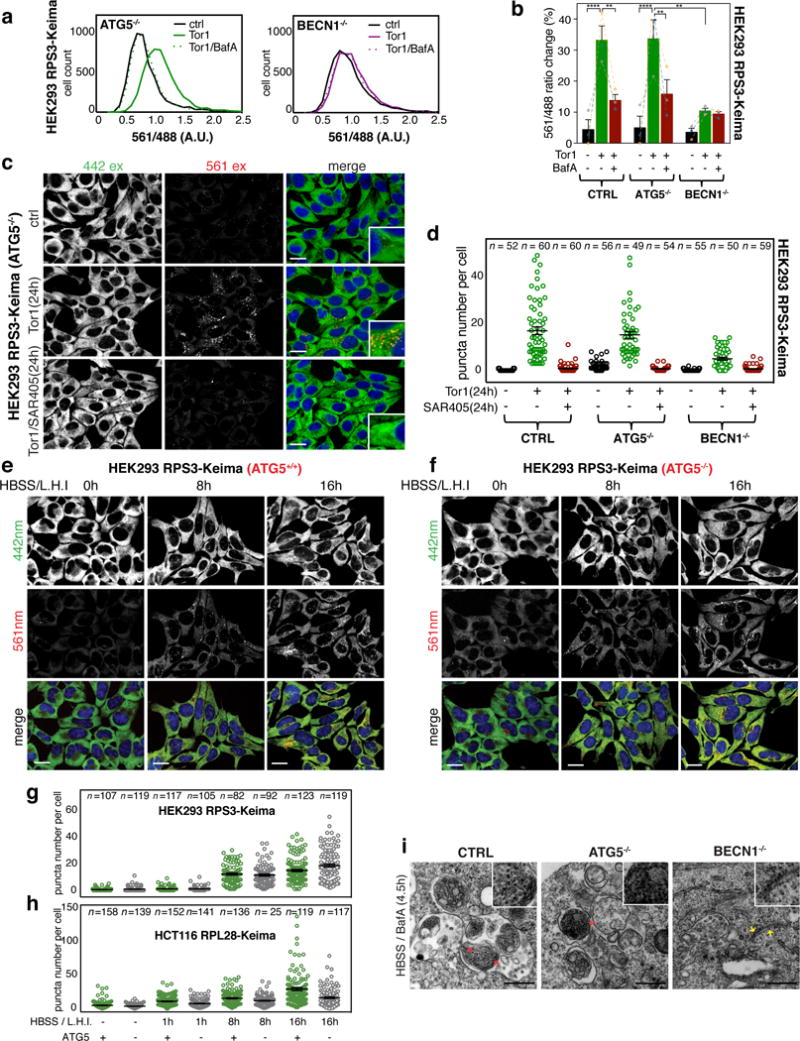
(a) Frequency distributions of 561/488 nm excitation ratios measured on HEK293 RPS3-Keima cells lacking ATG5 or BECN1 were compared after Torin1 or Torin1/BafA treatment using flow cytometry. (n = 10,000 cells per condition) (b) Average 561/488 nm excitation ratios calculated from the biological triplicate experiments from panel a. Mean ± S.E.M. (****p < 0.0001, **p < 0.01, Two-way ANOVA) (c) Confocal images of live HEK293 RPS3-Keima cells lacking ATG5 after Torin1 (150 nM, 24h) or Torin1 (150 nM, 24h)/SAR405 (1 μM, 24h) co-treatment. (Scale bar = 20 μm) (d) Number of red Keima puncta/cell was measured from the live-cell images of HEK293 RPS3-Keima WT, ATG5−/−, or BECN1−/− cells taken after Torin1 (150 nM, 24h) or Torin1 (150 nM, 24h)/SAR405 (1 μM, 24h) co-treatment. Mean ± S.E.M. (Total number of cells from three biologically independent samples are indicated in the graph) (e,f) HEK293 RPS3-Keima cells (with or without ATG5) were incubated with HBSS in the presence of lysosomal hydrolase inhibitors (L.H.I., E64d and Pepstatin, 30 μM each) for the indicated times prior to live cell imaging. (Scale bar = 20 μm) (g) Unbiased quantification of the live-cell images obtained as shown in panels e and f. (h) Unbiased quantification of red Keima puncta obtained from live HCT116 RPL28-Keima cells (with and without ATG5) as shown in Supplemental Fig. 2g,h. In panels g and h, total number of cells from three biologically independent samples are indicated in the graph, and Mean ± S.E.M. is shown. (i) Electron microscopy images of HEK293 RPS3-Keima WT, ATG5−/− and BECN1−/− cells 4.5 h after HBSS treatment in the presence of BafA (50 nM). Red arrow: ribosomes in autophagosomes or autophagolysosomes, yellow arrow: ribosomes bound to ER in cytosol (Scale bar = 500 μm). The data shown represents two independent experiments. Statistical source data for b can be found in Supplementary Table 2. All experiments were repeated at least three times unless otherwise indicated.
We examined the involvement of USP10 (Ubp3p in yeast) and p97/VCP (Cdc48p in yeast) in mammalian ribophagy7. The p97 inhibitor CB508322 had no effect on Ribo-Keima processing during mTOR inhibition (Supplemental Fig. 3b), indicating that p97 isn’t required for this form of ribophagy. The USP10 inhibitor Spautin23 reduced ribophagy of both 40S and 60S subunits (Supplemental Fig. 3c,d); however, this likely reflects the role of USP10 in maintaining BECN1-VPS34 activity in mammals23 rather than being directly involved in ribophagy. Consistent with recent work9, we did not observe a proposed role8 for Golgi as source of membranes for ATG8 conjugation-independent autophagy, as Brefeldin A had no effect on Tor1-induced ribophagy in Ribo-Keima ATG5−/− cells (Supplemental Fig. 3e). Moreover, we did not observe a correlation of Keima-positive lysosome localization with the Golgi network but did observe association with the ER, a source of autophagic membranes21 (Supplemental Fig. 3f,g).
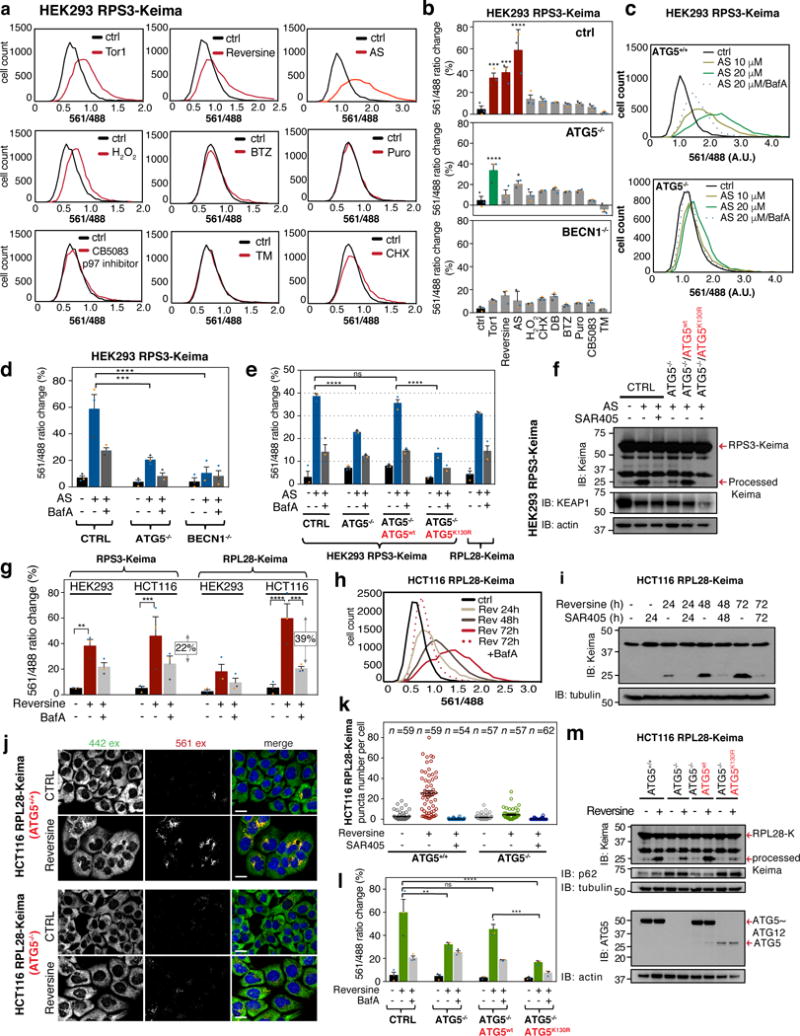
Maintaining healthy ribosomes is thought to be critical for the cellular homeostasis, and agents that induce ribosomal stress could promote a need for re-establishment of ribosome pools24. We therefore screened translation inhibitors and stress agents for increased ribophagic flux. Addition of nascent chain terminator puromycin, elongation inhibitor cyclohexamide (CHX), and the p97 inhibitor (CB5083)22 which blocks extraction of ubiquitylated nascent chains from the ribosome had no appreciable effect on ribophagic flux (Fig. 4a,b). Similarly, proteasome inhibitor BTZ or ER-stress agent tunicamycin (TM) did not promote ribophagic flux (Fig. 4a,b). In contrast, ribophagic flux similar to or greater than that seen with mTOR inhibition was induced by Reversine, an MPS1 inhibitor that creates proteome imbalance through chromosome missegregation11,25,26, and by sodium arsenite (AS), which induces stress granules10 and translational inhibition (Supplemental Fig. 4a). Oxidative stress by H2O2 tended toward an increase in ribophagic flux (p >0.1) (Fig. 4a,b).
Figure 4. A screen of ribosome stress agents identifies sodium arsenite and reversine as ribophagy inducers.
(a) HEK293 RPS3-Keima cells were exposed to (Tor1, 150nM, 24h; Reversine, 0.5μM, 48h; Sodium Arsenite (AS), 10μM, 24h; H2O2, 250μM, 24h; Cycloheximide, 10μM, 5h; Diazaborine, 200μM, 24h; Bortezomib, 250nM, 5h; Puromycin, 1μM, 5h; p97 inhibitor CB5083, 100nM, 24h; Tunicamycin, 0.6μM, 24h), and 561/488 ratio measured. (n=10,000 cells/condition) (b) HEK293 RPS3-Keima:WT, ATG5−/−, and BECN1−/− cells treated as in a.. Mean 561/488 ratios are plotted. (n=3 independent experiments, Supplemetary Table 2). (c) Frequency distributions of 561/488 ratios measured in HEK293 RPS3-Keima:ATG5+/+, ATG5−/− cells treated with AS. (n=4200 cells/condition) (d) The average 561/488 ratios from triplicate experiments as in panel c. (e) HEK293 RPS3-Keima:ATG5−/− cells transduced with a lentivirus expressing either ATG5 or conjugation defective ATG5K130R mutant were treated with AS (10μM, 24h). The average 561/488 ratios of biological triplicate experiments are shown. Mean of two independent experiments is shown for ATG5K130R cells. (f) Immunoblotting of indicated cells treated with AS (20μM, 20h). (g) The average 561/488 ratios of the indicated cell lines treated with Reversine (0.5μM, 48h) ± BafA (50nM, 1h). (n=3 independent experiments) (h) Frequency distributions of 561/488 ratios for HCT116 RPL28-Keima cells with or without Reversine treatment. (n=10,000 cells/condition) (i) Immunoblot of HCT116 RPL28-Keima cells treated with Reversine ± SAR405. (j) Imaging of HCT116 RPL28-Keima:ATG5+/+, ATG5−/− cells ± Reversine (0.5μM, 48h). (Scale bar=20μm) (k) Quantification of the images in panel j. Mean ± S.E.M. (Total number of cells are indicated as n) (l) The average 561/488 ratios of cells treated with Reversine (0.5μM, 48h). (n=3 independent experiments) (m) Immunoblots of indicated cell lines treated as in panel l. Mean ± S.E.M. is shown in panel b,d,e,g,l. (****p<0.0001, ***p<0.001, **p<0.01, panel b:One-way ANOVA, panel d,e,g,l:Two-way ANOVA) All experiments were repeated three times unless otherwise indicated. Statistical source data are in Supplementary Table 2. Unprocessed original scans are shown in Supplementary Fig. 6.
Stress granules are thought to undergo ATG8 and p97-dependent selective autophagy27,28. Consistent with previous reports27, AS induces stress granules marked with eIF4E-eGFP and 40S ribosomal protein RPS3-Keima but not with RPL28-Keima (Supplemental Fig. 4b,c). However, stress granule formation was AS concentration dependent (Supplemental Fig. 4d). At 20 μM AS, processed Keima in HEK293 RPS3-Keima cells was detected by ~3 h post AS treatment and was blocked by SAR405 up to 18 h post treatment without obvious stress granule or ribosome aggregate formation (Supplemental Fig. 4e,f). We found that AS-induced ribophagy as measured in HEK293 RPS3-Keima cells was largely dependent upon ATG5 and its ATG12 conjugate, and was reversed by BafA (Fig. 4c–f; Supplemental Fig. 4g). Consistent with flow cytometry (Fig. 4a,b), AS produced more processed Keima than Tor1 treatment, and also led to inhibition of pT389 S6K (Supplemental Fig. 4h), in agreement with reduced mTOR activity29. Unexpectedly, however, ribophagic flux was also increased by AS in HEK293 RPL28-Keima cells and was reduced by BafA (Fig. 4e), indicating that the 60S subunit also undergoes autophagy. Ribophagic flux for both HEK293 RPS3-Keima and RPL28-Keima was reduced upon addition of CB5083 (Supplemental Fig. 4i). Thus, although both Tor1 and AS inhibit S6K phosphorylation and induce ribophagic flux, AS-induced ribophagy largely requires ATG5 and p97 while Tor1 does not.
Reversine-induced chromosome mis-segregation produces supernumerary protein subunits, protein complex imbalance, proteotoxic stress, and activation of autophagy to presumably facilitate removal of misfolded or supernumerary proteins11. To examine Reversine-induced ribophagic flux, we employed HCT116 Ribo-Keima cells, which have a stable and near diploid karyotype. We observed increased ribophagy flux with both RPS3- and RPL28-Keima upon Reversine treatment, but 60S subunit RPL28-Keima reporter showed ~2 fold higher Keima ratio change responsive to BafA (Fig. 4g). In RPL28-Keima cells, processed Keima was detected as early as 24h post Reversine treatment (Fig. 4h,i). Reversine-dependent ribophagic flux was reversed by BafA and SAR405 (Fig. 4g–i), and was strikingly ATG5 dependent (Fig. 4j–m).
The distinct ATG5 dependence observed between Tor1-induced versus AS or Reversine-induced ribophagic flux led us to examine the relative selectivity of ribophagy in comparison to additional Keima flux reporters, including autophagosomes themselves (Keima-LC3), cytosol (LDHB-Keima), cytoskeleton (ACTB-Keima), proteasome (PSMD12-Keima), or mitochondria (TOMM20-Keima). Stable Keima reporter cells were sorted to achieve comparable levels of expression but lower than that for the Ribo-Keima reporters (Fig. 5a–d; Supplemental Fig. 5a). To assess relative cargo flux, HEK293 reporter cell lines were treated with either Tor1, AS, or SAR405 to block basal autophagy, and extracts examined by immunoblotting for processed Keima (Fig. 5b) with signals then normalized to Tor1 treated cells (see METHODS) (Fig. 5e). AS induces lysosomal delivery of Keima-LC3 to a level comparable to that induced by Tor1, indicating elevated overall autophagy flux. Likewise, non-ribosomal Keima reporter proteins displayed a similar level of increase in autophagic flux after AS and Tor1 treatment (Fig. 5b,e). Moreover, in contrast with other reporter proteins, ribophagic flux measured with both RPS3-Keima and RPL28-Keima was 3-4—fold higher than with Tor1, indicating a level of selectivity for this cargo. The increased selectivity for ribophagic flux with AS reflects a much lower rate of basal flux when compared to the other cargo, and a larger induced flux relative to Tor1 treatment (Fig. 5b, Supplemental Fig. 5b–c). Analogous experiments were performed with HCT116 cells in the context of Reversine treatment, again revealing selectivity in Reversine-dependent turnover of RPL28-Keima when compared with Tor1 treatment, while with the other reporters, the increased flux was again comparable to that seen with Tor1 treatment (Fig. 5c,d,f). Unlike AS, however, Reversine did not inhibit S6K phosphorylation (Fig. 5b,d) and did not promote selective turnover of RPS3-Keima (Fig. 5f), suggesting distinct flux parameters for large and small ribosome subunits in this setting.
Figure 5. Quantitative Western blot analyses of various Keima reporter cell lines reveal selective capture of ribosomes during AS and Reversine treatment and the relative quantity of “by-stander” autophagy during selective autophagy.

(a) Confocal images of live HEK293 cells expressing 7 different Keima reporter proteins show proper intracellular localization. (b) Extracts from the indicated cell lines treated with SAR405 (1μM, 20h), AS (20μM, 20h), or Tor1 (150nM, 20h) were subjected to immunoblotting. The representative Western blot images were developed using HRP conjugated secondary antibodies, whereas the quantitative Western blot analysis of biological triplicate experiments was performed using NIR fluorescent secondary antibodies. Blot images were processed using Odyssey CLx imager for quantitation. (c) Proper localization of Keima reporter proteins expressed in HCT116 cells is confirmed by live cell imaging. (a,c:scale bar=5μm) (d) Extracts from the indicated HCT116 Keima reporter cell lines treated with SAR405 (1μM, 20h), Tor1 (150nM, 20h), or Reversine (0.5μM, 48h) were subjected to immunoblotting. (e,f) Quantitation of immunoblots obtained as in b and d is plotted. Processed Keima band intensity of each lane was normalized by the intact Keima band intensity in the same lane. Then, the relative abundance of processed Keima in AS or Reversine treated cells was normalized with Torin1 treated cells (internal standard for each cell line). Mean ± S.E.M. Total number of biologically independent experiments are indicated in the graph. (g,h,i) “By-stander” autophagy during mitophagy, pexophagy, and lysophagy was analyzed using HEK293 Keima reporter cell lines. Corresponding cells were treated either with Antimycin A (10 μM, 15h) and Oligomycin A (5 μM, 15h) or with Clofibrate (500 μM) for indicated time to induce mitophagy and pexophagy, repectively. Keima reporter cell lines used for mitophagy analysis stably express exogenous PARKIN. To induce lysophagy, cells were treated with L-Leucyl-L-Leucine methyl ester (LLOMe, 1 mM) for 1 hour, then further incubated with fresh media for 24 hours. Red arrow indicates lysozyme resistant Keima (25kDa) fragment. All experiments were repeated more than three times unless otherwise indicated. Statistical source data can be found in Supplementary Table 2. Unprocessed original scans of blots are shown in Supplementary Fig. 6.
Increased flux for various cytosolic cargo (e.g. LDHB) in response to AS treatment, which ostensibly promotes selective targeting of stress granules for autophagy10, led us to ask the extent to which conditions that are thought to promote selective forms of autophagy induce “by-stander” autophagy12,13. The extent to which cytosolic proteins are captured during what would otherwise be considered selective cargo capture has not been examined systematically. Relative to basal conditions, PARKIN-dependent mitophagy via mitochondrial depolarization with Antimycin A and Oligomycin A (AO) induced autophagic flux for all reporters tested to an extent similar to that seen with Tor1, with LDHB-Keima, for example, increasing 2-4—fold above basal conditions (Fig. 5g). Similar results were obtained for cells treated with pexophagy-inducing Clofibrate (Fig. 5h), and lysophagy-inducing LLOMe (Fig. 5l). Thus, agents used for induction of selective autophagy of cytosolic membrane-bound organelles also promoted capture of additional cytosolic proteins with diverse sub-cellular localization and assembly patterns.
Here, we set out to systematically assess ribophagic flux in mammalian cells. Under basal conditions, ribophagic flux is extremely low (<1% over ~24h period) in HEK293 cells. As with yeast, nutrient deprivation (as well as mTOR inhibition) increases ribophagic flux (to ~10% of ribosomes over a 24h period in human cells), but in contrast with yeast, neither ATG8 conjugation nor the p97 ATPase is required. Moreover, ribophagic flux was comparable to free Keima flux, indicating that ribophagy under these conditions is not selective as classically defined30. Surprisingly, agents that induce defects in ribosomal quality control did not promote robust ribophagy, suggesting that autophagy isn’t generally used for turnover of translationally impaired ribosomes. However, we found that proteotoxic stress agents such as AS and Reversine promote ATG5-dependent ribophagic flux, and in the case of AS, flux depended substantially on p97. The comparative selectivity of ribophagic flux relative to other cytosolic cargo primarily reflected a lower basal rate of ribophagic flux. Interestingly, autophagic flux of the cytosolic reporter LDHB-Keima in response to either AS or Reversine was largely dependent upon ATG5−/− (Supplemental Fig. 5c,d). In contrast, Tor1-dependent turnover of cytosolic forms of Keima is ATG5-independent, but with similar overall flux rates as observed with ribosomes (Supplemental Fig. 3a). This suggests that bulk autophagy induced by mTOR inhibition is mechanistically distinct from that induced by some, but not all, forms of proteotoxic stress. It remains to be determined whether the key parameters for determining the dependency on ATG8 conjugation involve either the types of cargo being produced or, alternatively, the overall abundance of the cargo needing to be degraded through autophagy.
Selective autophagy often involves the Ub system30. Whether and how Ub supports ribophagy in mammals is unknown, although 40S ribosomal subunits are ubiquitylated upon stress31. We found that the Ub activating enzyme UBA1 inhibitor MLN7243 reduces AS-induced ribophagic flux by 3-4—fold and LDHB flux to a lesser degree (1.6—fold) (Supplemental Fig. 5e–h), but did not affect Tor1 or Reversine-induced ribophagic flux (Supplemental Fig. 5e–i). AS promotes phosphorylation of the Ub-binding autophagy receptor p62 (also called SQSTM1), stimulating its ability to bind and inhibit the NRF2 Ub ligase KEAP1 as well as promoting p62 recruitment to autophagic cargo29. However, p62 deletion in Ribo-Keima reporter cells had no effect on AS or Reversine-induced ribophagic flux (Supplemental Fig. 5j–l), indicating that p62 is not essential for ribophagic flux under these conditions. Further studies are necessary to understand the mechanism of Ub usage in cargo selection during stress-induced autophagy. Finally, we found that diverse cytosolic proteins are captured under conditions ostensibly used to promote selective forms of organellar autophagy at levels comparable to that seen upon induction of bulk autophagy with mTOR inhibition. While cytosolic proteins may be captured within autophagosomes during organellar capture, referred to as “by-stander” autophagy12,13, the magnitude of non-selective cargo capture observed here was often comparable to that seen upon induction of bulk autophagy by Tor1. This raises the possibility that some agents used to promote selective organellar autophagy may also induce proteotoxic stress that then simultaneously promotes bulk autophagy. In this regard, formation of “ectopic” autophagosomes unlinked to mitochondrial cargo has been observed upon treatment with depolarization agents32. Whether or not stress granules are selectively degraded as opposed to being cleared via stress induced bulk autophagy that is ATG8 dependent remains unclear, but is suggested by our finding that levels of AS that do not generate obvious stress granules nevertheless induce widespread autophagic degradation of ribosomes and LDHB (Supplemental Fig. 5c). This work suggests the importance of testing alternative cargo when examining the selectivity of cargo capture and degradation, emphasizes the emerging theme8,9 that some forms of induced autophagy need not be ATG8 conjugation dependent, and provides a framework and tools for analysis of selective autophagy.
METHODS
Methods and any associated references are available in the online version of the paper.
METHODS
Antibodies and chemicals
The following antibodies and reagents were used in this study: Keima (M126-3M, MBL), RPS3 (9538s, Cell Signal Technology), RPL28 (ab138125, Abcam), LC3B (2775S, Cell Signal Technology), ATG5 (12994s, Cell Signal Technology), ATG12 (4180T, Cell Signal Technology), BECN1 (3495, Cell Signal Technology), p70 S6K (2708T, Cell Signal Technology), p70 S6K phospho-T389 (9234S, Cell Signal Technology) Actin (sc-69879, Santa-Cruz), Tubulin (ab7291, Abcam), PCNA (SC56, Santacruz), KEAP1 (10503-2-AP, Proteintech), p62 (H00008878-M01, Novus Biologicals), Flag (M8823, Sigma), Puromycin antibody (MABE343, EMD Millipore), p62 p-S349 (Abgent, AP20690b), Ubiquitin (Dako, z045801-2), Anti-Mouse IgG (H+L) HRP conjugate (w4021, Promega), Western Lightning Plus-ECL (NEL105001, Perkin Elmer), Anti-Rabbit IgG (H+L), HRP conjugate (w4011, Promega), Bortezomib (A2614, APExBIO), IRDye 800CW Goat anti-Mouse IgG H+L (925-32210, LI-COR), Torin1 (14379, Cell Signal Technology), SAR405 (A8883, APExBio), Bafilomycin A (B1793, Sigma), Chloroquine diphosphate salt (C6628, Sigma), Lysotracker Green (L7526, ThermoFisher Scientific), ER-Tracker Green (E34251, ThermoFisher Scientific), CellLight Golgi-GFP (C10592, ThermoFisher Scientific), HBSS (14025092, Invitrogen), E64d (A1903, APExBIO), Pepstatin A (P5318, Sigma), Reversine (R3904, Sigma), Sodium (meta) arsenite (S7400, Sigma), Hydrogen peroxide solution (H1009, Sigma), Cycloheximide (C1988, Sigma), Diazaborine (530729, EMDmillipore), Puromycin Dihydrochloride (P-600-500, Gold Biotechnology), Brefeldin A (9972s, Cell Signal Technology), CB5083 (CB-5083, Selleckchem), Tunicamycin (T7765, Sigma), Poly-L-lysine solution (P4832, Sigma), Lipofectamine 3000 (L3000008, Invitrogen), FluoroBrite DMEM (A1896701, ThermoFisher Scientific), Benzonase Nuclease HC (71205-3, Millipore), SURVEYOR Mutation Detection Kit (706025, Integrated DNA Technologies), GeneArt Precision gRNA Synthesis Kit (A29377, ThermoFisher Scientific), RNasin (N2111, Promega), Neon Transfection System (MPK1025, ThermoFisher Scientific). The dilutions and clone numbers of all antibodies used in this study can be found in Supplementary Table 3.
Cell culture
HEK293, HCT116, and HEK293T cells were grown in Dulbecco’s modified Eagle’s medium (DMEM) supplemented with 10% fetal calf serum and maintained in a 5% CO2 incubator at 37°C.
Generation of Keima knock-in cell lines using CRISPR-Cas9 gene editing
gRNAs targeting C-terminus region of human RPS3 and RPL28 genes were designed using the CHOPCHOP website (http://chopchop.cbu.uib.no/). The guide sequence for RPS3 gene (5′- GACATACCTGTTATGCTGTG-3′) and RPL28 gene (5′- CTTTCTCACCTGCCTCGAC-3′) were assembled into pX330 plasmid33. Donor vector was constructed by assembling Keima-Flag transgene with upstream and downstream homology arms (650 nucleotide each) into digested pSMART plasmid by Gibson assembly. HEK293 and HCT116 cells were transfected with donor and gRNA vectors (1 to 1 ratio) by Lipofectamine 3000 (Invitrogen). Five days after the transfection, Keima fluorescent positive cells were sorted into 96 well plates by flow-cytometry (MoFlo Astrios EQ, Beckman Coulter). Three weeks later, the expanded single-cell colonies were screened for the integration of the Keima transgene by genotyping, followed by immunoblotting with anti-Keima, anti-RPS3 or anti-RPL28, and anti-Flag antibodies. Finally, genomic DNA of colonies showing integration of Keima by genotyping and immunoblotting methods were isolated and the targeted regions were PCR amplified for sequencing confirmation. The sequences of primers used for genotyping can be found in Supplementary Table 1.
Generation of gene knock-out cell lines using CRISPR-Cas9 gene editing
ATG5 and BECN1 knock-out on HEK293 cell lines was carried out by electroporation method. Initially, six guide RNAs for ATG5 and BECN1 knock-out were designed using CHOPCHOP website. The in vitro transcription of gRNA templates was carried out using GeneArt Precision gRNA synthesis kit, followed by the purification. Cas9 protein and gRNA complex were electroporated into HEK293 cells using Neon® Transfection System Kit (Thermo Fisher Scientific). 48 hours after the electroporation, gene cleavage efficiency of each guide RNA was measured by Surveyor assay. The following gRNA was shown the best cutting efficiency among the tested guides: ATG5 (5′-GATCACAAGCAACTCTGGAT-3′, exon5) and BECN1 (5′-GTAGTAGGCACCTGGCTGGG-3′, exon4). Single cell was sorted into 96 well plate using limiting dilution method, and expanded clonal cells were screened by immunoblotting with anti-ATG5 or anti-BECN1 antibodies. ATG5, p62 knock-out on HCT116 cell lines and p62 knock-out on HEK293 cell lines were carried out by plasmid based transfection of Cas9/gRNA using pX449 plasmid as described previously33 using the following guide sequence: 5′-GATCACAAGCAACTCTGGAT-3′ (exon5) for ATG5, 5′-GCGAGGGAAAGGGCTTGCAC-3′ (exon3) and 5′-TGTAGCGTCTGCGAGGGAAA-3′ (exon3) for p62. After initial screening by immunoblotting, clear knock-out was further confirmed by Next-generation sequencing. The sequences of primers used for the Surveyor assay and Next-generation sequencing can be found in Supplementary Table 1.
Cloning and generation of stable cell lines
Cloning
Full-length clones for human Lamp1, LC3, eIF4E, LDHB, TOMM20, ACTB, PSMD12, PEX3, and ATG5 were obtained from the human orfeome collection (ver. 8). Lysine to arginine substitution in ATG5 was created using standard site-directed mutagenesis. The destination pHAGE vectors containing N-terminal or C-terminal eGFP and Keima tags were prepared by Gibson assembly. Using Gateway cloning system, lentiviral based expression vectors containing N-terminal tandem eGFP tagged LC3, C-terminal tandem eGFP tagged Lamp1 and eIF4E, and N- or C-terminal tandem Keima tagged constructs were generated. In the case of Lamp1-eGFP construct, the linker between Lamp1 and the eGFP was replaced into GGSGGS sequence by Gibson assembly to prevent possible mis-localization of the protein because the linker immediately follows the YXXI sorting motif on C-terminal site of Lamp1.
Stable cell line generation
293T cells were transfected with the corresponding lentivral expressing vectors using Lipofectamine 3000 (Invitrogen). Virus-containing supernatant was harvested 48h post-transfection. HEK293 and HCT116 cell lines were infected with the virus to create stable cell lines. In the case of eGFP-LC3 and Lamp1-eGFP expressing cell lines, eGFP positive cells were single cell sorted by flow-cytometry to generate clonal cell lines. Free-Keima, Keima-LC3, mito-Keima, LDHB-Keima, TOMM20-Keima, Keima-ACTB, PSMD12-Keima, and PEX3-Keima expressing cell lines were first selected with Puromycin (Invitrogen) for at least one week, then sorted by flow-cytometry (MoFlo Astrios EQ, Beckman Coulter) twice with 2weeks interval in order to equalize the Keima expression levels. Keima signal level of RPS3-Keima expressing cells was used as standard for sorting cells with similar Keima expression level.
Cell lysis and immunoblotting assay
Cells were cultured in the presence of the corresponding chemicals to ~50-60% confluency in 6-well plate, then trypsinized, pelleted by centrifugation, washed with DPBS, and pelleted again. The cell pellet was lysed with RIPA buffer containing mammalian protease inhibitor cocktail (Sigma) and 20 unit/ml Benzonase (Millipore), followed by centrifugation (13000 rpm). The concentration of the supernatant was measured by Bradford assay, and the whole cell lysate was denatured by the addition of LDS supplemented with 100 mM DTT, followed by boiling at 75°C for 5 minutes. 40 μg of each lysate was loaded onto the 4-20% Tris-Gly gel (Thermo Fisher Scientific) or 4-12% NuPAGE Bis-Tris gel (Thermo Fisher Scientific), followed by SDS-PAGE with Tris-Glycin SDS running buffer (Thermo Fisher Scientific) or MES SDS running buffer (Thermo Fisher Scientific), respectively. The proteins were electrotransferred to PVDF membranes (0.45 μm, Millipore), and then immunoblotted using antibodies as indicated. For quantitative immunoblotting of Keima reporter cells, 80-100 μg of total lysate was loaded on to SDS-PAGE gel due to low expression level of Keima construct and small amount of processed Keima level, except Keima-LC3 (35 μg). 4-20% Tris-Gly gel was used to resolve the proteins. After transfer, the membrane was blocked with 5% non-fat milk, incubated with anti-Keima mouse antibody (4°C, overnight), washed three times with TBST (total 30 min), and further incubated with fluorescent IRDye 800CW Goat anti-Mouse IgG H+L secondary antibody (1:20000) for 2 hours. After severe wash with TBST for 30 min, the processed Keima band intensity (25kDa) was measured using OdysseyCLx imager and divided by the normalized signal of intact-Keima protein. The processed Keima to intact Keima-protein ratio was compared within the gel, and where quantitation obtained from independent immunoblots were compared, Torin1 treatment condition was used as an internal control. In the case of Keima-LC3 cell lines, tubulin was used to normalize the processed Keima signal because LC3 is an autophagy machinery rather than a cargo. Thus, accumulated processed Keima level normalized by tubulin level reflects total autophagy flux.
Sucrose density gradient fractionation
Cells were grown to 60% confluency in 15 cm dishes with or without Bortezomib for 4 hours. Then the cells were treated with cycloheximide (100 μg/ml) for 10 minutes and collected after trypsin treatment. 1.5 ml of ribosome purification buffer (200 mM HEPES, 300 mM NaCl, 50 mM MgCl2, 100 μg/ml cycloheximide, 0.5% Triton-X, protease inhibitor tablet (Roche), 50 unit/ml RNasin) was added to resuspend the cells, and the suspension was passed through a 23G needle over 10 times. After centrifugation for 5 minutes with 13,000 rpm, the supernatant was loaded on top of the 5-50% sucrose gradient column prepared in house. Using SW40 motor (Beckman Coulter), the sucrose gradient was centrifuged for 2h at 35,000 rpm (4 °C), followed by 1 hour of no-break deceleration. A small hole was made at the bottom of the tube, and the sample was fractioned into 1.5 ml tubes (750 μl each). RNA level was measured by Nano-drop (260 nm UV Abs), and each fraction was immunoblotted using the corresponding antibodies.
In vitro translation reactions
Cells were grown to 60% confluency in 6-well plates. The cells were treated with Puromycin (1 μg/ml) for 15 minutes, then harvested after trypsin treatment. After the cell lysis using RIPA buffer, the immunoblotting assay was performed with anti-Puromycin antibody.
Flow-cytometry analysis
Cells were grown in the presence of the corresponding chemicals to 60% confluency in 6-well plates, then collected after trypsin treatment. After re-suspending the cells in a FACS buffer (1x DPBS, 1 mM EDTA, 1% FBS, 25 mM HEPES, final pH 7.3-7.5), the cells were analyzed by flow-cytometry (MoFlo Astrios EQ, Beckman Coulter). The data was processed by FlowJo software. The 561/488 nm ratio distribution graph was processed in Prism software after exporting the 488 and 561 nm ex/em intensity of individual cells (10000 cells) were exported. An example of the gating strategy used for flow cytometry analysis is shown in Supplementary Figure 5.
Calculation of approximate percentage of ribosomes undergoing ribophagy before and after Torin1 treatment
HEK293 RPS3-Keima cells were collected in pH 7.3 or pH 4.5 buffer, and incubated for 30 minutes. 561/488 nm excitation fold increase from cells in pH 7 buffer to pH 4.5 buffer was calculated to be 2.020 (a). This condition mimics the situation that near 100% ribosomes are undergoing ribophagy, because all the cytosolic ribosomes are in pH 4.5. The 561/488 nm excitation fold increase of control cells and Torin1 (24h) treated cells responsive to Bafilomycin A was 0.027 and 0.194, respectively (b and c, respectively). This value represents lysosomal population of ribo-Keima before and after 24h of Torin1 treatment. The ratio of (b) to (a) is 1.3% and the ratio of (c) to (a) is 10.4%, which represents the percentage of ribosomes undergoing ribophagy before and after Torin1 treatment compared to the total ribosomes.
Live-cell confocal microscopy
Cells were plated onto 33 mm-glass bottom dish (No. 1.5, 14 mm glass diameter, MatTek) pre-treated with poly-L-lysine, then incubated in phenol-red free medium (FluoroBrite™DMEM, Thermo Fisher) containing L-glutamine (2 mM) and sodium pyruvate (1 mM) for 48 hours. Followed by the treatment with corresponding chemicals or HBSS, the cells were stained with 2.5 μg/ml Hoechst 33342 (Thermo Fisher Scientific) for 10 minutes. The media was replaced to fresh FluoroBrite™DMEM (37°C), and cells were imaged using a Yokogawa CSU-X1 spinning disk confocal with Spectral Applied Research Aurora Borealis modification on a Nikon Ti motorized microscope equipped with a Nikon Plan Apo 60×/1.40 N.A objective lens. Pairs of images for ratiometric analysis of mKeima fluorescence were collected sequentially using 100 mW 442 nm and 100 mW 561 solid state lasers attenuated and controlled with an AOTF (Spectral Applied Research LMM-5), and emission collected with a 620/60 nm filter (Chroma Technologies). Widefield fluorescence images of Hoeschst were collected using a Lumencor SOLA light source, 395/35nm excitation and 480/40nm emission filters (Chroma Technologies). Both confocal and widefield images were acquired with the same Hamamatsu ORCA-ER cooled CCD camera and MetaMorph software. Seven z-series optical sections were collected with a step-size of 0.7 microns, using the Nikon Ti internal focus motor. Z-series are displayed as maximum z-projections, and gamma, brightness, and contrast were adjusted for each image equally using FiJi software. For the live-cell imaging of cells expressing Golgi-mEGFP, HEK293 RPS3-Keima cells were transiently transfected with CellLight Golgi-GFP (C10592, ThermoFisher Scientific) for 24 hours. Then the cells were further incubated with Torin (150 nM) or the combination of Torin and SAR405 (150 nM, 1 μM, respectively) for 24h before imaging. Confocal images of mEGFP fluorescence were collected using 100 mW 488 nm solid state laser and 525/50 nm emission filter (Chroma Technologies).
Quantitative image analysis
Serial z stack image sections taken with 60× objective lens were combined using maximum intensity projection function in FiJi software. Without any cutting, the original images were processed as follows.
Step 1. Cell segmentation
Hoechst channel showing stained nucleus was processed as follows: 1) back-ground subtraction, 2) auto threshold, make binary, fill holes, dilate, and water shed, 3) connected components labeling using “find connected regions” plug-in to make “marker”. Then the 442ex/620em Keima channel was processed as follows: 1) Gaussian blur, 2) subtract background, 3) auto threshold, make binary, and dilate. Using marker controlled segmentation function in MorphoLibJ plug-in, the two processed image channels were combined to generate “mask”.
Step 2. Track-mate
The 442 ex/620 em and 561 ex/620 em channels were stacked, and Keima puncta co-localized with in 3pixel distance were analyzed using TreackMate function. This step generated a xml file containing co-localization and puncta intensity information of the whole image plain.
Step 3. MatLab coding
Using Matlab software, the xml file was processed in a way that any puncta with 561/448 intensity ratio over 0.5 were assigned to the corresponding cells segmented in Step 1. This resulted in two new images showing segmented cells and numerically assigned puncta in each cell. Colocalization of Lamp1-eGFP, eGFP-LC3, and Lysotracker green with red Keima puncta was performed by FiJi software. Any puncta in the size of 7 pixel and intensity of 7 (arbitrary number) were found in both 488ex/620em and 561ex/620em channels. Among the puncta that passed the intensity and size thresholds, the total puncta number that appeared in both channels within 5pixel distance was divided by the total number of puncta analyzed in 488ex/620em channel image. For the random co-occurrence measurement, the 488ex/561em channel image was shifted 10 μm to a random direction. And the co-localization analysis between the two channels was performed following the same procedure.
Code Availability
The MetLab code used for unbiased image quantitation in this study is available from the corresponding author on reasonable request.
Electron microscopy
HEK293; wt, ATG5−/−, BECN1−/− cells were grown to 60% confluency in 6-cm culture dishes and incubated with HBSS for 4.5h. The cells were then fixed with 1.25% paraformaldehyde, 2.5% glutaraldehyde, 0.03% picric acid followed by osmication and uranyl acetate staining, dehydration in alcohols and embedded in Taab 812 Resin (Marivac Ltd, Nova Scotia, Canada). Sections were cut with Leica ultracut microtome, and picked up on formvar/carbon-coated copper slot grids. Right before the imaging, the grids were stained with 2% uranyl acetate for 5 minutes to increase ribosome contrast, followed by 0.2% lead citrate staining. The samples were imaged under the Phillips Tecnai BioTwin Spirit transmission electron microscope.
Statistics and Reproducibility
All statistical data were calculated using GraphPad Prism 7. Comparisons of data in Figure 4b–d were performed by one-way analysis of variance (ANOVA) with Sidak’s multiple comparisons test. Comparisons of the rest of the data were performed by two-way ANOVA with Tukey’s multiple comparisons test; p-values <0.01 were considered significant. All experiments were repeated at least three times unless otherwise indicated.
Data availability
The source data for statistical analyses of Figure 2b, 2f–h, 3b, 4b, 4d–e, 4g, 4l, 5e–f, and Supplemental Figure 2j, 3a, 5c, and 5h are provided in Supplementary Table 2. All other data supporting the findings of this study are available from the corresponding author on reasonable request.
Supplementary Material
Acknowledgments
This work was supported by NIH grants R37NS083524 and RO1GM095567 to J.W.H. We thank the Nikon Imaging Center and the Imaging and Data Analysis Core (Harvard Medical School) for imaging assistance.
Footnotes
AUTHOR CONTRIBUTIONS
J.W.H. and H.A. conceived the study. H.A. performed all experiments. H.A. and J.W.H. analyzed data and wrote the paper.
References
- 1.Warner JR. The economics of ribosome biosynthesis in yeast. Trends Biochem Sci. 1999;24:437–440. doi: 10.1016/s0968-0004(99)01460-7. [DOI] [PubMed] [Google Scholar]
- 2.Zhang T, Shen S, Qu J, Ghaemmaghami S. Global Analysis of Cellular Protein Flux Quantifies the Selectivity of Basal Autophagy. Cell Rep. 2016;14:2426–2439. doi: 10.1016/j.celrep.2016.02.040. [DOI] [PMC free article] [PubMed] [Google Scholar]
- 3.Shao S, Hegde RS. Target Selection during Protein Quality Control. Trends Biochem Sci. 2016;41:124–137. doi: 10.1016/j.tibs.2015.10.007. [DOI] [PubMed] [Google Scholar]
- 4.Sung MK, Reitsma JM, Sweredoski MJ, Hess S, Deshaies RJ. Ribosomal proteins produced in excess are degraded by the ubiquitin-proteasome system. Mol Biol Cell. 2016;27:2642–2652. doi: 10.1091/mbc.E16-05-0290. [DOI] [PMC free article] [PubMed] [Google Scholar]
- 5.Sung MK, et al. A conserved quality-control pathway that mediates degradation of unassembled ribosomal proteins. Elife. 2016;5 doi: 10.7554/eLife.19105. [DOI] [PMC free article] [PubMed] [Google Scholar]
- 6.Kraft C, Deplazes A, Sohrmann M, Peter M. Mature ribosomes are selectively degraded upon starvation by an autophagy pathway requiring the Ubp3p/Bre5p ubiquitin protease. Nat Cell Biol. 2008;10:602–610. doi: 10.1038/ncb1723. [DOI] [PubMed] [Google Scholar]
- 7.Ossareh-Nazari B, et al. Cdc48 and Ufd3, new partners of the ubiquitin protease Ubp3, are required for ribophagy. EMBO Rep. 2010;11:548–554. doi: 10.1038/embor.2010.74. [DOI] [PMC free article] [PubMed] [Google Scholar]
- 8.Nishida Y, et al. Discovery of Atg5/Atg7-independent alternative macroautophagy. Nature. 2009;461:654–658. doi: 10.1038/nature08455. [DOI] [PubMed] [Google Scholar]
- 9.Tsuboyama K, et al. The ATG conjugation systems are important for degradation of the inner autophagosomal membrane. Science. 2016;354:1036–1041. doi: 10.1126/science.aaf6136. [DOI] [PubMed] [Google Scholar]
- 10.Anderson P, Kedersha N. RNA granules. J Cell Biol. 2006;172:803–808. doi: 10.1083/jcb.200512082. [DOI] [PMC free article] [PubMed] [Google Scholar]
- 11.Santaguida S, Vasile E, White E, Amon A. Aneuploidy-induced cellular stresses limit autophagic degradation. Genes Dev. 2015;29:2010–2021. doi: 10.1101/gad.269118.115. [DOI] [PMC free article] [PubMed] [Google Scholar]
- 12.Galluzzi L, et al. Molecular definitions of autophagy and related processes. EMBO J. 2017;36:1811–1836. doi: 10.15252/embj.201796697. [DOI] [PMC free article] [PubMed] [Google Scholar]
- 13.Anding AL, Baehrecke EH. Cleaning House: Selective Autophagy of Organelles. Dev Cell. 2017;41:10–22. doi: 10.1016/j.devcel.2017.02.016. [DOI] [PMC free article] [PubMed] [Google Scholar]
- 14.Kishi-Itakura C, Koyama-Honda I, Itakura E, Mizushima N. Ultrastructural analysis of autophagosome organization using mammalian autophagy-deficient cells. J Cell Sci. 2014;127:4089–4102. doi: 10.1242/jcs.156034. [DOI] [PubMed] [Google Scholar]
- 15.Katayama H, Kogure T, Mizushima N, Yoshimori T, Miyawaki A. A sensitive and quantitative technique for detecting autophagic events based on lysosomal delivery. Chem Biol. 2011;18:1042–1052. doi: 10.1016/j.chembiol.2011.05.013. [DOI] [PubMed] [Google Scholar]
- 16.Mizushima N, Yoshimori T, Levine B. Methods in mammalian autophagy research. Cell. 2010;140:313–326. doi: 10.1016/j.cell.2010.01.028. [DOI] [PMC free article] [PubMed] [Google Scholar]
- 17.Ni HM, et al. Dissecting the dynamic turnover of GFP-LC3 in the autolysosome. Autophagy. 2011;7:188–204. doi: 10.4161/auto.7.2.14181. [DOI] [PMC free article] [PubMed] [Google Scholar]
- 18.Gross LA, Baird GS, Hoffman RC, Baldridge KK, Tsien RY. The structure of the chromophore within DsRed, a red fluorescent protein from coral. Proc Natl Acad Sci U S A. 2000;97:11990–11995. doi: 10.1073/pnas.97.22.11990. [DOI] [PMC free article] [PubMed] [Google Scholar]
- 19.Chan EY, Kir S, Tooze SA. siRNA screening of the kinome identifies ULK1 as a multidomain modulator of autophagy. J Biol Chem. 2007;282:25464–25474. doi: 10.1074/jbc.M703663200. [DOI] [PubMed] [Google Scholar]
- 20.Hurley JH, Young LN. Mechanisms of Autophagy Initiation. Annu Rev Biochem. 2017 doi: 10.1146/annurev-biochem-061516-044820. [DOI] [PMC free article] [PubMed] [Google Scholar]
- 21.Ktistakis NT, Tooze SA. Digesting the Expanding Mechanisms of Autophagy. Trends Cell Biol. 2016;26:624–635. doi: 10.1016/j.tcb.2016.03.006. [DOI] [PubMed] [Google Scholar]
- 22.Anderson DJ, et al. Targeting the AAA ATPase p97 as an Approach to Treat Cancer through Disruption of Protein Homeostasis. Cancer Cell. 2015;28:653–665. doi: 10.1016/j.ccell.2015.10.002. [DOI] [PMC free article] [PubMed] [Google Scholar]
- 23.Liu J, et al. Beclin1 controls the levels of p53 by regulating the deubiquitination activity of USP10 and USP13. Cell. 2011;147:223–234. doi: 10.1016/j.cell.2011.08.037. [DOI] [PMC free article] [PubMed] [Google Scholar]
- 24.Harper JW, Bennett EJ. Proteome complexity and the forces that drive proteome imbalance. Nature. 2016;537:328–338. doi: 10.1038/nature19947. [DOI] [PMC free article] [PubMed] [Google Scholar]
- 25.Hewitt L, et al. Sustained Mps1 activity is required in mitosis to recruit O-Mad2 to the Mad1-C-Mad2 core complex. J Cell Biol. 2010;190:25–34. doi: 10.1083/jcb.201002133. [DOI] [PMC free article] [PubMed] [Google Scholar]
- 26.Santaguida S, Tighe A, D’Alise AM, Taylor SS, Musacchio A. Dissecting the role of MPS1 in chromosome biorientation and the spindle checkpoint through the small molecule inhibitor reversine. J Cell Biol. 2010;190:73–87. doi: 10.1083/jcb.201001036. [DOI] [PMC free article] [PubMed] [Google Scholar]
- 27.Panas MD, Ivanov P, Anderson P. Mechanistic insights into mammalian stress granule dynamics. J Cell Biol. 2016;215:313–323. doi: 10.1083/jcb.201609081. [DOI] [PMC free article] [PubMed] [Google Scholar]
- 28.Buchan JR, Kolaitis RM, Taylor JP, Parker R. Eukaryotic stress granules are cleared by autophagy and Cdc48/VCP function. Cell. 2013;153:1461–1474. doi: 10.1016/j.cell.2013.05.037. [DOI] [PMC free article] [PubMed] [Google Scholar]
- 29.Ichimura Y, et al. Phosphorylation of p62 activates the Keap1-Nrf2 pathway during selective autophagy. Mol Cell. 2013;51:618–631. doi: 10.1016/j.molcel.2013.08.003. [DOI] [PubMed] [Google Scholar]
- 30.Stolz A, Ernst A, Dikic I. Cargo recognition and trafficking in selective autophagy. Nat Cell Biol. 2014;16:495–501. doi: 10.1038/ncb2979. [DOI] [PubMed] [Google Scholar]
- 31.Higgins R, et al. The Unfolded Protein Response Triggers Site-Specific Regulatory Ubiquitylation of 40S Ribosomal Proteins. Mol Cell. 2015;59:35–49. doi: 10.1016/j.molcel.2015.04.026. [DOI] [PMC free article] [PubMed] [Google Scholar]
- 32.Yoshii SR, Kishi C, Ishihara N, Mizushima N. Parkin mediates proteasome-dependent protein degradation and rupture of the outer mitochondrial membrane. J Biol Chem. 2011;286:19630–19640. doi: 10.1074/jbc.M110.209338. [DOI] [PMC free article] [PubMed] [Google Scholar]
- 33.Ran FA, et al. Genome engineering using the CRISPR-Cas9 system. Nat Protoc. 2013;8:2281–2308. doi: 10.1038/nprot.2013.143. [DOI] [PMC free article] [PubMed] [Google Scholar]
Associated Data
This section collects any data citations, data availability statements, or supplementary materials included in this article.
Supplementary Materials
Data Availability Statement
The source data for statistical analyses of Figure 2b, 2f–h, 3b, 4b, 4d–e, 4g, 4l, 5e–f, and Supplemental Figure 2j, 3a, 5c, and 5h are provided in Supplementary Table 2. All other data supporting the findings of this study are available from the corresponding author on reasonable request.