

Abstract
The analysis of intact proteins via mass spectrometry can offer several benefits to proteome characterization, although the majority of top-down experiments focus on proteoforms in a relatively low mass range (<30 kDa). Recent studies have focused on improving the analysis of larger intact proteins (up to ~75 kDa), but they have also highlighted several challenges to be addressed. One major hurdle is the efficient dissociation of larger protein ions, which often to do not yield extensive fragmentation via conventional tandem MS methods. Here we describe the first application of activated ion electron transfer dissociation (AI-ETD) to proteins in the 30–70 kDa range. AI-ETD leverages infrared photo-activation concurrent to ETD reactions to improve sequence-informative product ion generation. This method generates more product ions and greater sequence coverage than conventional ETD, higher-energy collisional dissociation (HCD), and ETD combined with supplemental HCD activation (EThcD). Importantly, AI-ETD provides the most thorough protein characterization for every precursor ion charge state investigated in this study, making it suitable as a universal fragmentation method in top-down experiments. Additionally, we highlight several acquisition strategies that can benefit characterization of larger proteins with AI-ETD, including combination of spectra from multiple ETD reaction times for a given precursor ion, multiple spectral acquisitions of the same precursor ion, and combination of spectra from two different dissociation methods (e.g., AI-ETD and HCD). In all, AI-ETD shows great promise as a method for dissociating larger intact protein ions as top-down proteomics continues to advance into larger mass ranges.
Keywords: intact proteins, top-down proteomics, electron transfer dissociation, photo-activation
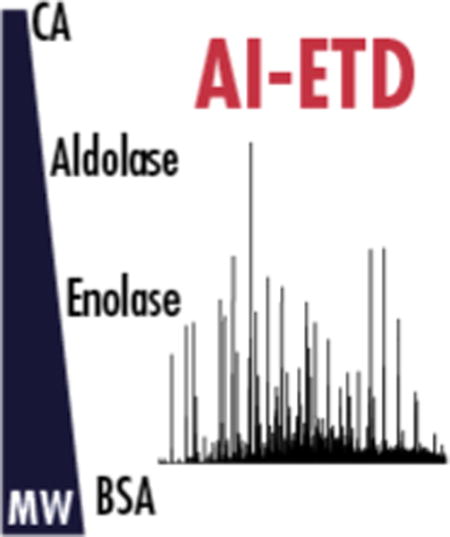
Graphical abstract
INTRODUCTION
Top-down proteomics characterizes intact proteins, aiming to provide information about splice variants, sequence truncations, and post-translational modifications that contribute to biologically significant proteoforms.[1–4] The top-down approach continues to progress with advances in mass spectrometry (MS) and related technologies, but technical challenges have largely limited these experiments to proteins with molecular weights less than ~30 kDa.[5–8] Recent studies have focused on accessing portions of the proteome that span a larger molecular weight range (up to ~75 kDa) with some success,[9–11] emphasizing the need for further development of instrumentation for analysis of larger protein ions, including tandem MS/MS approaches that can effectively dissociate larger protein ions.
Improving fragmentation of intact protein ions has been an active research area for decades. In the first years after electrospray ionization enabled the interrogation of large multiply charged ions, collision activated dissociation (CAD) and infrared multiphoton dissociation (IRMPD) were used to dissociate protein cations ranging from ubiquitin (8.6 kDa) to bovine serum albumin (BSA, ~66 kDa).[12–15] Dissociation of proteins upwards of 200 kDa has also been explored.[16, 17] A limitation to slow-heating dissociation methods like CAD and IRMPD, however, is that they preferentially cleave at labile bonds, which ultimately often fails to produce suitable fragmentation for sequence elucidation. Electron capture dissociation (ECD) and electron transfer dissociation (ETD) were developed as alternatives to the so-called ergodic methods (i.e., CAD and IRMPD), offering more extensive backbone cleavage through electron-driven dissociation.[18–21]
Ideally suited for highly charged cations, ECD and ETD have become indispensable tools for top-down proteomics; that said, both approaches suffer from inefficient precursor-to-product ion conversion for precursors with low charge-density.[22–25] This is largely due to secondary gas-phase structure of low-charge density precursors, where precursor ions adapt compact structures that increase intramolecular non-covalent interactions.[26–29] In such cases, product ions often remain together, due to the non-covalent interactions, preventing generation of sequence-informative product ions. This process is called non-dissociative electron transfer dissociation (ETnoD).[30–32] Several approaches have employed supplemental activation to mitigate this problem, for example, use of higher energy electrons and collisional or photo-activation of precursor and/or product ions.[32–44]
Supplemental activation methods have been extensively explored for ECD with larger proteins;[44–47] fewer studies, however, have explored the effect of supplemental activation for fragmentation of larger proteins with ETD. We recently described activated-ion ETD (AI-ETD), which uses infrared photo-activation concurrent to ETD to increase product ion generation, and demonstrated that it can improve ETD efficiency for both peptide and protein precursor ions.[48–54] With an implementation on a quadrupole-Orbitrap-linear ion trap (q-OT-LIT) hybrid MS system, we have recently shown AI-ETD can provide near-complete sequence coverage of intact proteins in the range of molecular weights that are typically identified in top-down experiments (<25 kDa)[55]. Here we investigate the potential of AI-ETD to dissociate larger protein ions, including carbonic anhydrase (~29 kDa), aldolase (~39.2 kDa), enolase (~46.7 kDa), and BSA (~66.8 kDa). Altogether we demonstrate that AI-ETD generates significantly more sequence-informative product ions and increases overall protein characterization over ETD. The method likewise outperforms higher-energy collisional dissociation (HCD) and ETD with supplemental HCD activation (EThcD). Finally, we illustrate how different acquisition strategies, e.g., utilization of multiple ETD reaction times, can benefit top-down characterization of larger intact proteins with AI-ETD and other dissociation methods.
MATERIALS AND METHODS
Sample Preparation
Carbonic anhydrase from bovine erythrocytes (UniProt Accession P00921 and bovine serum album (BSA) (UniProt Accession P02769) were purchased from Protea Biosciences (Morgantown, WV). Fructose-bisphosphate aldolase A, referred to in this manuscript as aldolase, from rabbit muscle (UniProt Accession P00883), and enolase 1 from baker’s yeast (UniProt Accession P00924) were purchased from Sigma Aldrich (St. Louis, MO). BSA was resuspended in buffer (8 M urea, 50 mM Tris, pH 8), reduced with 5 mM dithiothreitol for 45 minutes at 58 °C, alkylated with 15 mM iodoacetamide for 45 minutes at room temperature in the dark, and desalted using a C2 SepPak (Waters, Milford, MA). All samples were resuspended at ~10 pmol/μL in 50:49.8:0.2 acetonitrile/water/formic acid prior to infusions.
Mass Spectrometry
All experiments were performed on a quadrupole-Orbitrap-linear ion trap hybrid MS system (Orbitrap Fusion Lumos, Thermo Fischer Scientific, San Jose, CA) that had been previously modified to perform AI-ETD.[54] Proteins were infused at 5–10 μL/min using the instrument’s syringe pump, and precursors were ionized using electrospray ionization at 4–5 kV with respect to ground. The inlet capillary was held at 275 °C and the ion funnel rf was held at 30%. All MS/MS scans were conducted at 240,000 resolution with precursor ion targets of 800,000. For ETD, EThcD, and AI-ETD experiments, the reagent anion population was set to 300,000 ions and reaction times varied for each precursor, ranging from 5–40 ms. Normalized collision energies for EThcD ranged from 8–15, laser powers for AI-ETD ranged from 18–36 Watts, and normalized collision energies for HCD ranged from 15–25. For each precursor the optimum dissociation conditions were determined prior to data collection for HCD, ETD, EThcD, and AI-ETD. The number of microscans used was 300 for carbonic anhydrase and aldolase experiments, 400 for enolase experiments, and 500 for BSA experiments.
Data Analysis
MS/MS spectra were deconvoluted with XTRACT (Thermo Fisher Scientific) using default parameters and a S/N threshold of three. Peak lists from XTRACT and protein sequences from UniProt were loaded into ProSight Lite[56] to determine the number of matched fragments generated for each precursor and dissociation method. For combination of spectra, peak lists from each spectrum were concatenated. The “EThcD” fragmentation type, which matched b/y- and c/z-type product ions, was used for ETD, EThcD, and AI-ETD spectra, while “HCD”, which matched b/y-type product ions, was used for HCD spectra. All matches were made within a 10 ppm tolerance. No modifications were used for aldolase or enolase sequences, while carbamidomethylation of cysteines (+57.021 Da) was used for BSA and N-terminal acetylation (+42.01 Da) was used for carbonic anhydrase.
RESULTS AND DISCUSSION
AI-ETD employs infrared photo-activation, concurrent to electron transfer ion/ion reactions, to disrupt intramolecular non-covalent interactions in precursor ions and, thereby, improve ETD reaction efficiency. The approach consistently leads to an increased number of sequence-informative product ions and to greater backbone sequence coverage of precursor proteins. To test how AI-ETD can improve ETD fragmentation of large, highly charged protein ions, we dissociated several precursor ion charge states of four protein standards that span a molecular weight range of approximately 30–70 kDa.
For carbonic anhydrase, six precursor ion charge states across the charge state envelope were selected for fragmentation with HCD, ETD, EThcD, and AI-ETD (Figure 1a). Of the four dissociation methods, AI-ETD generated the greatest sequence coverage for all six precursor ions (nearly 70%), while none of the other dissociation methods achieved 60% coverage (Figure 1b). Interestingly, AI-ETD improved data quality (i.e., sequence coverage, product ion count, and product ion signal) over ETD for all precursor ion charge states whereas ETD outperformed the other supplemental activation approach, EThcD, for the highest charge states (z = 30–36). EThcD performance over ETD for the low charge states (z = 21–27) reflects similar results from a previous EThcD study of a 17.5 kDa protein.[43] All three ETD-based dissociation methods substantially outperform HCD for all six precursors, matching previous comparisons.[57]
Figure 1. Activated-Ion ETD (AI-ETD) provides the best characterization of carbonic anhydrase, 29 kDa. a).
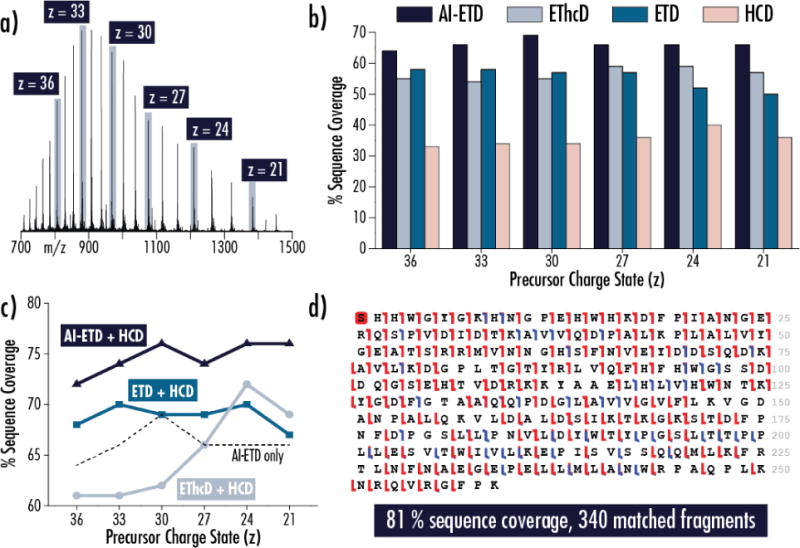
Precursor ions of carbonic anhydrase in six charge states were individually selected for fragmentation with HCD, ETD, EThcD, and AI-ETD. b) AI-ETD consistently provides the highest sequence coverage for each of the precursor charge states investigated and is the only method to provide >60% coverage, which it does for all six conditions. c) Combining fragments from the electron-driven methods with fragments from HCD improves coverage for all charge states. The combination of AI-ETD and HCD is superior to the others, and some combinations of ETD/EThcD with HCD fail to outperform AI-ETD by itself. d) Combining the best AI-ETD and HCD results, regardless of charge state, provides 81% sequence coverage of carbonic anhydrase. Here, the combination of AI-ETD of z = 30 and HCD of z = 24 is shown. Red hashes denote c/z●-type ions, blue hashes represent b/y-type ions, and the red box at the N-terminal serine indicates acetylation.
Collisional-based and electron-driven dissociation methods offer complementary fragmentation information and are often combined (following separate MS/MS events) in top-down proteomic experiments for improved identification. Figure 1c illustrates how combining HCD MS/MS results with those from either AI-ETD, EThcD, or ETD MS/MS improves characterization for each of the six carbonic anhydrase precursor ions. The combination of AI-ETD and HCD provides the greatest coverage for each precursor, with a boost of approximately 8–10% coverage over AI-ETD alone (indicated by the dashed line). Note, AI-ETD alone also provides nearly as much, if not more, sequence coverage as the combination of HCD with ETD or EThcD. When combining the best result from AI-ETD (z = 30, 69% coverage) with the best result from HCD (z = 24, 40% coverage), the total sequence coverage achieved for carbonic anhydrase is 81% with 340 total matched fragments (b-, y-, c-, and z●-type), underscoring the known benefits of complementary dissociation methods (Figure 1d). By comparison, a previous study looking at the combination of multiple MS/MS acquisitions for carbonic anhydrase characterization showed that combining 5 different fragmentation conditions (including ECD, plasma ECD, and collisional activation prior to ECD, and modulation of inlet capillary temperature) can provide 77% sequence coverage.[33]
Figure 2 compares ETD and AI-ETD spectra for the z = 21 charge state of carbonic anhydrase, highlighting the improved precursor-to-product ion generation afforded by AI-ETD that contributes to increased sequence coverage. AI-ETD generates 217 sequence-informative product ions to ETD’s 150 product ions, resulting in an increase of 16% sequence coverage (i.e., 66% vs. 50%). The improved dissociation efficiency of AI-ETD is also apparent in the percent of total ion current (TIC) that remains in precursor ion channels, where ETD has nearly triple the amount of signal than AI-ETD in these non-informative channels (largely in charge-reduced ETnoD products). This corresponds to more than double the signal in sequence-informative product ion channels in the AI-ETD spectrum compared to ETD. Beyond simply decreasing ETnoD, AI-ETD increases product ion signal-to-noise, making successful deconvolution more likely and, thus, increasing the signal that can be leveraged for sequence elucidation.
Figure 2. Comparing ETD and AI-ETD spectra of the z = 21 precursor of carbonic anhydrase.
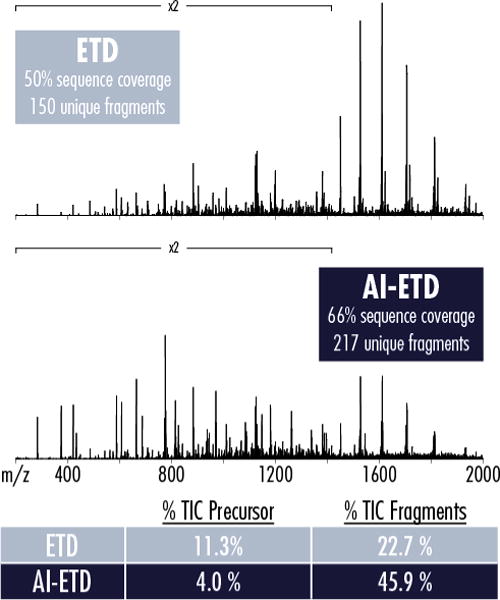
AI-ETD more than doubles the signal comprising sequencing fragments while reducing the signal (i.e., percent of total ion current, TIC) remaining in unreacted and charge-reduced precursor channels by nearly three-fold. The spectra are on the same intensity scale, making the increased product ion signal and the decreased charge-reduced precursor ion signal (large peaks from ~1400–2000 m/z) apparent.
Importantly, AI-ETD also does not significantly alter the distribution of product ion types generated from ETD. Figure 3 shows the product ion type distribution for the different dissociation methods both by count and by total intensity for the z = +30 (panel a) and z = +21 (panel b) precursor ion charge states of carbonic anhydrase. In both cases, AI-ETD increases the number of c- and z●-type ions over ETD while maintaining similarly low amounts of b- and y-type fragments. This is in contrast to EThcD, where c- and z●-type fragment counts are slightly lower than ETD in favor of boosts in b- and y-type ions. The gains in number of fragment ions over ETD is concomitant with increased signal in product ion channels for AI-ETD, while this is not necessarily the case with EThcD. This is likely because the beam-type collisional supplemental activation of EThcD necessitates a moderately energetic transfer of ions into a collision cell that can cause some product ion signal to be lost. Conversely, the vibrational activation via infrared photons used in AI-ETD is concurrent with ETD reactions and requires no additional shuttling of product ions into a different reaction cell. The changes (or lack thereof) in product ion distribution and intensities match previous studies on smaller peptides and proteins.[43, 54, 55] Note the data in Figure 3b further expands on the observations from Figure 2, as they are from the same precursor ion. It is also interesting to note that the y-axes scales for the count of fragment ion graphs (left graphs) is the same for Figure 3a and b, showing that AI-ETD maintains elevated product ion generation even as precursor ion charge state decreases. The capability of AI-ETD to increase generation of ETD-specific c- and z●-type in both number and intensity while minimizing other fragment ion types is especially important for dissociation of intact proteins, where available signal can be diluted amongst the many potential product ion pathways possible from the hundreds of inter-residue bonds of the molecules.[58]
Figure 3. Distributions of count and intensity of product ion types for two precursor ion charge states of carbonic anhydrase.
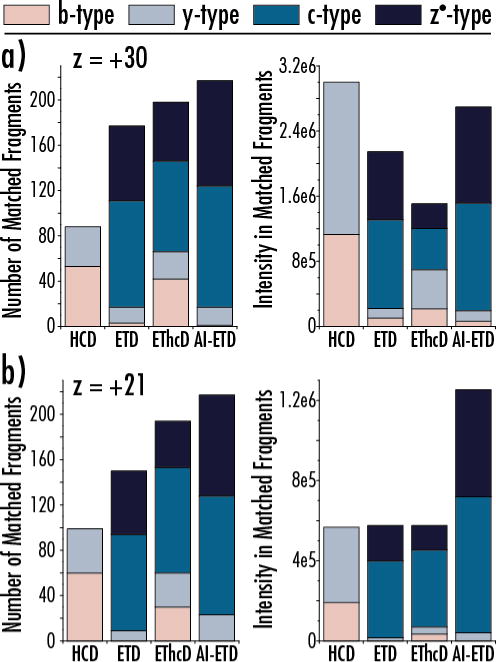
The number and intensity of b-, y-, c-, and z●-type product ions are shown for the z = +30 (a) and z = +21 (b) precursor ion charge states of carbonic anhydrase. AI-ETD preserves similar product ion distributions to ETD (mainly c- and z●-type) while significantly increasing the generation sequence-informative product ions.
Recent success of ultraviolet photodissociation (UVPD) for characterization of intact proteins makes for a natural comparison with AI-ETD. UVPD generates extensive fragmentation of peptide and protein cations, including six main fragment ion types (a-, b-, c-, x-, y-, and z-type) in addition to Y-, w-, v-, and d-ions. Although we do not have the ability to generate UVPD data in-house, three recent studies have investigated the performance of UVPD for carbonic anhydrase.[57, 59, 60] Impressively, the first description of UVPD for intact protein analysis provided 87% sequence coverage of carbonic anhydrase, the greatest sequence coverage to be reported for a protein of that size from a single acquisition.[57] More recent studies, however, have shown that UVPD can consistently provide 60–70% sequence coverage,[59, 60] making it comparable with the coverage AI-ETD can generate. Supplemental Figure 1 shows sequence coverage and product ion distributions from UVPD of carbonic anhydrase precursor ions compared to AI-ETD for the z = +30 charge state. Although no direct comparison can be made between AI-ETD and UVPD here, looking at UVPD performance across a range of precursor charge states from several studies helps provide a composite picture of the performance of the two methods. Note, differences in AGC targets, instrument platforms, and other experimental parameters make comparisons of product ion signal, etc. less than straight-forward, but differences in product ion types are still interesting to compare. Product ion signal is spread amongst six main product ion channels in UVPD, whereas the major of AI-ETD product ions are c- and z●-type. Both methods offer benefits; AI-ETD keeps product ion signal in relatively few channels, avoiding dilution of signal amongst many dissociation pathways as mentioned above, while the multiple fragment ion types in rich UVPD spectra can provide high confidence in sequence assignment (i.e., multiple product ions can confirm each residue). Note, UVPD data from these three studies includes both automated and manual annotation of product ions, including a, a+1, b, c, x, x+1, y, y−1, Y, and z types. AI-ETD data is only from automated annotation of b-, c-, y-, and z-type ions by ProSight Lite, meaning AI-ETD results could slightly improve with further manual annotation to include off-by-one errors. To the best of our knowledge, no UVPD data is available for comparison to proteins larger than carbonic anhydrase, outside of protein complexes, which are clearly not a direct comparison. Regardless, AI-ETD and UVPD appear to provide similar amounts of protein sequence coverage for proteins as large as 30 kDa, which supports results from smaller intact proteins as well.[55]
AI-ETD sustains this improved sequence characterization as protein molecular weight increases, and we explored how to improve sequence coverage by using multiple acquisitions of the same precursor with the same dissociation method. Rather than combine spectra from two complementary dissociation methods, we collected three separate raw files for each precursor with each dissociation method. Each data file was deconvoluted individually to get product ions, and product ions from each acquisition were combined. Figure 4a shows the average percent sequence coverage obtained from triplicate acquisitions of HCD, ETD, EThcD, and AI-ETD MS/MS scans for the z = 30 precursor ion of the 39.2 kDa protein aldolase (light blue bars, with error bars showing one standard deviation) and total coverage achieved when combining the three spectra from each dissociation method (dark blue circles). The corresponding average number of matched fragments is shown in Figure 4b. For each of the four methods, the combination of three replicate spectra results in ~15–20 percent increase in coverage over the average obtained for the individual spectra, e.g., 46% vs. 40% for AI-ETD. Again, all electron-driven dissociation methods outperform HCD, and AI-ETD provides the greatest average sequence coverage, largest average number of matched fragments, and greatest combined coverage amongst the four methods. Indeed, the results from a single AI-ETD acquisition are approximately equivalent to or more than the sequence coverage from three combined spectra of HCD, ETD, and EThcD. In total, 57% of aldolase’s 362 backbone bonds could be explained when combining AI-ETD and HCD data.
Figure 4. Averaging replicate experiments improves sequence coverage of aldolase (39.2 kDa) for all dissociation methods. a).
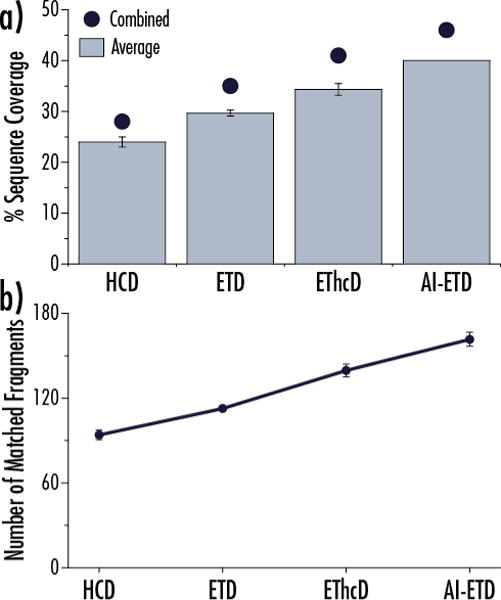
Performing triplicate analyses on the same precursor (z = 30) improves the percent sequence coverage achieved with each of the four dissociation methods. AI-ETD provides the greatest characterization per analysis (40%) and also the greatest total sequence coverage from combined triplicate MS/MS acquisitions (46%). Error bars show one standard deviation. b) The average number of matched fragments generated from the triplicate analyses in panel (a) is plotted for each dissociation method with error bars showing one standard deviation. AI-ETD consistently produces the greatest number of sequence-informative fragments.
AI-ETD provided the best data for all four precursors of enolase (46.7 kDa), with each being interrogated with two different reaction conditions per dissociation method. In other words, separate spectra that used either a relatively short and relatively long ion-ion reaction time were collected for ETD, EThcD, and AI-ETD, and a relatively low and high normalized collision energy were used for HCD. The reaction times and collision energies used varied for each charge state, but the same two ion-ion reaction times were used for ETD, EThcD, and AI-ETD fragmentation of a given precursor ion charge state. Figure 5a displays the outcome of these experiments, showing the sequence coverage resulting from the short reaction time (or low HCD collision energy) in light blue bars and the long reaction time (or high collision energy) in dark blue bars. The gray lines above each pair shows the total sequence when combining the spectra from the two conditions for each fragmentation method. Note, the full MS1 spectrum of enolase (in addition to aldolase and BSA) is provided in Supplemental Figure 2, showing the charge state envelope and the precursor ion charge states selected for dissociation in these experiments.
Figure 5. Enolase (46.7 kDa) is best characterized by AI-ETD. a).
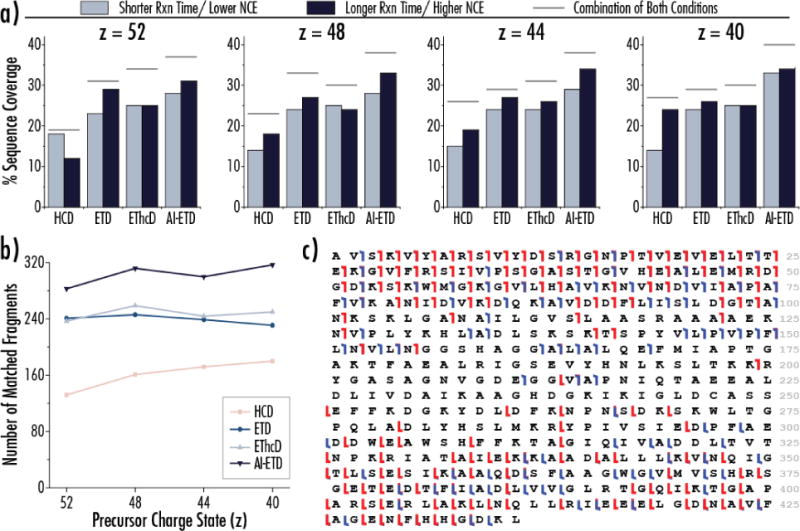
Four precursor ion charge states of enolase were fragmented with HCD, ETD, EThcD, and AI-ETD, with each having two conditions. For ETD, EThcD, and AI-ETD, this included a short and long reaction time, whereas this meant two different normalized collision energies for HCD. Data from short reaction times/lower collision energies (light blue) and long reaction times/higher collision energies (dark blue) are shown by side for each condition, and the coverage achieved from the combination of fragments from both conditions is shown by the grey bar above each pair. For most cases, the long reaction time of AI-ETD outperformed or matched performance of the combination of conditions of the other methods. b) The number of sequencing ions (matched fragments) achieved by the combination of the two reaction times/collision energies is shown for each charge state. c) The combination of AI-ETD and HCD data from the z = 40 charge state provides 54% coverage of enolase, shown by this sequence coverage map. Red denotes c/z●-type ions and blue represents b/y-type ions.
Several interesting trends arise from these data, perhaps most strikingly that AI-ETD at the longer reaction time (i.e., a single condition) generated more sequence coverage than the combination of two reaction conditions of HCD, ETD, and EThcD for all precursors except z = 52 (where it still provided the greatest combined coverage). The benefit of slightly longer reaction times have been previously reported for the high capacity ETD accumulation scheme, which may explain why longer reaction times generally provided the better data.[58] Also, the diminishing benefit of EThcD over ETD is juxtaposed with the consistent boost in performance with AI-ETD. Figure 5b provides the total number of matched fragments from the combined reaction conditions for each precursor. As expected, HCD performance increased from high to low charge states, ETD performance decreased from high to low charge states, and AI-ETD provided consistent performance for all four precursors. Figure 5c displays a sequence coverage map for enolase for the combination of AI-ETD and HCD data from the z = 40 precursor for 54% coverage of the 46.7 kDa protein.
Figure 6 compares ETD and AI-ETD dissociation of z = 60 (panel a) and z = 70 (panel b) of BSA, which has a molecular weight of ~66.8 kDa after reduction of its disulfide bonds and carbamidomethylation of its cysteines. Ten different ion-ion reaction times ranging from 4 ms to 40 ms were used for both ETD and AI-ETD for each of the precursor ions. Characterization generally improved with increasing reaction time although longer times provided diminishing returns, especially for ETD. When combining fragments from all ten acquisitions, each condition contributed unique sequence-informative ions, indicating the different reaction times can access somewhat different information (similar to the trends seen with enolase). More importantly, AI-ETD provided a boost in sequence coverage over ETD for each measurement, especially at longer reaction times, and provided the best results when combining data from all conditions for either precursor. Although this trend follows that of the other protein data in this work, it was not necessarily an expected outcome when considering the high charge states of the precursor ions. When combining data from both charge states, which is another strategy often employed when characterizing larger intact proteins, AI-ETD generates 25% sequence coverage to ETD’s 19% (Figure 6c). Note, a summary of results and methods for achieving the best coverage of all four protein standards in this study is available in Supplemental Table 1.
Figure 6. Benchmarking ETD and AI-ETD for characterization of bovine serum albumin (BSA, 66.8 kDa).
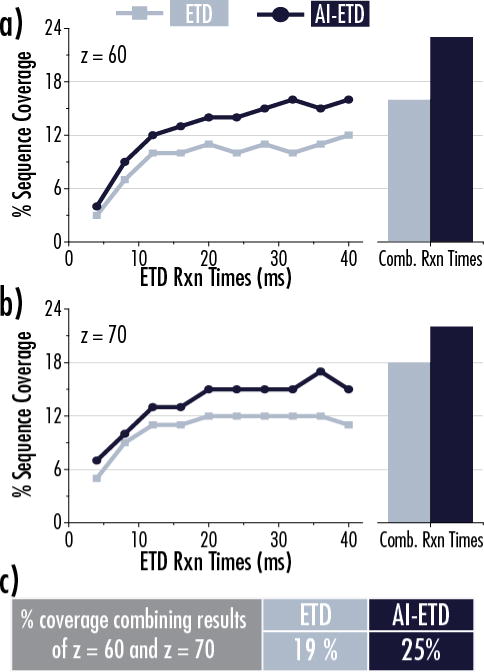
Reaction time ramps were performed from in intervals of 4 ms from 4 ms to 40 ms for a total of 10 difference reaction times for both the z = 60 (a) and z = 70 (b) charge states of BSA. The line graphs show the sequence coverage obtained from individual reaction times for both ETD (light blue) and AI-ETD (dark blue), while the bar charts show data from all 10 reaction times combined. Part (c) shows that AI-ETD can achieve 25% coverage of BSA when combing data from all reaction times of z = 60 and z = 70 charge states. ETD fails to reach 20% coverage when combining data from both charge states, which is less than the coverage achieved by AI-ETD for a single charge state.
CONCLUSIONS
This work describes the first application of AI-ETD to larger protein precursor ions (30–70 kDa), a molecular weight range where an analysis technology gap still exists. We show that AI-ETD provided the greatest sequence coverage over HCD, ETD, and EThcD for a variety of precursor ion charge states spanning the m/z range for carbonic anhydrase, aldolase, enolase, and bovine serum albumin (BSA). AI-ETD not only improved performance over ETD for low-charge density precursor ions, but it also maintained boosted performance for the higher charge states of each protein. This was not the trend for the other supplemental activation method explored in this work, EThcD, which proved useful for low charge states of the smaller proteins but did not greatly increase coverage for higher charge states. Beyond comparing dissociation methods, we also demonstrated how different data acquisition strategies to combine spectra can affect larger protein ion characterization with AI-ETD in concert with other fragmentation methods. Overall, AI-ETD produced the most robust and consistent fragmentation for all precursor ions investigated here, demonstrating its suitability as a universal fragmentation method for top-down proteomics, both less than and greater than 30 kDa. Furthermore, this work highlights the established value of ETD in general for the characterization of intact protein ions, as it outperforms HCD in nearly all instances.
Unsurprisingly, the gains in sequence coverage and overall protein characterization diminished as protein size increased. Several factors contribute to this, including challenges in controlling ion-ion reactions for very highly charge precursor ions to preserve highly charged fragments and in successfully deconvoluting congested spectra that arise from dissociation of large biomolecules. Several groups have described the use of proton transfer reactions, ion parking, and combinations thereof to address these challenges and improve the characterization of intact protein ions,[60–63] and we foresee AI-ETD being a powerful addition to these approaches. This can be especially valuable for dissociation of intact antibodies (~150 kDa), where ETD has been critical for top-down characterization, but sequence coverages remain moderate and success requires extensive spectral averaging in addition to analyses of several charge states.[47, 64, 65] A recent study discussed the benefits of EThcD for improved intact antibody fragmentation,[66] leading us to suppose that AI-ETD could provide even larger boosts. Finally, as the newest instrumentation extends the mass range at which tandem MS can be effectively performed,[67] AI-ETD is well-suited to be a useful platform for dissociating larger proteins and potentially protein complexes,[68] offering more extensive information than can be generated by other dissociation methods. In all, AI-ETD provides an exciting avenue forward as top-down proteomics continues to expand investigations to proteins with larger and larger molecular weights.
Supplementary Material
Supplemental Table 1. Summary of best sequence coverage achieved for each protein and the method that yield that result.
Supplemental Figure 1. Comparing AI-ETD with UVPD for carbonic anhydrase.
Supplemental Figure 2. Precursor ion charge state distributions in MS1 spectra.
Acknowledgments
The authors gratefully acknowledge support from Thermo Fisher Scientific and NIH grants R35 GM118110 and R21 GM118341 (to J.J.C.). N.M.R. was funded through an NIH Predoctoral to Postdoctoral Transition Award (F99 CA212454). Thank you to John Syka, Chris Mullen, Will McGee, and Jim Stephenson for helpful discussions.
Footnotes
SUPPORTING INFORMATION
Supplemental Material, including Supplemental Table 1 describing summary data for these experiments and Supplemental Figure 1 showing precursor ion charge states for proteins investigated, is available with this manuscript.
References
- 1.Catherman AD, Skinner OS, Kelleher NL. Top Down proteomics: Facts and perspectives. Biochem Biophys Res Commun. 2014;445:683–693. doi: 10.1016/j.bbrc.2014.02.041. [DOI] [PMC free article] [PubMed] [Google Scholar]
- 2.Toby TK, Fornelli L, Kelleher NL. Progress in Top-Down Proteomics and the Analysis of Proteoforms. Annu Rev Anal Chem. 2016;9:499–519. doi: 10.1146/annurev-anchem-071015-041550. [DOI] [PMC free article] [PubMed] [Google Scholar]
- 3.Smith LM, Kelleher NL. Proteoform: a single term describing protein complexity. Nat Methods. 2013;10:186–7. doi: 10.1038/nmeth.2369. [DOI] [PMC free article] [PubMed] [Google Scholar]
- 4.Gregorich ZR, Ge Y. Top-down proteomics in health and disease: Challenges and opportunities. 2014 doi: 10.1002/pmic.201300432. http://doi.wiley.com/10.1002/pmic.201300432. [DOI] [PMC free article] [PubMed]
- 5.Catherman AD, Durbin KR, Ahlf DR, Early BP, Fellers RT, Tran JC, Thomas PM, Kelleher NL. Large-scale top-down proteomics of the human proteome: membrane proteins, mitochondria, and senescence. Mol Cell Proteomics. 2013;12:3465–73. doi: 10.1074/mcp.M113.030114. [DOI] [PMC free article] [PubMed] [Google Scholar]
- 6.Tran JC, Zamdborg L, Ahlf DR, Lee JE, Catherman AD, Durbin KR, Tipton JD, Vellaichamy A, Kellie JF, Li M, Wu C, Sweet SMM, Early BP, Siuti N, LeDuc RD, Compton PD, Thomas PM, Kelleher NL. Mapping intact protein isoforms in discovery mode using top-down proteomics. Nature. 2011;480:254–8. doi: 10.1038/nature10575. [DOI] [PMC free article] [PubMed] [Google Scholar]
- 7.Ahlf DR, Compton PD, Tran JC, Early BP, Thomas PM, Kelleher NL. Evaluation of the compact high-field orbitrap for top-down proteomics of human cells. J Proteome Res. 2012;11:4308–14. doi: 10.1021/pr3004216. [DOI] [PMC free article] [PubMed] [Google Scholar]
- 8.Compton PD, Zamdborg L, Thomas PM, Kelleher NL. On the scalability and requirements of whole protein mass spectrometry. Anal Chem. 2011;83:6868–74. doi: 10.1021/ac2010795. [DOI] [PMC free article] [PubMed] [Google Scholar]
- 9.Fornelli L, Parra J, Hartmer R, Stoermer C, Lubeck M, Tsybin YO. Top-down analysis of 30–80 kDa proteins by electron transfer dissociation time-of-flight mass spectrometry. Anal Bioanal Chem. 2013;405:8505–14. doi: 10.1007/s00216-013-7267-5. [DOI] [PubMed] [Google Scholar]
- 10.Li Y, Compton PD, Tran JC, Ntai I, Kelleher NL. Optimizing capillary electrophoresis for top-down proteomics of 30–80 kDa proteins. Proteomics. 2014;14:1158–64. doi: 10.1002/pmic.201300381. [DOI] [PMC free article] [PubMed] [Google Scholar]
- 11.Fornelli L, Durbin KR, Fellers RT, Early BP, Greer JB, LeDuc RD, Compton PD, Kelleher NL. Advancing Top-down Analysis of the Human Proteome Using a Benchtop Quadrupole-Orbitrap Mass Spectrometer. J Proteome Res. 2017;16:609–618. doi: 10.1021/acs.jproteome.6b00698. [DOI] [PMC free article] [PubMed] [Google Scholar]
- 12.Loo JA, Edmonds CG, Smith RD. Tandem mass spectrometry of very large molecules: serum albumin sequence information from multiply charged ions formed by electrospray ionization. Anal Chem. 1991;63:2488–2499. doi: 10.1021/ac00021a018. [DOI] [PubMed] [Google Scholar]
- 13.Speir JP, Senko MW, Little DP, Loo JA, McLafferty FW. High-resolution tandem mass spectra of 37–67 kDa proteins. J Mass Spectrom. 1995;30:39–42. [Google Scholar]
- 14.Little DP, Speir JP, Senko MW, O’Connor PB, McLafferty FW. Infrared multiphoton dissociation of large multiply charged ions for biomolecule sequencing. Anal Chem. 1994;66:2809–15. doi: 10.1021/ac00090a004. [DOI] [PubMed] [Google Scholar]
- 15.Kelleher NL, Taylor SV, Grannis D, Kinsland C, Chiu HJ, Begley TP, McLafferty FW. Efficient sequence analysis of the six gene products (7–74 kDa) from the Escherichia coli thiamin biosynthetic operon by tandem high-resolution mass spectrometry. Protein Sci. 1998;7:1796–801. doi: 10.1002/pro.5560070815. [DOI] [PMC free article] [PubMed] [Google Scholar]
- 16.Han X, Jin M, Breuker K, McLafferty FW. Extending top-down mass spectrometry to proteins with masses greater than 200 kilodaltons. Science. 2006;314:109–12. doi: 10.1126/science.1128868. [DOI] [PubMed] [Google Scholar]
- 17.Zhal H, Han X, Breuker K, McLafferty FW. Consecutive ion activation for top down mass spectrometry: Improved protein sequencing by nozzle-skimmer dissociation. Anal Chem. 2005;77:5777–5784. doi: 10.1021/ac0580215. [DOI] [PubMed] [Google Scholar]
- 18.Zubarev R, Kelleher NL, McLafferty FW. Electron capture dissociation of multiply charged protein cations. A nonergodic process. J Am Chem Soc. 1998;120:3265–3266. [Google Scholar]
- 19.Zubarev RA, Horn DM, Fridriksson EK, Kelleher NL, Kruger NA, Lewis MA, Carpenter BK, McLafferty FW. Electron Capture Dissociation for Structural Characterization of Multiply Charged Protein Cations. Anal Chem. 2000;72:563–573. doi: 10.1021/ac990811p. [DOI] [PubMed] [Google Scholar]
- 20.Syka JEP, Coon JJ, Schroeder MJ, Shabanowitz J, Hunt DF. Peptide and protein sequence analysis by electron transfer dissociation mass spectrometry. Proc Natl Acad Sci U S A. 2004;101:9528–9533. doi: 10.1073/pnas.0402700101. [DOI] [PMC free article] [PubMed] [Google Scholar]
- 21.Coon JJ, Ueberheide B, Syka JEP, Dryhurst DD, Ausio J, Shabanowitz J, Hunt DF. Protein identification using sequential ion/ion reactions and tandem mass spectrometry. Proc Natl Acad Sci U S A. 2005;102:9463–8. doi: 10.1073/pnas.0503189102. [DOI] [PMC free article] [PubMed] [Google Scholar]
- 22.Zubarev RA. Electron-capture dissociation tandem mass spectrometry. Curr Opin Biotechnol. 2004;15:12–6. doi: 10.1016/j.copbio.2003.12.002. [DOI] [PubMed] [Google Scholar]
- 23.Good DM, Wirtala M, McAlister GC, Coon JJ. Performance characteristics of electron transfer dissociation mass spectrometry. Mol Cell Proteomics. 2007;6:1942–51. doi: 10.1074/mcp.M700073-MCP200. [DOI] [PubMed] [Google Scholar]
- 24.Coon JJ. Collisions or electrons? Protein sequence analysis in the 21st century. Anal Chem. 2009;81:3208–15. doi: 10.1021/ac802330b. [DOI] [PMC free article] [PubMed] [Google Scholar]
- 25.Brodbelt JS. Ion Activation Methods for Peptides and Proteins. Anal Chem. 2016;88:30–51. doi: 10.1021/acs.analchem.5b04563. [DOI] [PMC free article] [PubMed] [Google Scholar]
- 26.Clemmer DE, Hudgins RR, Jarrold MF. Naked Protein Conformations: Cytochrome c in the Gas Phase. J Am Chem Soc. 1995;117:10141–10142. [Google Scholar]
- 27.Breuker K, Oh H, Horn DM, Cerda BA, McLafferty FW. Detailed Unfolding and Folding of Gaseous Ubiquitin Ions Characterized by Electron Capture Dissociation. J Am Chem Soc. 2002;124:6407–6420. doi: 10.1021/ja012267j. [DOI] [PubMed] [Google Scholar]
- 28.Lermyte F, Williams JP, Brown JM, Martin EM, Sobott F. Extensive Charge Reduction and Dissociation of Intact Protein Complexes Following Electron Transfer on a Quadrupole-Ion Mobility-Time-of-Flight MS. J Am Soc Mass Spectrom. 2015;26:1068–1076. doi: 10.1007/s13361-015-1124-z. [DOI] [PubMed] [Google Scholar]
- 29.Laszlo KJ, Munger EB, Bush MF. Folding of Protein Ions in the Gas Phase after Cation-to-Anion Proton-Transfer Reactions. J Am Chem Soc. 2016;138:9581–9588. doi: 10.1021/jacs.6b04282. [DOI] [PMC free article] [PubMed] [Google Scholar]
- 30.Pitteri SJ, Chrisman PA, McLuckey SA. Electron-transfer ion/ion reactions of doubly protonated peptides: effect of elevated bath gas temperature. Anal Chem. 2005;77:5662–9. doi: 10.1021/ac050666h. [DOI] [PMC free article] [PubMed] [Google Scholar]
- 31.Liu J, McLuckey SA. Electron transfer dissociation: Effects of cation charge state on product partitioning in ion/ion electron transfer to multiply protonated polypeptides. Int J Mass Spectrom. 2012;330:174–181. doi: 10.1016/j.ijms.2012.07.013. [DOI] [PMC free article] [PubMed] [Google Scholar]
- 32.Xia Y, Han H, McLuckey SA. Activation of intact electron-transfer products of polypeptides and proteins in cation transmission mode ion/ion reactions. Anal Chem. 2008;80:1111–7. doi: 10.1021/ac702188q. [DOI] [PubMed] [Google Scholar]
- 33.Sze SK, Ge Y, Oh H, McLafferty FW. Top-down mass spectrometry of a 29-kDa protein for characterization of any posttranslational modification to within one residue. Proc Natl Acad Sci U S A. 2002;99:1774–9. doi: 10.1073/pnas.251691898. [DOI] [PMC free article] [PubMed] [Google Scholar]
- 34.Sze SK, Ge Y, McLafferty FW. Plasma Electron Capture Dissociation for the Characterization of Large Proteins by Top Down Mass Spectrometry. Anal Chem. 2003;75:1599–1603. doi: 10.1021/ac020446t. [DOI] [PubMed] [Google Scholar]
- 35.Håkansson K, Chalmers MJ, Quinn JP, McFarland MA, Hendrickson CL, Marshall AG. Combined Electron Capture and Infrared Multiphoton Dissociation for Multistage MS/MS in a Fourier Transform Ion Cyclotron Resonance Mass Spectrometer. Anal Chem. 2003;75:3256–3262. doi: 10.1021/ac030015q. [DOI] [PubMed] [Google Scholar]
- 36.Oh H, McLafferty FW. A Variety of Activation Methods Employed in “Activated-Ion” Electron Capture Dissociation Mass Spectrometry: A Test against Bovine Ubiquitin 7+ Ions. Bull Korean Chem Soc. 2006:389–394. [Google Scholar]
- 37.Zabrouskov V, Whitelegge JP. Increased coverage in the transmembrane domain with activated-ion electron capture dissociation for top-down Fourier-transform mass spectrometry of integral membrane proteins. J Proteome Res. 2007;6:2205–10. doi: 10.1021/pr0607031. [DOI] [PubMed] [Google Scholar]
- 38.Swaney DL, McAlister GC, Wirtala M, Schwartz JC, Syka JE, Coon JJ. Supplemental activation method for high-efficiency electron-transfer dissociation of doubly protonated peptide precursors. Anal Chem. 2007;79:477–485. doi: 10.1021/ac061457f. [DOI] [PMC free article] [PubMed] [Google Scholar]
- 39.Mikhailov VA, Cooper HJ. Activated Ion Electron Capture Dissociation (AI ECD) of proteins: synchronization of infrared and electron irradiation with ion magnetron motion. J Am Soc Mass Spectrom. 2009;20:763–71. doi: 10.1016/j.jasms.2008.12.015. [DOI] [PMC free article] [PubMed] [Google Scholar]
- 40.Frese CK, Altelaar AFM, van den Toorn H, Nolting D, Griep-Raming J, Heck AJR, Mohammed S. Toward full peptide sequence coverage by dual fragmentation combining electron-transfer and higher-energy collision dissociation tandem mass spectrometry. Anal Chem. 2012;84:9668–73. doi: 10.1021/ac3025366. [DOI] [PubMed] [Google Scholar]
- 41.Bourgoin-Voillard S, Leymarie N, Costello CE. Top-down tandem mass spectrometry on RNase A and B using a Qh/FT-ICR hybrid mass spectrometer. Proteomics. 2014;14:1174–84. doi: 10.1002/pmic.201300433. [DOI] [PMC free article] [PubMed] [Google Scholar]
- 42.Cannon JR, Holden DD, Brodbelt JS. Hybridizing ultraviolet photodissociation with electron transfer dissociation for intact protein characterization. Anal Chem. 2014;86:10970–7. doi: 10.1021/ac5036082. [DOI] [PMC free article] [PubMed] [Google Scholar]
- 43.Brunner AM, Lossl P, Liu F, Huguet R, Mullen C, Yamashita M, Zabrouskov V, Makarov A, Altelaar AFM, Heck AJR. Benchmarking multiple fragmentation methods on an Orbitrap Fusion for top-down phospho-proteoform characterization. Anal Chem. 2015;87:4152–4158. doi: 10.1021/acs.analchem.5b00162. [DOI] [PubMed] [Google Scholar]
- 44.Horn DM, Ge Y, McLafferty FW. Activated ion electron capture dissociation for mass spectral sequencing of larger (42 kDa) proteins. Anal Chem. 2000;72:4778–84. doi: 10.1021/ac000494i. [DOI] [PubMed] [Google Scholar]
- 45.Ge Y, Lawhorn BG, ElNaggar M, Strauss E, Park JH, Begley TP, McLafferty FW. Top Down Characterization of Larger Proteins (45 kDa) by Electron Capture Dissociation Mass Spectrometry. J Am Chem Soc. 2002;124:672–678. doi: 10.1021/ja011335z. [DOI] [PubMed] [Google Scholar]
- 46.Ge Y, Rybakova IN, Xu Q, Moss RL. Top-down high-resolution mass spectrometry of cardiac myosin binding protein C revealed that truncation alters protein phosphorylation state. Proc Natl Acad Sci. 2009;106:12658–12663. doi: 10.1073/pnas.0813369106. [DOI] [PMC free article] [PubMed] [Google Scholar]
- 47.Mao Y, Valeja SG, Rouse JC, Hendrickson CL, Marshall AG. Top-Down Structural Analysis of an Intact Monoclonal Antibody by Electron Capture Dissociation-Fourier Transform Ion Cyclotron Resonance-Mass Spectrometry. Anal Chem. 2013;85:4239–4246. doi: 10.1021/ac303525n. [DOI] [PubMed] [Google Scholar]
- 48.Ledvina AR, McAlister GC, Gardner MW, Smith SI, Madsen JA, Schwartz JC, Stafford GC, Jr, Syka JE, Brodbelt JS, Coon JJ. Infrared photoactivation reduces peptide folding and hydrogen-atom migration following ETD tandem mass spectrometry. Angew Chem Int Ed Engl. 2009;48:8526–8528. doi: 10.1002/anie.200903557. [DOI] [PMC free article] [PubMed] [Google Scholar]
- 49.Ledvina AR, Beauchene NA, McAlister GC, Syka JE, Schwartz JC, Griep-Raming J, Westphall MS, Coon JJ. Activated-ion electron transfer dissociation improves the ability of electron transfer dissociation to identify peptides in a complex mixture. Anal Chem. 2010;82:10068–10074. doi: 10.1021/ac1020358. [DOI] [PMC free article] [PubMed] [Google Scholar]
- 50.Ledvina AR, Rose CM, McAlister GC, Syka JEP, Westphall MS, Griep-Raming J, Schwartz JC, Coon JJ. Activated ion ETD performed in a modified collision cell on a hybrid QLT-Oribtrap mass spectrometer. J Am Soc Mass Spectrom. 2013;24:1623–33. doi: 10.1007/s13361-013-0621-1. [DOI] [PMC free article] [PubMed] [Google Scholar]
- 51.Riley NM, Westphall MS, Coon JJ. Activated Ion Electron Transfer Dissociation for Improved Fragmentation of Intact Proteins. Anal Chem. 2015;87:7109–7116. doi: 10.1021/acs.analchem.5b00881. [DOI] [PMC free article] [PubMed] [Google Scholar]
- 52.Zhao Y, Riley NM, Sun L, Hebert AS, Yan X, Westphall MS, Rush MJP, Zhu G, Champion MM, Medie FM, Champion PAD, Coon JJ, Dovichi NJ. Coupling Capillary Zone Electrophoresis with Electron Transfer Dissociation and Activated Ion Electron Transfer Dissociation for Top-Down Proteomics. Anal Chem. 2015;87:5422–5429. doi: 10.1021/acs.analchem.5b00883. [DOI] [PMC free article] [PubMed] [Google Scholar]
- 53.Riley NM, Hebert AS, Dürnberger G, Stanek F, Mechtler K, Westphall MS, Coon JJ. Phosphoproteomics with Activated Ion Electron Transfer Dissociation. Anal Chem. 2017;89:6367–6376. doi: 10.1021/acs.analchem.7b00212. [DOI] [PMC free article] [PubMed] [Google Scholar]
- 54.Riley NM, Westphall MS, Hebert AS, Coon JJ. Implementation of Activated Ion Electron Transfer Dissociation on a quadrupole-Orbitrap-linear ion trap hybrid mass spectrometer. Anal Chem. 2017;89:6358–6366. doi: 10.1021/acs.analchem.7b00213. [DOI] [PMC free article] [PubMed] [Google Scholar]
- 55.Riley NM, Westphall MS, Coon JJ. Activated Ion Electron Transfer Dissociation Enables Comprehensive Top-Down Protein Fragmentation. J Proteome Res. 2017 doi: 10.1021/acs.jproteome.7b00249. [DOI] [PMC free article] [PubMed] [Google Scholar]
- 56.Fellers RT, Greer JB, Early BP, Yu X, LeDuc RD, Kelleher NL, Thomas PM. ProSight Lite: Graphical software to analyze top-down mass spectrometry data. Proteomics. 2015;15:1235–1238. doi: 10.1002/pmic.201570050. [DOI] [PMC free article] [PubMed] [Google Scholar]
- 57.Shaw JB, Li W, Holden DD, Zhang Y, Griep-Raming J, Fellers RT, Early BP, Thomas PM, Kelleher NL, Brodbelt JS. Complete protein characterization using top-down mass spectrometry and ultraviolet photodissociation. J Am Chem Soc. 2013;135:12646–51. doi: 10.1021/ja4029654. [DOI] [PMC free article] [PubMed] [Google Scholar]
- 58.Riley NM, Mullen C, Weisbrod CR, Sharma S, Senko MW, Zabrouskov V, Westphall MS, Syka JEP, Coon JJ. Enhanced Dissociation of Intact Proteins with High Capacity Electron Transfer Dissociation. J Am Soc Mass Spectrom. 2015 doi: 10.1007/s13361-015-1306-8. [DOI] [PMC free article] [PubMed] [Google Scholar]
- 59.Shaw JB, Robinson EW, Paša-Tolić L. Vacuum Ultraviolet Photodissociation and Fourier Transform-Ion Cyclotron Resonance (FT-ICR) Mass Spectrometry: Revisited. Anal Chem. 2016;88:3019–3023. doi: 10.1021/acs.analchem.6b00148. [DOI] [PubMed] [Google Scholar]
- 60.Holden DD, McGee WM, Brodbelt JS. Integration of Ultraviolet Photodissociation with Proton Transfer Reactions and Ion Parking for Analysis of Intact Proteins. Anal Chem. 2016;88:1008–1016. doi: 10.1021/acs.analchem.5b03911. [DOI] [PubMed] [Google Scholar]
- 61.Anderson LC, English AM, Wang W, Bai DL, Shabanowitz J, Hunt DF. Protein derivatization and sequential ion/ion reactions to enhance sequence coverage produced by electron transfer dissociation mass spectrometry. Int J Mass Spectrom. 2015;377:617–624. doi: 10.1016/j.ijms.2014.06.023. [DOI] [PMC free article] [PubMed] [Google Scholar]
- 62.Anderson LC, Karch KR, Ugrin SA, Coradin M, English AM, Sidoli S, Shabanowitz J, Garcia BA, Hunt DF. Analyses of Histone Proteoforms Using Front-end Electron Transfer Dissociation-enabled Orbitrap Instruments. Mol Cell Proteomics. 2016;15:975–88. doi: 10.1074/mcp.O115.053843. [DOI] [PMC free article] [PubMed] [Google Scholar]
- 63.Zhang L, English AM, Bai DL, Ugrin SA, Shabanowitz J, Ross MM, Hunt DF, Wang WH. Analysis of Monoclonal Antibody Sequence and Post-translational Modifications by Time-controlled Proteolysis and Tandem Mass Spectrometry. Mol Cell Proteomics. 2016;15:1479–88. doi: 10.1074/mcp.O115.056721. [DOI] [PMC free article] [PubMed] [Google Scholar]
- 64.Tsybin YO, Fornelli L, Stoermer C, Luebeck M, Parra J, Nallet S, Wurm FM, Hartmer R. Structural Analysis of Intact Monoclonal Antibodies by Electron Transfer Dissociation Mass Spectrometry. Anal Chem. 2011;83:8919–8927. doi: 10.1021/ac201293m. [DOI] [PubMed] [Google Scholar]
- 65.Fornelli L, Damoc E, Thomas PM, Kelleher NL, Aizikov K, Denisov E, Makarov A, Tsybin YO. Analysis of intact monoclonal antibody IgG1 by electron transfer dissociation Orbitrap FTMS. Mol Cell Proteomics. 2012;11:1758–67. doi: 10.1074/mcp.M112.019620. [DOI] [PMC free article] [PubMed] [Google Scholar]
- 66.Fornelli L, Ayoub D, Aizikov K, Liu X, Damoc E, Pevzner PA, Makarov A, Beck A, Tsybin YO. Top-down analysis of immunoglobulin G isotypes 1 and 2 with electron transfer dissociation on a high-field orbitrap mass spectrometer. J Proteomics. 2017 doi: 10.1016/j.jprot.2017.02.013. [DOI] [PMC free article] [PubMed] [Google Scholar]
- 67.Dyachenko A, Wang G, Belov M, Makarov A, de Jong RN, van den Bremer ETJ, Parren PWHI, Heck AJR. Tandem Native Mass-Spectrometry on Antibody–Drug Conjugates and Submillion Da Antibody–Antigen Protein Assemblies on an Orbitrap EMR Equipped with a High-Mass Quadrupole Mass Selector. Anal Chem. 2015;87:6095–6102. doi: 10.1021/acs.analchem.5b00788. [DOI] [PubMed] [Google Scholar]
- 68.Lermyte F, Konijnenberg A, Williams JP, Brown JM, Valkenborg D, Sobott F. ETD Allows for Native Surface Mapping of a 150 kDa Noncovalent Complex on a Commercial Q-TWIMS-TOF Instrument. J Am Soc Mass Spectrom. 2014;25:343–350. doi: 10.1007/s13361-013-0798-3. [DOI] [PubMed] [Google Scholar]
Associated Data
This section collects any data citations, data availability statements, or supplementary materials included in this article.
Supplementary Materials
Supplemental Table 1. Summary of best sequence coverage achieved for each protein and the method that yield that result.
Supplemental Figure 1. Comparing AI-ETD with UVPD for carbonic anhydrase.
Supplemental Figure 2. Precursor ion charge state distributions in MS1 spectra.