Abstract
While T2-exchange (T2ex) NMR phenomena have been known for decades, only recently there has been a resurgence of interest to develop T2ex MRI contrast agents. One indispensable advantage of T2ex MR agents is the possibility of using non-toxic and/or bio-important diamagnetic compounds with intermediate exchangeable protons. In this study, we screened a library of phenol-based compounds and determined their T2ex contrast (exchange relaxivity, r2ex) at 9.4 T. Our results showed that the T2ex contrast of phenol protons allows them to be detected directly by MRI at a mM concentration level. We also studied the effect of chemical modification of the phenol on the T2ex MRI contrast through modulation of exchange rate and chemical shift. This study provides a guideline for using endogenous and exogenous phenols for T2ex MRI contrast. As a proof-of-principle application, we demonstrated phenol T2ex contrast can be used to detect enzyme activity in a tyrosinase-catalyzed catechol oxidation reaction.
Keywords: Contrast agents, MRI, phenols, T2-exchange, tyrosinase
Graphical Abstract
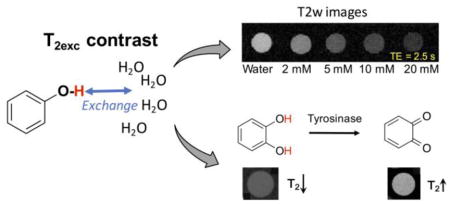
Phenol-based T2-exchange magnetic resonance imaging contrast agents are screened. With the inherent T2-exchange effect, catechol is utilized as the substrate for the detection of tyrosinase activity in a label-free manner.
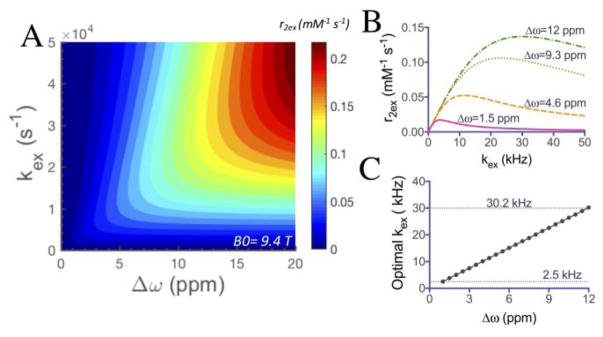
The utility of magnetic resonance imaging (MRI) contrast agents is indispensable for both clinical diagnoses and research. Among the current available agents that have been developed in the last four decades, relaxivity agents, i.e., T1 and T2/T2* MRI contrast agents, are the two most widely used types. Most of these agents are metal-based, either lanthanide or transition metal, which raises more concerns recently on their potential toxicity or disturbance of these metal ions and imposes the extra difficulty for the clinical translation of new agents. Recently, a renewed interest has been drawn to a category of compounds that possess labile protons that can efficiently exchange with surrounding water molecules and result in an observable change in water T2 relaxation time.[1] This type of MRI contrast agents, namely T2-exchange (T2ex) agents, includes both lanthanide-based agents[2] and non-metallic diamagnetic compounds such as iopamidol[3], glycogen[4], and glucose[5] to generate MRI contrast, which paves a new avenue for directly using readily translatable diamagnetic agents for biomedical imaging. This can be considered as a natural extension of diamagnetic chemical exchange saturation transfer (CEST) contrast.[6] The relationship between chemical properties (chemical shift difference from water Δω and proton exchange rate kex) and T2ex contrast has been described using the Swift-Connick equation (Supporting information, Eq. S4–S5).[7] We simulated the equation in Figures 1A and S1, which describes the dependence of the relaxivity r2ex of an agent on its offset frequency from the exchanging partner (water protons here) Δω and the exchange rate kex. As shown, at a given field strength, both Δω and kex can strongly affect relaxivity and thus the T2ex based contrast. A high Δω is always favorable for generating strong T2ex contrast, while there is an optimal kex at each Δω (Figure 1B). According to Figure 1C, for Δω values ranging from 1 ppm to 12 ppm, the optimal kex ranges from 2.5 kHz (for 1 ppm) to 30.2 kHz (for 12 ppm) at 9.4 T, which is faster than the favorable exchange rate to generate CEST contrast. Compared with the much larger shifts in paramagnetic shift agents,[2c] the limited Δω creates a sensitivity barrier for most diamagnetic agents (mostly <6 ppm). For example, as shown in Figure 1B, the theoretical maximum r2ex values at 1.5, 4.6, 9.3 and 12 ppm are 0.017 s−1 mM−1 (kex = 3.8 kHz), 0.053 s−1 mM−1 (kex = 11.6 kHz), 0.106 s−1 mM−1 (kex = 23.4 kHz), and 0.137 s−1 mM−1 (kex = 30.2 kHz), respectively.
Figure 1.
Simulations with the Swift-Connick equation showing the dependence of T2ex contrast on exchange rates and chemical shifts. A) Simulated r2ex as a function of labile proton Δω and kex at B0 = 9.4 T; B) Simulated r2ex dependence on kex for Δω values of 1.5, 4.6, 9.3 and 12 ppm respectively; C) Optimal kex for the Δω range from 1 ppm to 12 ppm.
Phenols represent a class of diamagnetic agents potentially well suited for T2ex contrast. The aromatic ring and lower pKa for the phenolic proton, compared with alcohols, enable a higher Δω and kex.[8] With judicious modification of chemical structures, Δω values of up to 12 ppm have been achieved.[9] In addition, phenol protons are present in a variety of biologically important compounds, such as amino acids, neurotransmitters (e.g. dopamine and serotonin), and commonly used drugs (e.g. acetaminophen). The establishment of controllable exchange for the optimal T2ex effect could potentially help to balance the sensitivity and specificity, promoting the development of clinically useful diamagnetic phenols as T2ex contrast agents.
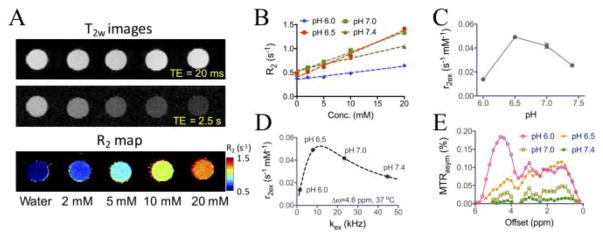
With phenol (1) as the model compound, we first characterized its T2ex contrast ability at 9.4 T, a field strength commonly used for pre-clinical studies. Phenol has an exchangeable hydroxyl proton 4.6 ppm shifted from water (or 9.3 ppm in the NMR spectrum versus TMS, Figure S2), with a pKa of 10. As shown in Figures 2A–2B, phenol clearly exhibits concentration-dependent and pH-dependent T2ex effects, with an observed transverse exchange relativity (r2ex) of, for example, 0.023 s−1 mM−1 at pH 7.4 and 37 °C. It should be noted that phosphate can catalyze proton exchanges,[10] which is negligible when exchange is fast (i.e., pH> 7.0) but become significant at lower pHs where exchange is slow (Figure S3). Therefore, we performed the pH study using water but not PBS solutions. Figure 2C shows that the maximum contrast was obtained at pH 6.5. The kex values of phenol were then estimated by fitting the measured r2ex values at three temperatures (20, 30, and 37 °C) to the Swift-Connick equation (Figure S4, Eqs. S4&S5), under the assumption that kex increases at higher temperature.[7] As shown in Figure 2D, the kex of phenol was estimated to be 23.4 and 44.7 kHz for pH 7.0 and pH 7.4 respectively, which falls in the fast regime of r2ex-kex curve, and 1.6 and 8.0 kHz for pH 6.0 and pH 6.5 respectively, which falls in the slow regime of r2ex-kex plot. This phenomenon can be explained by base-catalyzed proton exchange characteristic of exchangeable protons.[10] At pH 6.5, the kex is most close to the Δω difference (i.e., 2π ×4.6 (ppm)× 400 (Hz/ppm)=11.6 × 103 rad s−1) to generate the maximal T2ex effect. Both fast and slow rates of exchange will reduce the magnitude of T2ex effect. Interestingly, when kex decreased with dropping pH, CEST signals from the phenolic proton appeared (Figure 2E). This process is in line with the condition of kex ≪ Δω, which is a prerequisite for observing CEST effect. At pH 6.0, there was a strong CEST signal at 4.6 ppm (Figure 2E), consistent with the chemical shift value (i.e., 9.3 ppm, Supporting information S2) measured using NMR spectroscopy (compared to the water signal at 4.7 ppm).
Figure 2.
T2ex contrast of phenol (1). A) T2-weighted MR images at echo times (TE) of 20 and 2560 ms as well as the corresponding T2 maps as a function of concentration; B) The concentration dependence of transverse relaxation rates (R2) of phenol in water at the concentration ranging from 2 to 20 mM at 37 °C at four different pHs; C) The measured r2ex of phenol at different pHs; D) The estimated kex of phenols at different pHs and their positions on the r2ex-kex theoretical curve obtained by using the Swift-Connick equation. All data points are shown as the average of three samples (see Supporting Information for experimental details); E) CEST MRI signals of phenol at different pHs as quantified by MTRasym plots from 0 to 6 ppm.
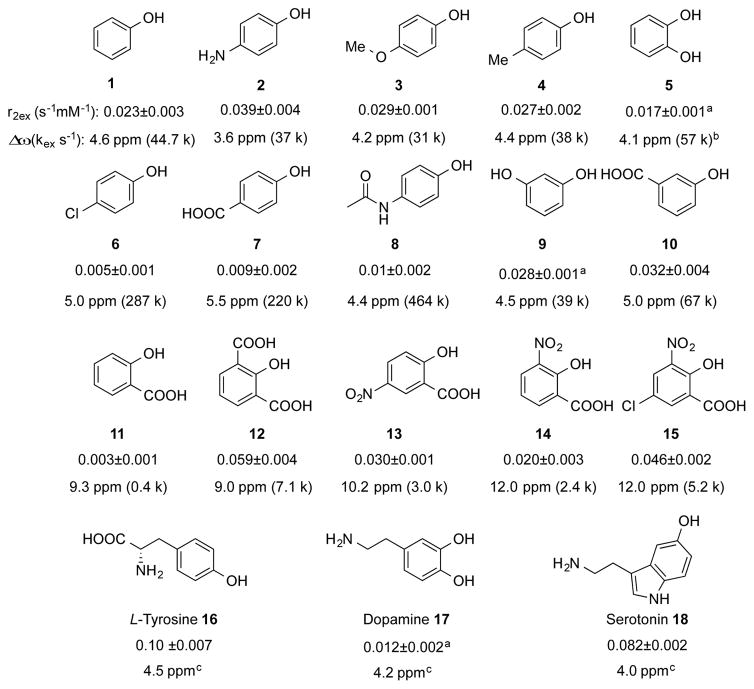
The relaxivity results of studying a series of phenol analogues in PBS at pH 7.4 and 37 °C are listed in Scheme 1. Electron donating substitution (NH2, OMe, Me) para- to the phenol OH (2–4) slightly reduced Δω and more significantly reduced the kex towards the optimum, resulting in an overall increase of r2ex. In sharp contrast, electron withdrawing substitution (Cl, COOH) para- to the phenol OH (6 and 7) dramatically increased the kex against the optimum value and making these agents unsuitable for generating T2ex contrast. Both electron donating and withdrawing modification (OH and COOH) at meta-position were tolerated with only slightly changes in overall r2ex (9 and 10).
Scheme 1.
r2ex of phenols tested. Experimental conditions: pH = 7.4, 37 °C and B0 = 9.4 T. r2ex value were derived from the concentration-dependent R2 fitting line, and Δω was obtained from either NMR spectra or CEST spectra. See Figure S5–S7 (Supporting Information) for details. a) r2ex data for compounds with multiple OHs were normalized for the contribution of single OH. b) Due to interaction between the two ortho- OHs, kex calculated via treating them independently may have significant error. c) kex were not estimated due to the potential minor contribution from other exchangeable protons.
Intramolecular hydrogen bonded phenols have been reported to achieve higher Δω (8.6–12.0 ppm) and applied for CEST MR imaging.[11] For example, salicylic acid (11) can achieve a Δω of 9.3 ppm. However, its exchange rate is too slow (kex ~ 0.4 kHz[11]) to generate T2ex contrast (r2ex = 0.003 s−1 mM−1), despite its favorable chemical shift. Attempts to increase the kex by the introduction of ortho-/para- electron withdrawn groups proved to be successful in 12–15. Higher T2ex contrast was found for these, for example a r2ex of 0.059 s−1 mM−1 and kex of 7.1 kHz for 12 at Δω of 9.0 ppm, and a r2ex of 0.046 s−1 mM−1 and kex of 5.2 kHz for 15 at Δω of 12.0 ppm. In 10 mM PBS at pH 4.5, the r2ex for 15 was 0.11 s−1 mM−1, close to its theoretical maximum (0.137 s−1 mM−1). This experimental largest r2ex is comparable in magnitude to that of glucose at 9.4 T,[5] suggesting the potential opportunity to be used for relevant biomedical studies.
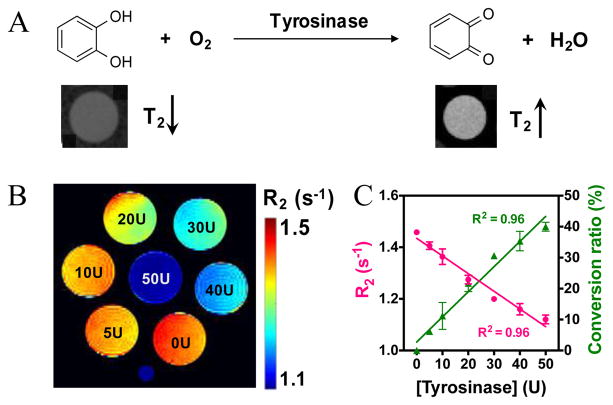
To further demonstrate potential applications, we applied T2ex MRI to monitor the bioactivity of tyrosinase (TYR) in a label-free manner. Tyrosinase is an enzyme catalyzing the hydroxylation of phenolic substrates to catechol derivatives, further oxidized to ortho-quinone products (Figure 3A).[12] These reactions have been recognized as key processes in the biosynthetic pathway of some natural pigments, making TYR the targeting enzyme for treating hypopigmentation-related problems.[13] Recent studies also showed that the accumulated TYR can be considered as an important biomarker of melanoma cancer,[14] and TYR imbalance is related to Parkinson’s disease due to its effect on dopamine neurotoxicity.[15] Therefore, the non-invasive detection of TYR activity is pivotal for diagnosis and treatment monitoring. Our results show that the natural substrate, catechol, has a r2ex of 0.077 s−1 mM−1 at pH 6.5 and 25 °C (Figure S8A), while the product, ortho-quinone, has no T2ex contrast-enhancing ability due to the lack of exchangeable hydroxyl protons, which allows the direct detection of TYR activity by observing the changes in the T2 relaxation time of the system. To demonstrate that, we incubated 10 mM catechol (pH 6.5, 25 °C) with TYR at different concentrations (U, units/mL). As shown in Figure 3B, the presence of TYR significantly decreased the R2 rates of the samples. Because TYR itself did not produce noticeable T2ex effects (Figure S8B), the differences in T2ex between the samples incubated with different concentrations of TYR were attributed the conversion of catechol to ortho-quinone. The change in T2ex thus allows the quantitative detection of enzyme activity without the need for additional agents. For example, as shown in Figure 3C, we calculated the conversion ratio based on the T2ex of the samples. This is just a first example of using the T2ex contrast not only to detect the presence of phenol derivatives but also to monitor their changes and reactions.
Figure 3.
The Detection of tyrosinase enzyme activity using T2ex MRI. A) Schematic illustration of the conversion of catechol (high T2ex contrast or hypointense MRI signal on the T2w image shown below) to benzoquinone (no T2ex contrast or hyperintense MRI signal on the T2w image shown below) by the catalysis of tyrosinase. B) Pseudo-colored R2 maps of 10 mM catechol solutions (in PBS, 10 mM, pH 6.5), containing different concentration of tyrosinase after reaction for 1.5 h at 25 °C. C) Correlation of transverse relaxation rate and conversion ratio with concentration of tyrosinase. Note: U is the unit of tyrosinase concentration and stands for unit/mL.
While the T2 contrast-enhancement ability of diamagnetic agents is weaker than those of paramagnetic metallic agents, this new approach has several important advantages for in vivo applications. Firstly, similar to CEST MRI, T2ex contrast can be used to detect enzyme activity[16] in a label-free way. Evidenced by the TYR study, the changes in many physiologically or pathologically important molecules (in response to treatments) can be observed directly without disturbing the system. Indeed, we showed that two naturally abundant compounds (tyrosine 16, r2ex = 0.10 s−1mM−1 and serotonin 18, r2ex = 0.08 s−1mM−1) can be used as T2ex agents. The concentrations generating 1% MRI contrast, which is on the same order of magnitude as functional MRI signal changes, are 2 and 2.4 mM, respectively, in short T2 tissues (e.g. muscle, T2~50 ms[17]), or 1 and 1.2 mM respectively, in long T2 tissues (e.g. grey matter, T2~100 ms[17]), implying the potential for in vivo applications. It should be noted that the detection limit in a MRI study is defined by the contrast-to-noise ratio (CNR) and a threshold of CNR of 2√2 is typically used to achieve a 95% probability that the contrast before and after the injection of an agent is different[18]. As CNR is defined by ΔS% times signal-to-noise ratio (SNR), the minimally required SNR for reliably detecting 1% signal change is 282, suggesting a high SNR (i.e., ~300) should be used to reliably detect a 1% signal change. On the other hand, previous studies showed that the local concentration of exogenously injected agents can reach >4 mM in the tumor[19] and >5 mM in the blood[20] in animal studies, and > 69 mM in the kidney in human studies[21], indicative of the possibility of achieving sufficient local concentrations for generating T2ex contrast. Finally, while pH may be a confounding factor for quantifying the concentration in the targeted tissue, its effect on quantification can be minimized by using the dynamic contrast enhanced imaging scheme, an approach widely used in CEST MRI studies for quantitatively measuring tissue uptake of pH sensitive CEST agents.[22] Nevertheless, this approach is particularly useful for monitoring the ex vivo drugs or agents, for example, in tumors (typically have longer T2 values), without any additional imaging labeling, in a theranostic manner.[22a, 23]
In summary, we screened a library of phenol-based compounds and determined their T2ex effects. The T2ex contrast was delicately modulated by means of chemical modification, which affected exchange rate and chemical shift. Current results show that the T2ex effect of phenols can be optimized for MR imaging directly at a mM concentration level. Understanding the T2ex mechanism of phenolic protons shall contribute to the interpretation of endogenous T2 signals and the development of new exogenous T2ex agents. As the first proof-of-concept, we applied this contrast mechanism to the detection of enzymatic activity of tyrosinase by directly utilizing the changes in T2ex relaxation times when the natural substrate is converted to the product. These phenols are also expected to affect the parameter T1ρ, the longitudinal relaxation time in the rotating frame, which is also exchange dependent.[24]
Experimental Section
Aqueous solutions of each chemical were freshly prepared prior to each MRI measurements either in water or phosphate buffered saline (PBS). When not otherwise noted, the sample phantoms were warmed to 37 °C. All MRI measurements were performed using a Bruker 9.4 T vertical MR scanner with a 20-mm birdcage transmit/receive coil. T2 relaxation times were acquired using a Carr-Purcell-Meiboom-Gill (CPMG) method as previously described[5]. Briefly, a T2 preparation module, with 16 echo times ranging from 20 ms to 10.24 sec, was added in the front of a Rapid Acquisition with Relaxation Enhancement (RARE) pulse sequence. The imaging parameters were: TR/TE = 25000/4.3 ms, RARE factor = 16, a 64x64 acquisition matrix with a spatial resolution of c.a. 250x250 μm2, and slice thickness of 1 mm. The acquisition time for each T2-weighted image was 1 min 40 s.
Supplementary Material
Footnotes
Financial support from the NIH grants R03CA197470, R03EB021573, R01CA211087, R21CA215860, R01EB019934, and R01EB015032, and the Chinese National Thousand Young Talents Program is acknowledged.
Supporting information for this article is given via a link at the end of the document.
Contributor Information
Jia Zhang, The Russell H. Morgan Department of Radiology, The Johns Hopkins University School of Medicine, Baltimore, Maryland, United States.
Yuguo Li, The Russell H. Morgan Department of Radiology, The Johns Hopkins University School of Medicine, Baltimore, Maryland, United States.
Stephanie Slania, Department of Biomedical Engineering, The Johns Hopkins University, Baltimore, Maryland, United States.
Nirbhay N. Yadav, The Russell H. Morgan Department of Radiology, The Johns Hopkins University School of Medicine, Baltimore, Maryland, United States. F.M. Kirby Research Center for Functional Brain Imaging, Kennedy Krieger Institute, Baltimore, Maryland, United States
Jing Liu, The Russell H. Morgan Department of Radiology, The Johns Hopkins University School of Medicine, Baltimore, Maryland, United States. Graduate College, Southern Medical University, Guangzhou, Guangdong, China.
Rongfu Wang, Department of Nuclear Medicine, Peking University First Hospital Beijing, China.
Jianhua Zhang, Department of Nuclear Medicine, Peking University First Hospital Beijing, China.
Prof. Martin G. Pomper, The Russell H. Morgan Department of Radiology, The Johns Hopkins University School of Medicine, Baltimore, Maryland, United States
Prof. Peter C. van Zijl, The Russell H. Morgan Department of Radiology, The Johns Hopkins University School of Medicine, Baltimore, Maryland, United States. F.M. Kirby Research Center for Functional Brain Imaging, Kennedy Krieger Institute, Baltimore, Maryland, United States
Prof. Xing Yang, The Russell H. Morgan Department of Radiology, The Johns Hopkins University School of Medicine, Baltimore, Maryland, United States. Department of Nuclear Medicine, Peking University First Hospital Beijing, China
Prof. Guanshu Liu, The Russell H. Morgan Department of Radiology, The Johns Hopkins University School of Medicine, Baltimore, Maryland, United States. F.M. Kirby Research Center for Functional Brain Imaging, Kennedy Krieger Institute, Baltimore, Maryland, United States
References
- 1.Leigh JS. J Mag Reson (1969) 1971;4:308–311. [Google Scholar]
- 2.a) Soesbe TC, Merritt ME, Green KN, Rojas-Quijano FA, Sherry AD. Magn Reson Med. 2011;66:1697–1703. doi: 10.1002/mrm.22938. [DOI] [PMC free article] [PubMed] [Google Scholar]; b) Soesbe TC, Togao O, Takahashi M, Sherry AD. Magn Reson Med. 2012;68:816–821. doi: 10.1002/mrm.23302. [DOI] [PMC free article] [PubMed] [Google Scholar]; c) Daryaei I, Pagel MD. Res Rep Nucl Med. 2015;5:19–32. doi: 10.2147/RRNM.S81742. [DOI] [PMC free article] [PubMed] [Google Scholar]
- 3.Aime S, Nano R, Grandi M. Invest Radiol. 1988;23(Suppl 1):S267–270. doi: 10.1097/00004424-198809001-00058. [DOI] [PubMed] [Google Scholar]
- 4.Gore JC, Brown MS, Mizumoto CT, Armitage IM. Magn Reson Med. 1986;3:463–466. doi: 10.1002/mrm.1910030312. [DOI] [PubMed] [Google Scholar]
- 5.Yadav NN, Xu J, Bar-Shir A, Qin Q, Chan KW, Grgac K, Li W, McMahon MT, van Zijl PC. Magn Reson Med. 2014;72:823–828. doi: 10.1002/mrm.25329. [DOI] [PMC free article] [PubMed] [Google Scholar]
- 6.a) van Zijl PCM, Lam WW, Xu J, Knutsson L, Stanisz GJ. Neuroimage. 2017 doi: 10.1016/j.neuroimage.2017.04.045. [DOI] [PMC free article] [PubMed] [Google Scholar]; b) Jones KM, Pollard AC, Pagel MD. J Magn Reson Imaging. 2017 doi: 10.1002/jmri.25838. [DOI] [PMC free article] [PubMed] [Google Scholar]; c) Liu G, Song X, Chan KW, McMahon MT. NMR Biomed. 2013;26:810–828. doi: 10.1002/nbm.2899. [DOI] [PMC free article] [PubMed] [Google Scholar]; d) van Zijl P, Yadav NN. Mag Reson Med. 2011;65:927–948. doi: 10.1002/mrm.22761. [DOI] [PMC free article] [PubMed] [Google Scholar]
- 7.Swift TJ, Connick RE. J Chem Phys. 1962;37:307–320. [Google Scholar]
- 8.Puar M, Grunwald E. Tetrahedron. 1968;24:2603–2610. [Google Scholar]
- 9.Yang X, Yadav NN, Song X, Ray Banerjee S, Edelman H, Minn I, van Zijl PC, Pomper MG, McMahon MT. Chem Eur J. 2014;20:15824–15832. doi: 10.1002/chem.201403943. [DOI] [PMC free article] [PubMed] [Google Scholar]
- 10.Liepinsh E, Otting G. Magn Reson Med. 1996;35:30–42. doi: 10.1002/mrm.1910350106. [DOI] [PubMed] [Google Scholar]
- 11.Yang X, Song X, Li Y, Liu G, Banerjee SR, Pomper MG, McMahon MT. Angew Chem Int Ed. 2013;52:8116–8119. doi: 10.1002/anie.201302764. [DOI] [PMC free article] [PubMed] [Google Scholar]
- 12.a) Korner A, Pawelek J. Science. 1982;217:1163–1165. doi: 10.1126/science.6810464. [DOI] [PubMed] [Google Scholar]; b) Sanchez-Ferrer A, Rodriguez-Lopez JN, Garcia-Canovas F, Garcia-Carmona F. Biochim Biophys Acta. 1995;1247:1–11. doi: 10.1016/0167-4838(94)00204-t. [DOI] [PubMed] [Google Scholar]
- 13.Briganti S, Camera E, Picardo M. Pigment Cell Res. 2003;16:101–110. doi: 10.1034/j.1600-0749.2003.00029.x. [DOI] [PubMed] [Google Scholar]
- 14.Angeletti C, Khomitch V, Halaban R, Rimm DL. Diagn Cytopathol. 2004;31:33–37. doi: 10.1002/dc.20051. [DOI] [PubMed] [Google Scholar]
- 15.Asanuma M, Miyazaki I, Ogawa N. Neurotox Res. 2003;5:165–176. doi: 10.1007/BF03033137. [DOI] [PubMed] [Google Scholar]
- 16.a) Bar-Shir A, Liu G, Liang Y, Yadav NN, McMahon MT, Walczak P, Nimmagadda S, Pomper MG, Tallman KA, Greenberg MM, van Zijl PC, Bulte JW, Gilad AA. J Am Chem Soc. 2013;135:1617–1624. doi: 10.1021/ja312353e. [DOI] [PMC free article] [PubMed] [Google Scholar]; b) Liu G, Liang Y, Bar-Shir A, Chan KW, Galpoththawela CS, Bernard SM, Tse T, Yadav NN, Walczak P, McMahon MT, Bulte JW, van Zijl PC, Gilad AA. J Am Chem Soc. 2011;133:16326–16329. doi: 10.1021/ja204701x. [DOI] [PMC free article] [PubMed] [Google Scholar]; c) Haris M, Singh A, Mohammed I, Ittyerah R, Nath K, Nanga RP, Debrosse C, Kogan F, Cai K, Poptani H, Reddy D, Hariharan H, Reddy R. Sci Rep. 2014;4:6081. doi: 10.1038/srep06081. [DOI] [PMC free article] [PubMed] [Google Scholar]
- 17.Stanisz GJ, Odrobina EE, Pun J, Escaravage M, Graham SJ, Bronskill MJ, Henkelman RM. Magn Reson Med. 2005;54:507–512. doi: 10.1002/mrm.20605. [DOI] [PubMed] [Google Scholar]
- 18.Haacke EM. Magnetic Resonance Imaging: Physical Principles and Sequence Design. Wiley-Liss; 1999. p. 349. [Google Scholar]
- 19.Chen LQ, Howison CM, Jeffery JJ, Robey IF, Kuo PH, Pagel MD. Magn Reson Med. 2014;72:1408–1417. doi: 10.1002/mrm.25053. [DOI] [PMC free article] [PubMed] [Google Scholar]
- 20.a) Schuenke P, Koehler C, Korzowski A, Windschuh J, Bachert P, Ladd ME, Mundiyanapurath S, Paech D, Bickelhaupt S, Bonekamp D, Schlemmer HP, Radbruch A, Zaiss M. Magn Reson Med. 2017;78:215–225. doi: 10.1002/mrm.26370. [DOI] [PubMed] [Google Scholar]; b) Deuel RK, Yue GM, Sherman WR, Schickner DJ, Ackerman JH. Science. 1985;228:1329–1332. doi: 10.1126/science.4001946. [DOI] [PubMed] [Google Scholar]
- 21.Jones KM, Randtke EA, Yoshimaru ES, Howison CM, Chalasani P, Klein RR, Chambers SK, Kuo PH, Pagel MD. Mol Imaging Biol. 2017;19:617–625. doi: 10.1007/s11307-016-1029-7. [DOI] [PMC free article] [PubMed] [Google Scholar]
- 22.a) Li Y, Chen H, Xu J, Yadav NN, Chan KW, Luo L, McMahon MT, Vogelstein B, van Zijl PC, Zhou S, Liu G. Oncotarget. 2016;7:6369–6378. doi: 10.18632/oncotarget.7141. [DOI] [PMC free article] [PubMed] [Google Scholar]; b) Chan KW, McMahon MT, Kato Y, Liu G, Bulte JW, Bhujwalla ZM, Artemov D, van Zijl PC. Magn Reson Med. 2012;68:1764–1773. doi: 10.1002/mrm.24520. [DOI] [PMC free article] [PubMed] [Google Scholar]
- 23.a) Lock LL, Li Y, Mao X, Chen H, Staedtke V, Bai R, Ma W, Lin R, Li Y, Liu G, Cui H. ACS Nano. 2017;11:797–805. doi: 10.1021/acsnano.6b07196. [DOI] [PMC free article] [PubMed] [Google Scholar]; b) Liu H, Jablonska A, Li Y, Cao S, Liu D, Chen H, Van Zijl PC, Bulte JW, Janowski M, Walczak P, Liu G. Theranostics. 2016;6:1588–1600. doi: 10.7150/thno.15492. [DOI] [PMC free article] [PubMed] [Google Scholar]; c) Ngen EJ, Bar-Shir A, Jablonska A, Liu G, Song X, Ansari R, Bulte JW, Janowski M, Pearl M, Walczak P, Gilad AA. Mol Pharm. 2016;13:3043–3053. doi: 10.1021/acs.molpharmaceut.6b00130. [DOI] [PubMed] [Google Scholar]
- 24.a) Jin T, Autio J, Obata T, Kim SG. Magn Reson Med. 2011;65:1448–1460. doi: 10.1002/mrm.22721. [DOI] [PMC free article] [PubMed] [Google Scholar]; b) Cobb JG, Li K, Xie J, Gochberg DF, Gore JC. Magn Reson Imaging. 2014;32:28–40. doi: 10.1016/j.mri.2013.08.002. [DOI] [PMC free article] [PubMed] [Google Scholar]
Associated Data
This section collects any data citations, data availability statements, or supplementary materials included in this article.


