

Abstract
Image analysis based automated systems aiming to automate the manual microscopic review of peripheral blood smears have gained popularity in recent times. In this paper, we evaluate a new blood smear analysis system based on artificial intelligence, Shonit™ by SigTuple Technologies Private Limited. One hundred normal samples with no flags from an automated haematology analyser were taken. Peripheral blood smear slides were prepared using the autostainer integrated with an automated haematology analyser and stained using May-Grunwald–Giemsa stain. These slides were analysed with Shonit™. The metrics for evaluation included (1) accuracy of white blood cell classification for the five normal white blood cell types, and (2) comparison of white blood cell differential count with the automated haematology analyser. In addition, we also explored the possibility of estimating the value of red blood cell and platelet indices via image analysis. Overall white blood cell classification specificity was greater than 97.90% and the precision was greater than 93.90% for all the five white blood cell classes. The correlation of the white blood cell differential count between the automated haematology analyser and Shonit™ was found to be within the known inter cell-counter variability. Shonit™ was found to show promise in terms of its ability to analyse peripheral blood smear images to derive quantifiable metrics useful for clinicians. Future enhancement should include the ability to analyse abnormal blood samples.
Keywords: Image analysis, Peripheral blood smears, Artificial intelligence
Introduction
Automated five-part hematology analyzers have seen great advancement recently, yet they have limitations in detection of abnormal cells. Thus, manual microscopic review of peripheral blood smear (PBS) remains the gold standard for the diagnosis of several disorders. A study by Cornet et al. [1] showed that 15% or more of blood samples require manual review.
Systems for automated analysis of PBS through images exist [2–4]. They analyze images of the smear captured through microscope. However, their usefulness in developing countries is limited by the cost factor. An affordable and easy-to-use medical device which can partially automate the manual microscopic review of a blood smear has immense applicability in developing countries. Shonit™ [5] was motivated by such a vision.
The objectives of this study were to evaluate the accuracy of Shonit™ for identification of normal WBC types and compute the correlation of differential count with Sysmex XN 3000TM [6]. We also explored the possibility of estimating the statistical metrics which are a part of the standard output of most hematology analyzers.
The study was conducted only on normal samples, which had no flags from Sysmex XN 3000TM. Thus, the performance on various abnormalities were beyond the scope of this study.
Materials and Methods
Samples
One hundred anonymized samples, fifty each of male and female in the age range of 20–50 years with normal counts and no flags on the five-part differential cell counter, Sysmex XN 3000TM, were included in the study.
Staining
All the smears were created for the above samples using Sysmex SP-10-autostainer, which is an automated instrument used for smear preparation and staining. May-Grunwald-Giemsa stain was used.
The WBC total count of the samples varied from 4180 to 10,420 cells/microliters, with the majority being in the range 5500–8000 cells/microliter.
The study was done in a blinded fashion and the counts reported by Shonit™ and Sysmex XN 3000TM were generated independently.
Artificial Intelligence Based Peripheral Blood Smear Analysis System
Shonit™ has a hardware and a software component. The hardware part consists of a standard light microscope (currently a Labomed LX500 [7]) and a cell phone (currently an iPhone-6s [8]) attached to the binocular eyepiece of the microscope so that rear camera of the phone is aligned with the optical axis of the eyepiece.
Images of different parts of the smear are captured using the phone and automatically uploaded to a cloud based software platform. A typical image is shown in Fig. 1.
Fig. 1.
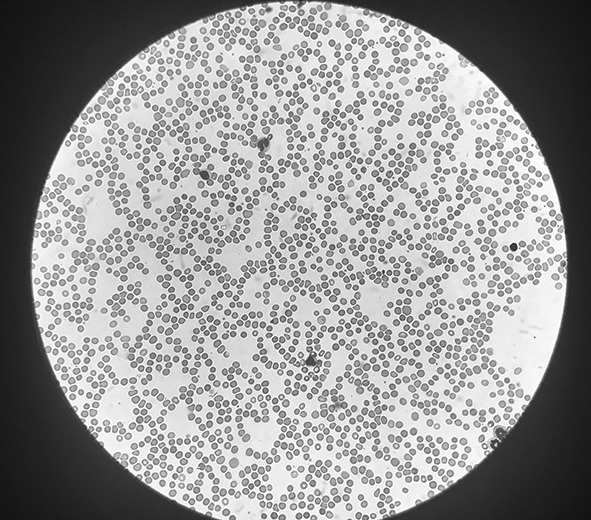
A typical field of view (FOV) captured with the iPhone 6s camera through the binocular eyepiece of the microscope (size reduced). The objective and ocular magnification is 40× and 10× respectively
The software component of Shonit™ consists of a cloud based artificial intelligence (AI) platform which analyses the images. All WBCs visible in the captured images are extracted and classified. The classes are neutrophil, lymphocyte, monocyte, eosinophil, basophil, and a separate class where all immature granulocytes and blasts are placed. Cells which cannot be confidently classified by the software are placed into an “unclassified” bucket. The output includes extraction of thousands of erythrocytes (approximately 30,000) from the images, and measurement of their area, diameter and pallor ratio. The output also includes extraction of platelets and classification into 3 types—platelets, large platelets, platelet clumps. Platelet area and diameters are also measured.
In addition, Shonit™ further provides a statistical analysis on various parameters in the form of mean and standard deviation of WBC and RBC (red blood cell or erythrocyte) diameters in each class (in microns) and the mean, standard deviation of RBC pallor ratio and the histogram of RBC diameter and pallor ratio. It also provides the platelet area and diameter histograms.
A typical report is shown in Fig. 2. Figure 2a shows the visual report, while Fig. 2b shows the statistical report.
Fig. 2.

a The visual report showing lymphocytes. b The statistical report showing the histograms. (Image sizes have been reduced)
The Artificial Intelligence System for Cell Identification
Shonit™ employs a combination of different image processing and AI techniques for analyzing the blood smear images. The cell identification works in two phases—cell extraction and cell classification.
Cell Extraction
Cells were first extracted from the image so that they could be analyzed independently. Several algorithms have been suggested for such extraction [9, 10]. Shonit™ used a combination of these, with some additional changes to extract WBCs, RBCs and platelets. Measurement of cell area and area of central pallor were performed at this stage.
Cell Classification
The extracted cells were then classified using three different deep neural network models [11, 12]—one each for WBC, RBC and platelet. These neural networks were trained with several thousand sample cell images, annotated by 3 haemato-pathologists (for example, the WBC training set consisted of around 6000 cell images). The annotations were done independently by the three experts, in a blinded fashion. A cell image was included in the training set only if all 3 experts concurred on the classification. Due to the natural disparity in frequency of the various cell types, the initial training set was heavily imbalanced, with fewer examples of eosinophils, basophils and monocytes. The deep neural networks generated in this initial phase before the study were used for analysing the first 50 samples in the study.
Image Capture Protocol
An average of 150 images per sample were captured from each smear, by personnel who received training on image capture. The training for image capture included the number of images to be captured, selection of field-of-view (FOV) on slide and uploading the images. This however was an interim arrangement as future goal includes complete automation of image capture by a robotic system. Images were typically captured only from regions where there were few overlapping RBCs or the RBCs were just touching each other. The “feathered edge” region of the smear was avoided. Within the region of capture, selection of field-of-view was done based on number of leukocytes visible, the objective being to capture only those field-of-views which had at least one leukocyte. In this process, more than 200 WBCs (in most cases more than 300) were captured per sample in the images.
Phased Study: Re-training at Midpoint
The study set of 100 slides were divided into 2 sets of 50 each. The first 50 (phase 1) were analyzed by the AI models developed before the start of the study. A subset of cells extracted from the first 50 slides were used to further enhance the model accuracy by enhancing the training set, especially to reduce the imbalance in the training set (by taking more examples of eosinophil, basophil and monocyte from phase 1). The next 50 slides (phase 2) were analyzed with the enhanced models. The objective was to track the improvement in precision of cell classification with increase in size of training set.
An institutional review board approval was obtained for the study.
Results
The reports generated by Shonit™ were verified in two ways. Three hemato-pathologists verified the accuracy of leukocyte type identification. The differential count reported by Shonit™ were compared with those of Sysmex XN 3000TM.
Accuracy of Cell Recognition
The WBC classification precision (or positive predictive value—PPV), specificity and sensitivity [13] were judged by selecting a random sample of around 2100 cells classified by the Shonit™ and verifying the predicted labels by 3 hemato-pathologists. For a given cell image (say X) predicted to be of a particular type (say A), five definitions were used.
True Positive
X was predicted to be of type A where at least two out of the three experts confirmed it. The confirmation from majority of the experts proved that there was sufficient reason to believe that X belongs to type A. Where there was lack of consensus by the majority, we did not use the image to test the machine classification as we were unsure of the correctness.
False Positive
X was predicted to be of type A and at least two out of three experts opine that it belonged to a different class. The concurrence of all experts proved that there was no reason to believe that X belonged to type A.
True Negative
X was not predicted to be A, and at least two out of the three experts confirmed that it was not A. Like the true positive case, the machine classification was not tested on images where there was no majority consensus among experts.
False Negative
X was not predicted to be A, but at least two out of three experts opined that X was of type A.
Unclassified
All 3 experts opined that X cannot be reliably classified. The machine classification was not tested on these images as we are unsure of the correctness.
The precision, specificity and sensitivity values for 4 normal WBC types, in phase 1 and phase 2 of the study are presented in Table 1. The specificity, sensitivity and precision of underrepresented cell types (like eosinophils and monocytes) improved significantly in phase 2 following the addition of more training data from phase 1, while, that of other cell types (neutrophils and lymphocytes) remained the same. Since all samples were normal, the percentage of basophils was not more than 0.2% in any of them and their specificity and sensitivity are not reported. As can be seen from the table, the specificity was greater than or equal to 97.9% and precision was greater than or equal to 93.9% for all WBC classes.
Table 1.
Specificity, sensitivity and precision of WBC identification in phase 1 and phase 2 of the study
| False positive | True negative | False negative | True positive | Specificity | Sensitivity | Precision | Precision reported in [1] | |
|---|---|---|---|---|---|---|---|---|
| Phase 1 | ||||||||
| Eosinophil | 19 | 1727 | 26 | 152 | 0.989 | 0.854 | 0.888 | 0.960 |
| Lymphocyte | 14 | 1357 | 21 | 527 | 0.989 | 0.961 | 0.974 | 0.990 |
| Monocyte | 29 | 1616 | 23 | 266 | 0.982 | 0.920 | 0.901 | 0.920 |
| Neutrophil | 44 | 1114 | 14 | 777 | 0.962 | 0.982 | 0.946 | 0.956 |
| Phase 2 (after retraining) | ||||||||
| Eosinophil | 7 | 1393 | 14 | 164 | 0.995 | 0.921 | 0.959 | 0.960 |
| Lymphocyte | 9 | 1276 | 17 | 531 | 0.993 | 0.968 | 0.983 | 0.990 |
| Monocyte | 18 | 1482 | 10 | 279 | 0.988 | 0.965 | 0.939 | 0.920 |
| Neutrophil | 23 | 1073 | 6 | 785 | 0.979 | 0.992 | 0.971 | 0.956 |
Comparison of WBC Differential Count
An important metric of evaluation was the WBC differential count (DC). The hypothesis was that if cell recognition accuracy is high, then by counting a sufficiently large number of WBCs, the DC output by Shonit™ should approach that of the cell counter.
For the statistical analysis, we calculated the correlation of single measurements from Sysmex XN 3000TM and Shonit™ against the mean of the two systems. This analysis not only showed how closely the two outputs correlated, but it also highlighted any systematic difference between the two.
The results from Shonit™ compared well with the average correlation of 4 analyzers as indicated in Table 2.
Table 2.
Correlation between Sysmex and Shonit for the 4 cell types, compared with the average correlation reported in [13]
| Cell type | Correlation coefficient | Average correlation from [13] |
|---|---|---|
| Neutrophil | 0.977 | 0.961 |
| Lymphocyte | 0.977 | 0.968 |
| Monocyte | 0.942 | 0.836 |
| Eosinophil | 0.954 | 0.987 |
Estimation of RBC and Platelet Indices
Most hematology analyzers report a set of indices on RBC and platelets. Some of these include MCV (mean corpuscular volume), MCH (mean corpuscular hemoglobin), MCHC (mean corpuscular hemoglobin concentration), PCV (packed cell volume or hematocrit), mean platelet volume (MPV) and immature platelet fraction (IPF). In this study, we tried to estimate the values of these indices from the statistical parameters computed by Shonit™. The system described in Roche, Cobas M511 [3] also uses images to compute the values of indices.
We divided the set of 100 samples into two subsets—a training set of 80 samples and a test or validation set of 20 samples. We provide an example of the estimation method below:
To estimate MCV, we used the RBC diameter histogram reported by Shonit™. Four or more percentile values from the diameter histogram of each sample in the training set were used as the independent or explanatory variables. The corresponding Sysmex reported value of MCV was used as the dependent variable. A linear regression [14] was performed on this set to estimate the values of the coefficients in the fitted linear equation. This linear equation was used next on the samples from the validation set to estimate the value of MCV and compared with the Sysmex reported value. The result for the test set is shown in Fig. 3 with the blue dots being the estimates. The central line represents the “perfect fit” (if the estimates were exactly equal to the Sysmex reported values). The lines above and below it represent the +10, +20 and −10, −20% limits on the Sysmex values, respectively. As can be observed, all the estimates (except one) lie within the 10% limit.
Fig. 3.

Prediction of MCV from the histogram of RBC diameter
All indices were estimated with a method similar to what is described above, though other explanatory variables were used for some other indices, e.g. pallor ratio histogram, platelet diameter histogram and histogram of number of RBCs per field of view. A detailed discussion on these will be done in a future publication.
Indices which could be estimated to within 10% of the Sysmex reported value in the test set include MCV, RDW-CV (Red cell Distribution Width - Coefficient Variation), RDW-SD (Red cell Distribution Width—Standard Deviation), MCH and MPV. Some parameters, including Hb (Hemoglobin), PCV, RBC (RBC count per microliter), MCHC could be estimated to within 20% of the Sysmex reported value.
Discussion
Machine learning based AI has come of age in the recent years [11, 12, 15]. Machine learned models for image identification are now being applied towards detecting objects of interest in medical images [16] and Shonit™ is inspired by these advances.
This study was aimed at evaluating the performance of Shonit™ on its ability to analyze PBS images and derive quantifiable metrics. The precision of cell identification was within the limits of the inter observer variability expected in manual inspection. Further, a significantly improved precision was observed in phase 2 of the study, with the addition of more training samples from phase 1. The precision values from a study of the CellaVision [2] system, as reported in a paper by Cornet et al. [1] as well as with other studies, are also included in the Table 1 [1, 17, 18]. Further improvements are possible by increasing the training set size.
Meintker et al. [13] present an analysis comparing the performance of 4 different hematology analyzers on different statistical indices. The correlation of the WBC differential count between Sysmex XN 3000™ and Shonit™ compares favorably with the inter cell-counter variability reported in [13] as shown in Table 2. Basophils are omitted because of their low numbers.
The prediction accuracy of statistical indices is expected to improve with the addition of more training samples. This requires further study.
Shonit™ has multiple advantages. It enables tele medicine by allowing the pathologist to review slides remotely through the web based interface. It substantially reduces slide review time, allowing the pathologist more time to concentrate more on abnormal samples. The automated microscope, once developed, can capture far more fields of view than what is currently viewed by a pathologist under normal circumstances, thereby increasing the sensitivity to detect abnormalities. Continuous improvement of the AI models with more and more test data enables new features to be added to the analysis and constant betterment of the existing analyses, without any upgrades to the hardware.
Future Work
Future work will include studies on abnormal WBC (both count and morphology), RBC poikilocyte analysis, enumeration of platelets and further analysis on the estimation of statistical indices.
The current setup involves manual intervention at two stages—smear preparation and image capture. Both are prone to errors. Smear quality is very dependent on the technician. Image capture, though a simple task, is effort intensive. An automated smear maker, combined with an automated image capture system can solve for both problems. The imaging system should automatically capture adequate number of images from appropriate areas in the smear. It should also report badly prepared smears and avoid capturing images from “bad” areas in an otherwise good quality smear. Such an automated system is currently under development. It addresses both problems and is aimed to be a low-cost solution.
Compliance with Ethical Standards
Conflict of interest
Anand Diagnostic Laboratory and SigTuple Technologies Private Limited have an ongoing research collaboration and SigTuple Technologies Private Limited ideated, designed and developed Shonit™, a new artificial intelligence based blood smear analysis system.
Contributor Information
Preethi S. Chari, Email: preethichari@gmail.com
Sujay Prasad, Email: sujayprasad@mac.com.
References
- 1.Cornet E, Perol JP, Troussard X. Performance evaluation and relevance of the CellaVision™ DM96 system in routine analysis and in patients with malignant hematological diseases. Int J Lab Hematol. 2008;30:536–542. doi: 10.1111/j.1751-553X.2007.00996.x. [DOI] [PMC free article] [PubMed] [Google Scholar]
- 2.Cellavision. Introducing CellaVision DM9600. http://www.cellavision.com/en/our-products/products/cellavision-dm9600. Accessed 15 Oct 2016
- 3.Roche Diagnostics Limited. cobas m511 integrated hematology analyser. http://www.cobas.com/home/product/hematology-testing/cobas-m-511.html. Accessed 15 Oct 2016
- 4.West medica. Vision hema ultimate. http://visionhemaultimate.com. Accessed 1 Nov 2016
- 5.SigTuple. Shonit™: the complete peripheral blood smear analysis solution. https://www.sigtuple.com. Accessed 1 Nov 2016
- 6.Sysmex. XN-3000™ hematology system. https://www.sysmex.com/us/en/Products/Hematology/XNSeries/Pages/XN-3000-Hematology-Analyzer.aspx. Accessed 7 Oct 2016
- 7.Labo America. Lx 500. http://www.laboamerica.com/products/compound/lx500. Accessed 27 Sept 2016
- 8.Apple. iPhone 6s. http://www.apple.com/iphone-6s/. Accessed 1 Nov 2016
- 9.Angulo J, Flandrin G. Automated detection of working area of peripheral blood smears using mathematical morphology. Anal Cell Pathol. 2003;25(Suppl. 1):37–49. doi: 10.1155/2003/642562. [DOI] [PMC free article] [PubMed] [Google Scholar]
- 10.Ritter N, Cooper J (2007) Segmentation and border identification of cells in images of peripheral blood smear slides. In: Proceedings of the thirtieth Australasian conference on computer science, pp. 161–69
- 11.Bengio Y. Learning deep architectures for AI. Found Trends Mach Learn. 2009;2(Suppl. 1):1–127. doi: 10.1561/2200000006. [DOI] [Google Scholar]
- 12.Krizhevsky A, Sutskever I, Hinton GE (2013) Imagenet classification with deep convolutional neural networks. In: Proceedings of the advances in neural information processing systems, pp. 1106–1114
- 13.Meintker L, Ringwald J, Rauh M, Krause SW. Comparison of automated differential blood cell counts from Abbott Sapphire, Siemens Advia 120, Beckman Coulter DxH 800, and Sysmex XE-2100 in normal and pathologic samples. Am J Clin Pathol. 2013;139(5):641–650. doi: 10.1309/AJCP7D8ECZRXGWCG. [DOI] [PubMed] [Google Scholar]
- 14.Kirkwood BR, Sterne JAC. Essential medical statistics. 2. Oxford: Blackwell; 2003. [Google Scholar]
- 15.Russakovsky O, Deng J, Su H, Krause J, Satheesh S, Ma S, et al. Imagenet large scale visual recognition challenge. Int J Comput Vision. 2015;115(Suppl 3):211–252. doi: 10.1007/s11263-015-0816-y. [DOI] [Google Scholar]
- 16.Cireşan DC, Giusti A, Gambardella LM, Schmidhuber J (2013) Mitosis detection in breast cancer histology images with deep neural networks. In: Proceedings of the medical image computing and computer-assisted intervention, pp. 411–418 [DOI] [PubMed]
- 17.Smits SM, Leyte A. Clinical performance evaluation of the cellavision image capture system in the white blood cell differential on peripheral blood smears. J Clin Pathol. 2014;67:168–172. doi: 10.1136/jclinpath-2013-201737. [DOI] [PubMed] [Google Scholar]
- 18.Rollins-Raval MA, Raval JS, Contis L. Experience with CellaVision DM96 for peripheral blood differentials in a large multi-center academic hospital system. J Pathol Inform. 2012;3:29. doi: 10.4103/2153-3539.100154. [DOI] [PMC free article] [PubMed] [Google Scholar]