Abstract
Immunomodulatory properties of mesenchymal stem cells (MSC) are key components of their successful applications in clinical setting. However, treatments based on MSC immunomodulation need understanding of cell characteristics before cell transplantation. We used live-imaging to test the suitability of the MSC motility as a parameter for quick prediction of the immunomodulatory potential of human MSC in regulating the activity of stimulated peripheral blood mononuclear cells (PBMC) in vitro. Bone marrow MSC, from various donors and in vitro passages, were cultured with or without stimulated PBMC. After seven days, immunomodulation was assessed by measuring PBMC proliferation, IgG production and cytokine secretion in MSC and PBMC monocultures and co-cultures, and results were correlated to MSC motility. In co-culture, we observed that MSC successfully inhibited PBMC activity, reducing PBMC proliferation and IgG production compared to PBMC monoculture. MSC modulated PBMC to reduce the secretion of TNFα and IL-10, increase IL-6, G-CSF and MCP-1, while GM-CSF was not affected. By live-imaging tracking of cell trajectories, we observed that fast moving MSC were inhibiting more efficiently stimulated PBMC compared to slow ones. In co-culture, fast MSC were more effective in inhibiting IgG production (˜30% less IgG), and secreted higher levels of IL-10 (˜10% increase) and GM-CSF (˜20% increase) compared to slower cells. Furthermore, fast MSC in monocultures produced 2.3-fold more IL-6, 1.5-fold MCP-1 and 1.2-fold G-CSF in comparison to slower cells. In conclusion, live-imaging cell tracking allowed us to develop an indicative assay of the immune-regulatory potential of MSC prior to in vivo administration. Key Words: Human mesenchymal stem cells, Immunomodulatory potential, In vitro cell motility, Stem cell transplantation
Keywords: Human mesenchymal stem cells, Immunomodulatory potential, In vitro cell motility, Stem cell transplantation
Introduction
Human mesenchymal stem cells (MSC) are multipotent stromal cells with the ability to undergo extensive proliferation[1,2], produce a large number of cytokines[3], and the potential to differentiate into several cell lineages, such as adipocytes, chondrocytes, myocytes and osteoblasts[4]. Because of these defining characteristics, MSC emerged as one of the favorite candidates for cell-based therapies and tissue engineering approaches. Clinical trials have shown the beneficial effects of MSC application in critical health conditions like myocardial infarction[5], spinal cord injuries[6] and liver cirrhosis[7]. Additionally to their tissue restorative capacity, MSC also showed extensive immunomodulatory effects[8] making them potentially applicable in the treatment of immune-related diseases, such as graft versus host disease[9], systemic lupus erythematosus and multiple sclerosis[10].
The exact mechanism by which MSC regulate the immune system is still a matter of debate, but it is likely to be a co-effect of direct contact between cells and secretion of soluble factors. The complexity of the immunomodulatory mechanism is represented by the involvement of more than a dozen soluble factors which were shown to act on both innate and adaptive immune cells[11,12]. Among the most discussed secreted immunosuppressive factors are indoleamine-pyrrole 2,3-dioxygenase[13], prostaglandin E2[14], transforming growth factor-β[15] and nitric oxide[16]. Secretion of those soluble factors is dependent on the microenvironment of the MSC, for example tumor necrosis factor α (TNF-α), interleukin 1-β (IL1-β) or interferon-γ (IFN-γ) are required for the activation of MSC induced immunomodulation[17,18]. MSC were reported to mediate a shift from a Th1 driven response to rather an anti-inflammatory Th2 response[19] which is characterized by lower levels of interleukin-2 (IL-2), IFN-Γ and TNF-α and higher concentrations of interleukin-4 (IL-4), IL-5, IL-10 and IL-13. MSC can also secrete interleukin-6 (IL-6) which was shown to inhibit the differentiation of monocytes into antigen presenting dendritic cells[20]. Furthermore, IL-6 produced by MSC promotes neutrophil survival and expansion when combined with granulocyte macrophage colony-stimulating factor (GM-CSF)[21]. Additionally, it was found that by producing monocyte chemoattractant protein-1 (MCP-1 or CCL2), MSC are able to inhibit IgG production of plasma cells[22,23] and induce T-cells apoptosis via the FAS ligand-dependent FAS pathway[24].
Despite all promising researches, clinical trials with autologous MSC transplantations can have uncertain outcomes, partially caused by the wide intra- and inter-donor variability of MSC populations[25]. Such variations include diverse differentiation potential, cell morphology[26] or cell motility. Nowadays, there is a consensus that MSC therapies would be better predictable and more reproducible if we could evaluate and then use only cells with standardized characteristics.
We have demonstrated previously that in vitro MSC motility can be a useful parameter to quickly characterize and distinguish the differentiation potential of MSC populations[27]. Despite the observation that MSC were moving randomly and without directionality, we could determine that slow moving MSC were more likely to be senescent when compared with fast moving ones. However, average moving cells outperformed the rest with their ability to differentiate showing that MSC motility is a good predictor for the differentiation potential. We then wanted to investigate if a correlation with the immunomodulatory capacity of MSC also exists.
In this study, we tested the suitability of the MSC motility as a parameter for quick prediction of the immunomodulatory potential of the cells. We investigated by live-imaging microscopy the in vitro motility of human MSC isolated from different donors at various culture passages and correlated the velocity to their immunomodulatory capacities in co-culture with allogeneic peripheral blood mononuclear cells (PBMC). Immunomodulation was assessed by measuring the PBMC proliferation, IgG production and cytokine secretion (listed in Table 1) in the MSC and PBMC co-cultures and results were compared to PBMC and MSC monocultures.
Table 1: List of analysed cytokines and their expression by MSC.
Materials and Methods
Mesenchymal stem cells (MSC) isolation and expansion
Bone marrow (BM) samples were harvested from the iliac crest of donors undergoing spine surgery. The study was ethically approved by the ethics committee of Canton of Lucerne (Study number: 730). Written informed consent was obtained from all the participants and this procedure was also approved by the approving body. MSC were isolated from BM of ten donors (4 females and 6 males; average age: 43 years; range: 17-59 years). The BM aspirates were immediately resuspended in 3.8% sodium citrate and phosphate buffered saline (PBS, Applichem - Axonlab, Baden, Switzerland) and then filtered through a 100 μm cell strainer to remove clots (Falcon - Faust, Schaffhausen, Switzerland). Mononuclear cells were separated by H-Lympholyte Cell Separation Media gradient centrifugation (density 1.077 g/mL; Cedarlane - Bio Concept, Allschwil, Switzerland) in Leucosep tubes (Huberlab, Reinach, Switzerland) at 800 g for 15 minutes, washed with PBS, centrifuged again at 210 g for 10 minutes and plated at a density of 1 × 10⁵ cells/cm2 in tissue culture flasks (TPP - Faust) in α-MEM, supplemented with 10% fetal bovine serum (FBS) (both Amimed — Bio Concept), (100 units/mL) penicillin / (100 mg/mL) streptomycin, 2.5 μg/ml amphotericin B (both Gibco — LuBioScience GmbH, Lucerne, Switzerland) at 37°C in a humid atmosphere containing 5% CO2. After two days, non-adherent cells were discarded, whereas adherent cells were cultured in growing medium consisting of DMEM/Ham’s F12, supplemented with 10% foetal bovine serum (FBS) (both Amimed), (100 units/mL) penicillin / (100 mg/mL) streptomycin (Pen-Strep), 2.5 μg/ml Amphotericin B (all Gibco) and 5 ng/ml recombinant basic fibroblast growth factor (bFGF, Peprotech — LuBioScience), followed by media change three times per week. At 80% confluency, MSC were frozen and stored at - 150°C.
Phenotypic characterization of MSC
Bone marrow-derived mononuclear cells (1 x 10⁶ cells) were plated in 10 cm-Primaria cell-culture dishes (Falcon) and cultured with growing medium. After 14 days, cell colonies were washed with PBS, fixed with 100% methanol, and stained with Giemsa solution (all these reagents were from Applichem).
Following cell culture expansion, CD44, CD90 and CD105 positive and CD14 negative MSC markers were analyzed by flow cytometry. Briefly, cells were incubated with CD14-FITC (NB100-77759, Novus Biological - LuBioScience), CD44-FITC (NBP1-41278, Novus Biological), CD90-FITC (NBP1-96125, Novus Biological) and CD105-FITC (MCA1557A488T, AbD Serotec - LuBioScience) antibodies in PBS for one hour at 4°C, washed and resuspended in PBS. Cell fluorescence was evaluated with FACScalibur flow cytometer (Becton Dickinson) and data were analyzed using FlowJo v.10.0 software (Treestar, Ashland, OR, USA).
Peripheral blood mononuclear cells (PBMC) isolation and characterization
Venous blood (45 ml) was collected from a healthy male donor (27 years old) in S-Monovettes containing EDTA (S-Monovettes, 9 ml K3E; Sarstedt, Nümbrecht, Germany). Peripheral blood mononuclear cells (PBMC) were isolated by H-Lympholyte Cell Separation Media gradient centrifugation in a Leucosep tube at 800 g and room temperature, for 20 minutes. The PBMC-containing buffy coat was carefully retrieved and washed with PBS, followed by a centrifugation at 210 g and room temperature for 10 minutes. The obtained PBMC pellet was resuspended in RPMI-1640 medium (Amimed; Bio Concept) supplemented with 10% FBS, Pen-Strep and amphotericin B.
Flow cytometric analysis of PBMC with CD4 (APC Mouse Anti-Human CD4 Clone RPA-T4, BD Bioscience, Allschwil, Switzerland) and CD8 (PE Mouse Anti-Human CD8 Clone RPA-T8, BD Bioscience, Allschwil, Switzerland) surface markers was performed after seven days in co-culture with MSC and in PBMC monoculture. Cells were incubated with antibodies in PBS for 15 minutes at room temperature, washed and resuspended in PBS. Cell fluorescence was evaluated with FACScalibur flow cytometer and data were analyzed using FlowJo v.10.0 software.
PBMC stimulation before co-culture
PBMC were stimulated in a cocktail adapted from a previous work[28], consisting of 60 ng/ml human recombinant interleukin-2 (IL-2), 25 ng/ml Interleukin-10 (IL-10), 100 ng/ml Interleukin-21 (IL-21) (all from BioBasic Inc.; Stephan Klee Trading and Consulting, Sissach, Switzerland), the synthetic unmethylated oligodeoxynucleotide deoxycytosine-deoxyguanosine (CpG2429: tcgtcgttttcggcggccgccg, 360 nM[29] Microsynth AG, Balgach, Switzerland) and 2.5 μg/ml pokeweed mitogen (Sigma-Aldrich Chemie GmbH, Buchs, Switzerland) in RPMI-1640 medium (Amimed; Bio Concept) + 10% FBS. After addition of the stimulating cocktail, PBMC were incubated overnight at 37°C in the incubator (5% CO2), then washed with PBS, centrifuged at 210 g at room temperature for 10 minutes, and re-suspended in media for co-culture with MSC, or as a control.
MSC and PBMC co-cultures
MSC were split in three groups for co-culture with PBMC, in vitro cell tracking and cell metabolic activity (day 0). To prepare co-culture with PBMC, in vitro cell tracking and cell metabolic activity (day 0). To prepare co-culture with PBMC, MSC (2 x 10⁴ cells/well) were seeded in 96-well plates (each donor in quadruplicate; flat bottom culture test plates; TPP) in growing medium, and left for plastic attachment for 4 hours. After the incubation time, growing medium was removed and stimulated and unstimulated (negative control) PBMC (1.5 x 10⁵ cells/well) were co-cultured with MSC in a final volume of 300 μl/well of RPMI-1640 medium (Amimed; Bio Concept) supplemented with 10% FBS, (100 units/mL), Pen-Strep and amphotericin B. This co-culture was maintained for 7 days at 37°C and 5% CO2.
The ratio MSC:PBMC used (2:15) lies in range of previous work on immunosuppression[30]. To study the correlation between MSC immunomodulatory capacity and cell motility, our preliminary test showed that MSC inhibited more efficiently IgG production at the ratio of 2:15 than 1:15.
Cell metabolic activity
MSC (2 x 10⁴ cells/well) were seeded in 96-well plates (each donor in triplicate; flat bottom culture test plates) in growing medium, left overnight to adhere to the plate and then the cell activity was assessed by resazurin reduction assay. MSC were incubated (day 1) in resazurin solution - 15 ng/mL resazurin, 2.5 ng/mL methylene blue, 0.1 mM potassium ferricyanide, 0.1 mM potassium ferrocyanide (all Applichem) in growing medium without bFGF - for 6 hours and bottom well fluoresce absorbance was measured (λex= 535 nm and λem= 595 nm) using a Multimode Detector (DTX 880; Beckman Coulter, Nyon, Switzerland).
In vitro cell tracking of MSC
MSC (day 0) at in vitro passage 2-3 (n=7) and passage 6 (n=3) were plated at a density of 5.6 x 10³ cells/cm2. After 3 hours, the movements of the adherent cells started to be recorded using an inverted phase-contrast microscope equipped with a high-sensitive camera (Olympus, Tokyo, Japan, http://www.olympus-global.com) at 40X magnification. The interval between image acquisitions was 10 minutes, using the Xcellence software program (Olympus) over a 24-hour period. Video sequences were analyzed using ImageJ (NIH, Bethesda, MD, http://www.nih.gov/ij) and the plugin MTrackJ, which allows manual tracking of individual cell trails. Analyses were only made for cells moving within the plane of focus. The full length of the track was determined as the distance from the first point to the last point of the track, and the cell speed was measured as mm/day. We defined three representative groups for cell motility: slow moving MSC (0.1-0.2 mm/day), medium moving MSC (0.4-0.5 mm/day) and fast moving MSC (0.9-1.0 mm/day).
PBMC proliferation assay
Before stimulation, the isolated PBMC were stained with the fluorescent cell proliferation indicator CytoTell green (AAT Bioquest; LuBioScience) according to the manufactures protocol (20 minutes incubation at room temperature in 1:600 diluted dye). The proliferative response is the percentage of cells that underwent at least 1 cell division. The proliferative response of stimulated PBMC in co-cultures (n=10) and PBMC controls (n=1) was measured after 7 days of incubation by flow cytometry (total of 30’000 events gated) using the intracellular CytoTell dilution method and the viability staining solution 7-AAD (eBioscience, Vienna, Austria). Data was analyzed using FlowJo software.
IgG production assay
After 7 days of incubation, the amount of secreted IgG antibody in the supernatant t of stimulated co-cultures (n=10), PBMC controls (n=1) and reference donors (n=42; age range: 23-58 years (mean: 42.8 years), and interquartile range IQR: 19) was quantified using a standard indirect ELISA, as follow: a 96-well plate (Nunc MaxiSorp, Fluka Chemie GmbH, Buchs, Switzerland) was coated with 1 ng/μL Protein A (LuBioScience) in PBS and incubated overnight at 4 °C, then washed with PBS with a plate washer (Beckman-Coulter, Nyon, Switzerland), and non-specific binding sites were blocked for 2 hours at room temperature with blocking solution containing 5% TopBlock (LuBioScience) in PBS. After washing wells with PBS, cell culture supernatants (in triplicate for each donor) — cleared of cell debris by centrifugation and diluted threefold in PBS — were incubated for 2 hours at room temperature. Supernatants were then removed and the wells washed with PBS. Anti-human-IgG HRP-conjugated secondary antibody (A80-119P Bethyl) diluted 1:5000 in blocking buffer was incubated for 1 hour at room temperature. IgG were determined by colorimetric measurement of the product of the enzymatic reaction mediated by HRP and o-phenylenediamine solution (15.3 mg/mL in citrate buffer, pH 5.0, Applichem — Axonlab). The reaction was stopped with 10% sulphuric acid. Absorbance was measured at 450 nm by DTX 880 Multimode Detector and IgG concentration (ng/mL) was determined from dilutions of purified human IgG (Bethyl — LuBioScience).
Cytokine measurements
The concentrations of cytokines and chemokines were analyzed in the supernatants of monoculture of MSC, and co-cultures of PBMC and MSC after 7 days incubation, by Bio-Plex Pro Cytokine, Chemokine and Growth Factor Assay (Bio-Rad Laboratories AG — Cressier, Switzerland). Data were collected and analyzed using a Bio-Rad Bio-Plex 200 instrument equipped with Bio-Plex Manager software (Bio-Rad). We measured the concentrations of interleukin-2 (IL-2), interleukin-4 (IL-4), interleukin-6 (IL-6), interleukin-10 (IL-10), granulocyte-colony stimulating factor (G-CSF), granulocyte-macrophage colony-stimulating factor (GM-CSF), monocyte chemoattractant protein 1 (MCP1) and tumor necrosis factor-alpha (TNF-α).
Statistical analysis
Cytokine and IgG concentrations, and proliferative responses were presented in bar charts as mean ± standard deviation (SD). Non-parametric Mann-Whitney-Wilcoxon U-test for related variables was used to determine significant differences between samples, as a normal distribution of the data could not be guaranteed in this data set. For all tests, p < 0.05 was considered significant. Data analysis was performed with SPSS 24.0 for Windows (SPSS Inc.).
Scatterplot were produced for culture concentration versus cell motility and smoothed via semiparametric regression models using the mixed model representation of penalized splines[31] as implemented in the SemiPar package in R (R Foundation for Statistical Computing, Vienna, Austria, http://www.r-project.org). Scatterplots and scatterplot smoothers were computed using R, version 2.14.2, for Windows (R Foundation for Statistical Computing). The confidence bands represent the certainty about the average trend. They capture the high variation in the data points. A single future prediction may not be well accordant to the suggested trend as interpolated; however, on average (of many predictions) it will be.
Results
Mesenchymal stem cells (MSC) characterization
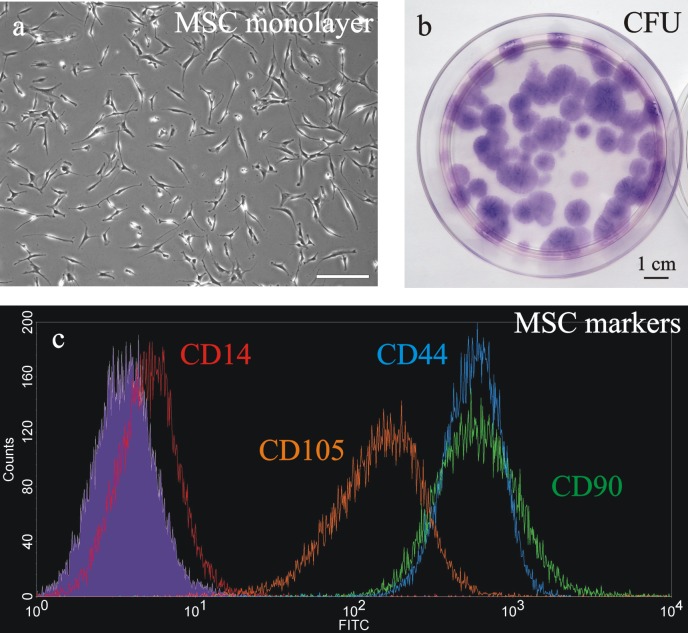
The bone marrow-isolated MSC were initially characterized by their elongated fibroblastic cellular phenotype (Figure 1A) and by their ability to generate colony forming units (Figure 1B). Furthermore, MSC were characterized by flow cytometry analysis with the positive mesenchymal stem cell markers CD44, CD90, and CD105 and the negative monocyte-related marker CD14 (Figure 1C).
Figure 1.
MSC characterization was based on their peculiar fibroblast-like morphology (a, entire scale bar is 200 μm), ability to form colonies (stained with Giemsa; b) and expression of the positive markers CD44 (blue line), CD90 (green line), CD105 (orange line) and the negative marker CD14 (red line), tested by flow cytometry analysis (grey line = unstained control; c).
IgG production by peripheral blood mononuclear cells (PBMC) in co-culture
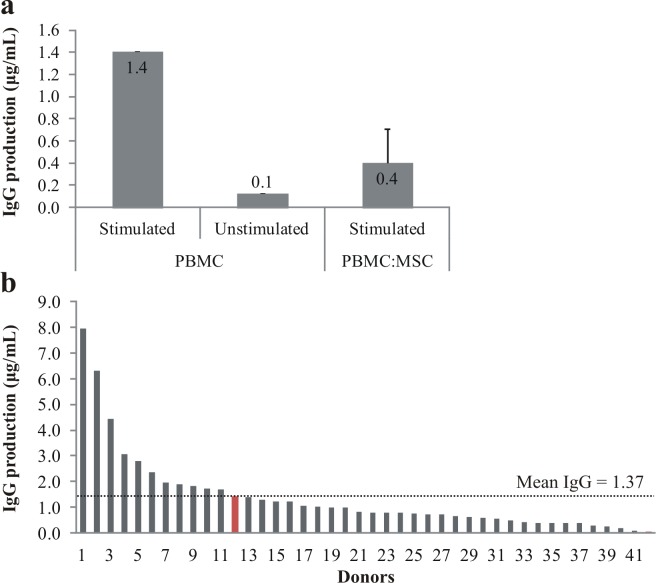
IgG production inhibition by MSC was tested on stimulated allogeneic PBMC in co-culture for 1 week (Figure 2A). Monocultures of MSC and PBMC (unstimulated or stimulated) served as a control. When co-cultured with MSC, stimulated PBMC decreased IgG production by 71%, while unstimulated PBMC IgG production was only a tenth of the stimulated control. Overall, PBMC production of IgG by the donor used in this project was very close (1.41 μg/ml) to the mean IgG production calculated out of 42 donors (1.37 μg/ml, Figure 2B).
Figure 2.
Effects of stimulation cocktail on IgG production by PBMC. After seven days culture, the immuno-suppressive action of MSC on PBMC (a) was determined by measuring IgG production in stimulated (n=1) and unstimulated (n=1) PBMC monocultures, as well as in stimulated PBMC and MSC co-cultures (n=10; data represented as mean ± SD). On the bottom (b), comparison of IgG production between 42 donors (red bar = sample used to test the immuno-suppressive action of MSC).
MSC modulated peripheral blood mononuclear cells (PBMC) activity in co-culture
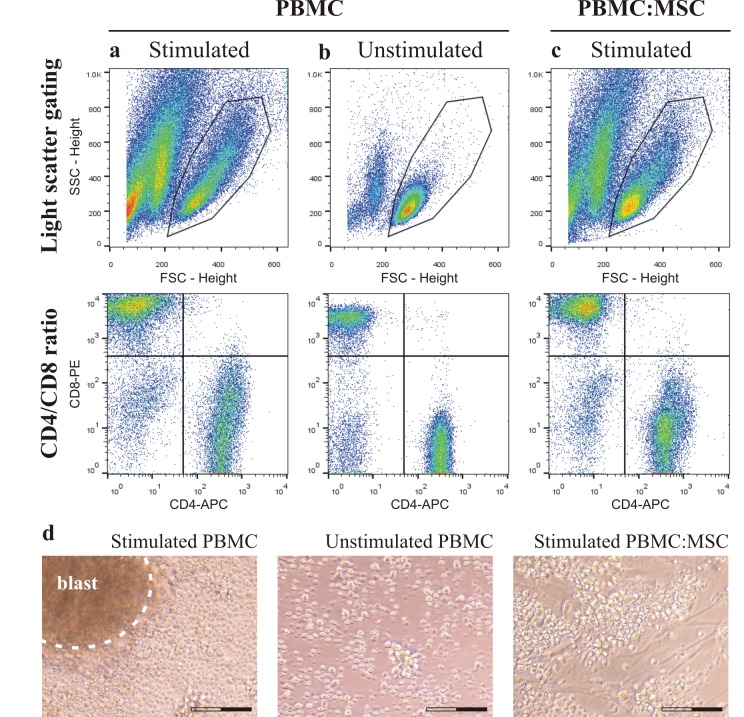
After seven days culture, stimulated (column A) and unstimulated (column B) PBMC, and stimulated PBMC isolated from co-culture with MSC (column C) characterization was based on gating light scattered by cells (Figure 3: top row), CD4/CD8 ratio of T-cells (Figure 3: middle row) and cell morphology (Figure 3D). The viability (7-AAD assay) of the stimulated PBMC in monocultures was 95% and in co-cultures 96%. Forward (FSC) and side scattering profiles of stimulated PBMC showed a large spreading and activation of cells compared to unstimulated PBMC, and the results in monoculture were similar to co-culture with MSC. Analysis of mean FSC intensity showed that stimulated PBMC increased cell size of 26% in comparison to unstimulated PBMC, and in co-culture with MSC only of 13%. CD4/CD8 ratios of unstimulated PBMC in monocultures and in co-cultures with MSC were identical (ratio = 1.55), while stimulated PBMC in monoculture (ratio = 0.70) had a lower ratio compared to PBMC in co-culture (ratio = 1.09). Immunosuppression by MSC significantly prevented blastogenesis of stimulated PBMC already after three days of co-culture.
Figure 3.
After seven days culture, stimulated (column a) and unstimulated (column b) PBMC, and stimulated PBMC (column c), isolated from co-culture with MSC, were morphologically characterized. Images from a representative sample show light scattered gating of cells (side scatter, SSC, and forward scatter, FSC; top row) and CD4/CD8 ratio of T-cells (middle row). On the bottom (d), microphotographs taken after three days show the presence or lack of lymphocyte blast formation in the same samples (entire scale bar is 100 μm).
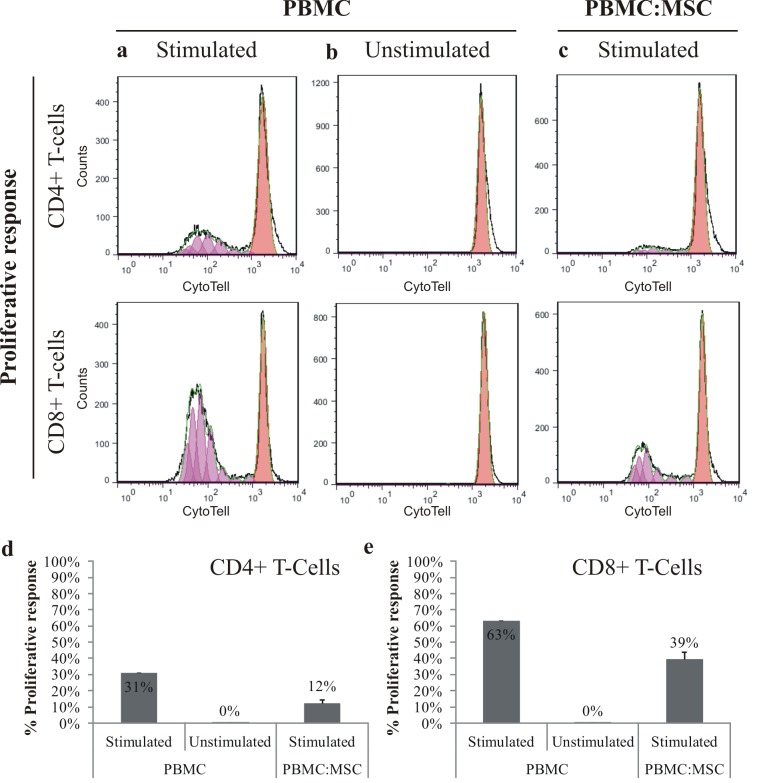
The immunosuppressive effects of MSC on PBMC were determined by cell proliferative response of CD4+ T-cells and CD8+ T-cells (Figure 4: top rows). MSC inhibited the proliferation of both CD4+ (Figure 4D) and CD8+ T-cells (Figure. 4E), especially CD4+ T-cells (2.6-fold) in comparison to CD8+ T-cells (1.6-fold), while unstimulated PBMC were not dividing at all.
Figure 4.
After seven days culture, effectiveness of immunosuppressive action of MSC on PBMC was determined by measuring cell proliferative response of stimulated (column a) and unstimulated (column b) PBMC, and stimulated PBMC (column c), isolated from co-culture with MSC. Top rows represent the proliferative response of CD4+ T-cells and CD8+ T-cells, in a representative sample (CytoTell staining). Results of the proliferative response of CD4+ T-cells (d) and CD8+ T-cells (e) were summarized (stimulated (n=1) and unstimulated (n=1) PBMC monocultures, stimulated PBMC and MSC co-cultures (n=10); data represented as mean ± SD).
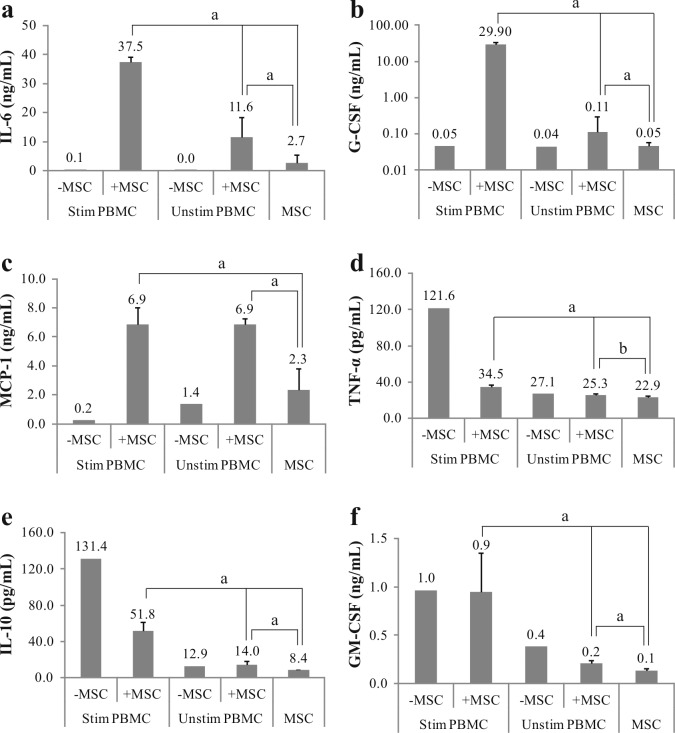
We analyzed the concentration of eight inflammation-related cytokines in supernatants of controls (monocultures) and co-cultures (Figure 5), namely interleukin-6 (IL-6), granulocyte-colony stimulating factor (G-CSF), monocyte chemoattractant protein-1 (MCP-1), interleukin-10 (IL-10), tumor necrosis factor (TNF-α) and granulocyte-macrophage colony-stimulating factor (GM-CSF). The concentrations of interleukin-2 and -4 (IL-2 and IL-4) were at or below the detection limit (data not shown). Co-culture of MSC with stimulated PBMC led to substantially increased IL-6 (Figure 5A), G-CSF (Figure 5B) and MCP-1 (Figure 5C) concentrations. In comparison to stimulated PBMC monoculture, the average cytokine increase corresponded to 340-fold for IL-6, 600-fold for G-CSF and 30-fold for MCP-1. Furthermore, the increase in G-CSF significantly correlated with in vitro culture passage of MSC. In stimulated PBMC:MSC co-culture, late passage MSC (P6) produced ˜20% more G-CSF (p < 0.01) and ˜10% more IL-6 (p < 0.05) in comparison to early passage MSC (P2-P3) (data not shown). On the other hand, the presence of MSC inhibited the production of TNF-α (Figure 5D) and IL-10 (Figure 5E), 3.5- and 2.5-fold respectively. GM-CSF concentrations were not influenced by MSC (Figure 5F).
Figure 5.
MSC and PBMC had a reciprocal influence in the production of cytokines. After seven days, supernatant concentration of IL-6 (a), G-CSF (b), MCP-1 (c), TNF-α (d), IL-10 (e) and GM-CSF (f) was measured in MSC monoculture (n=10), stimulated (n=1) and unstimulated (n=1) PBMC monocultures, and co-culture with or without MSC (n=10). Data was acquired by Bio-Plex analysis and represented as mean ± SD (a = p<0.01; b = p<0.05).
MSC modulated the secretion of cytokines also in unstimulated PBMC co-culture, resulting in a 400-fold increase of IL-6, 3-fold increase of G-CSF and 5-fold increase of MCP-1 productions, compared to PBMC monoculture. Although IL-10 and TNF-α levels were unaffected by the MSC, GM-CSF was inhibited 1.8-fold in comparison to PBMC monoculture.
Monoculture of MSC produced mostly IL-6 (2.7 ng/ml) followed by MCP-1 (2.3 ng/ml), and in lower amount GM-CSF (140 pg/ml), G-CSF (50 pg/ml), TNF-α (23 pg/ml) and IL-10 (8.4 pg/ml). Beside, compared to unstimulated cells, stimulation of PBMC in monoculture increased the production of TNF-α, IL-10 and GM-CSF, and reduced MCP-1 (no changes in IL-6 and G-CSF levels).
MSC in vitro motility and immunosuppressive potential
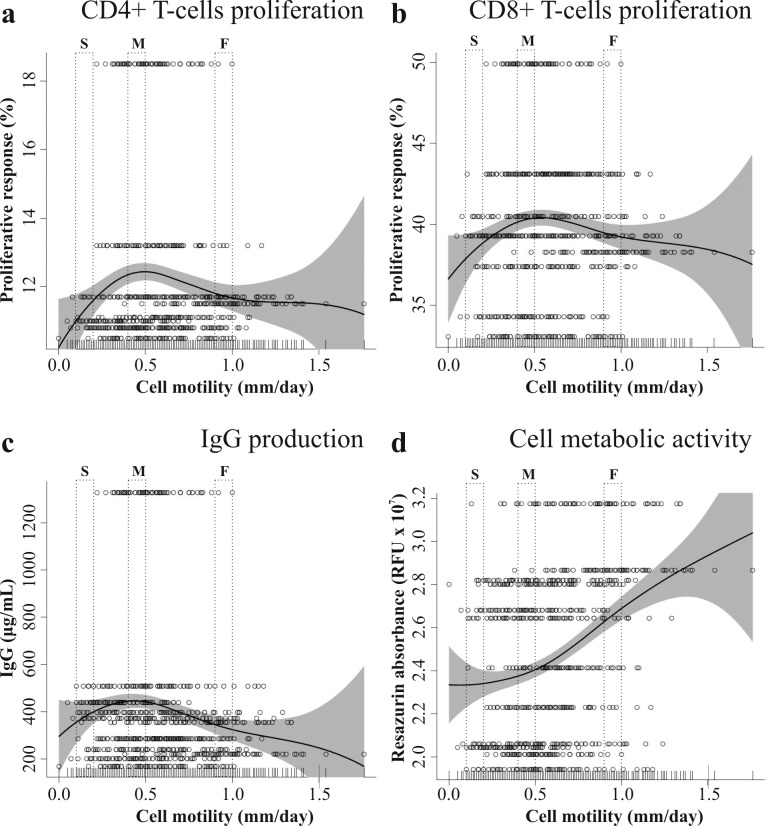
We measured cell motility of MSC by time-lapse microscopy recording. For each donor, 70 MSC were tracked for 24 hours and their motility was plotted against proliferative response of CD4+ T-cells (Figure 6A) and CD8+ T-cells (Figure 6B), and IgG production (Figure 6C) by stimulated PBMC in co-culture. We observed that mostly slow and fast moving MSC suppressed PBMC proliferation and IgG production, even though changes in proliferation were small in both cases. Slow moving MSC (0.1-0.2 mm/day) corresponded to CD4+ T-cells proliferative response of 11.6%, medium moving MSC (0.4-0.5 mm/day) of 12.2% and fast moving MSC (0.9-1.0 mm/day) of 11.9%. Furthermore, slow moving MSC corresponded to CD8+ T-cells proliferative response of 38.4%, medium moving MSC of 40.3% and fast moving MSC of 39.3%.
Figure 6.
Proliferative response of CD4+ T-cells (a) and CD8+ T-cells (b), and IgG production (c) of stimulated PBMC in co-culture with MSC plotted against cell motility. The metabolic activity (d) of MSC in monoculture was also plotted against cell motility. Each row (70 cells) represents a MSC population. Abbreviations: O = single cells; — = penalized spline smoother; grey area = confidence band. (S = slow, M = middle, F = fast moving cells)
PBMC produced in correspondence of slow MSC 80% IgG (356 μg/ml), medium speed MSCs 100% (447 μg/ml) and fast moving MSCs 77% (345 μg/ml). The metabolic activity of MSC was plotted against cell motility (Figure 6D) and as expected fast moving MSC were also the most metabolically active. Compared to slow moving MSC, fast moving MSC were ˜20% more active and medium moving ˜10%.
MSC in vitro motility in monoculture and cytokine concentrations
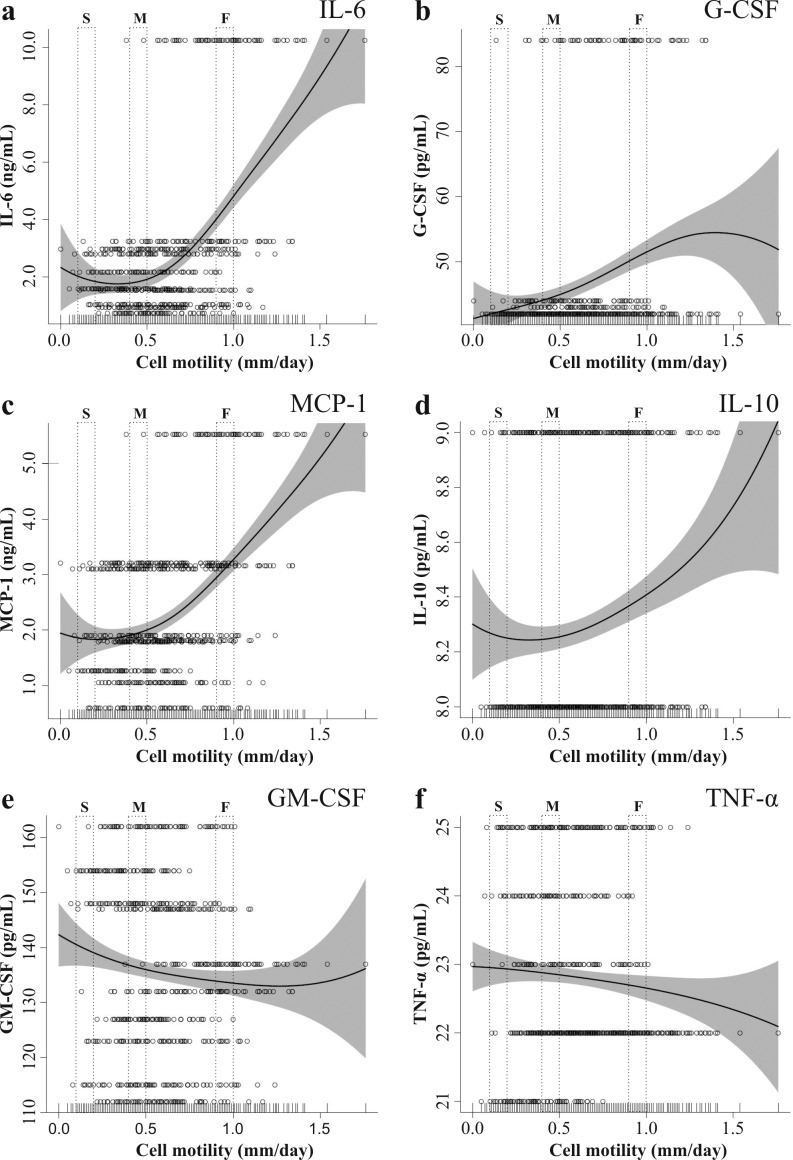
The motility of MSC was plotted against cytokine concentrations in monocultures after one week of incubation (Figure 7). Fast moving stem cells produced 2.3-fold more IL-6 (Figure 7A), 1.2-fold more G-CSF (Figure 7B) and 1.5 fold-more MCP-1 (Figure 7C) than slower speed cells. On the other hand, GM-CSF (Figure 7E) was moderately reduced (6% difference between slow and fast) with increasing MSC speed. Secretion of IL-10 (Figure 7D) and TNF-α (Figure 7F) by MSC was low and independent of MSC motility.
Figure 7.
MSC monoculture concentration of IL-6 (a), G-CSF (b), MCP-1 (c), IL-10 (d), GM-CSF (e) ) and TNF-α (f) plotted against cell motility. Each row (70 cells) represents a MSC population. Abbreviations: O = single cells; — = penalized spline smoother; grey area = confidence band. (S = slow, M = middle, F = fast moving cells)
MSC in vitro motility influence on cytokine production in co-culture with stimulated PBMC
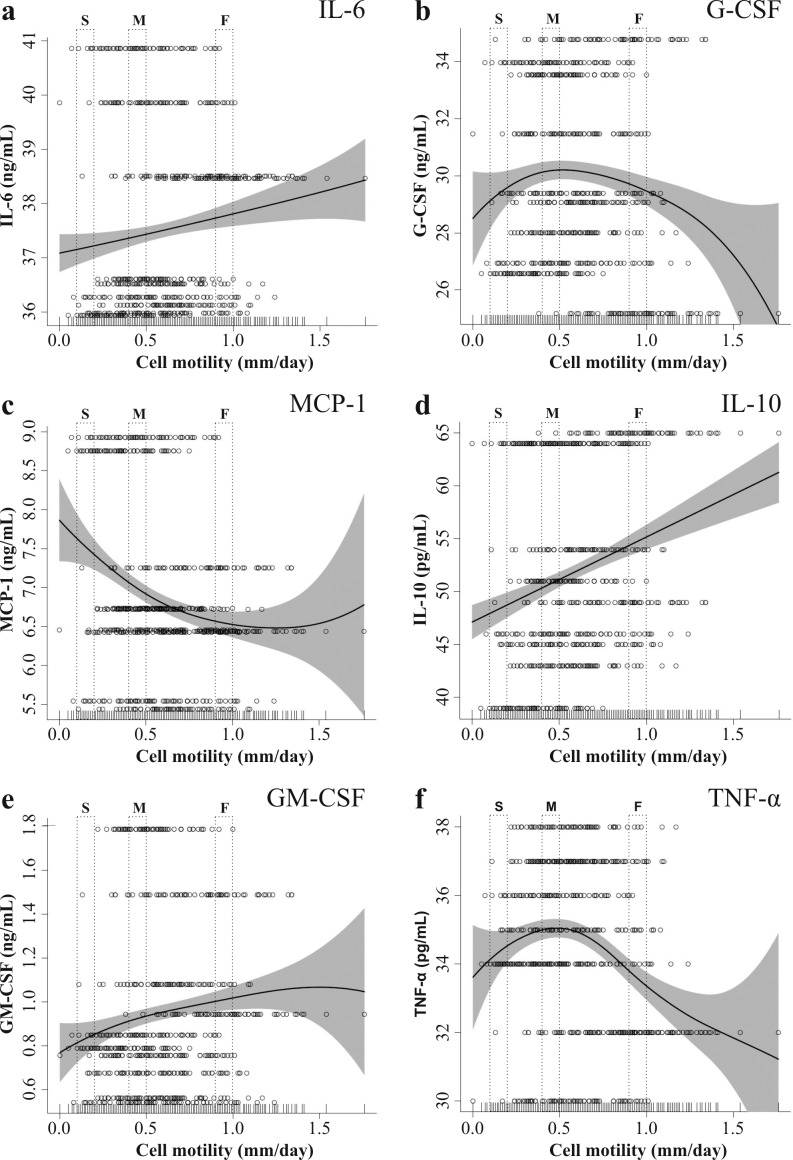
In co-culture with stimulated PBMC, cell motility of MSC was plotted against cytokine productions after one week of incubation (Figure 8). Although IL-6 concentration was strongly increased compared to MSC monoculture, the difference between slow and fast MSC was only 1.6% (Figure 8A). Also, the concentrations of G-CSF (Figure 8B) and TNF-α (Figure 8F) were independent of MSC motility with a maximum difference of 3% respectively 4% between speeds. The production of MCP-1 (Figure 8C) was negatively correlated with MSC motility. In correspondence of slow MSC, MCP-1 production was 14% higher compared to fast MSC. On the other hand, increased IL-10 (Figure 8D) and GM-CSF (Figure 8E) were produced in correspondence of fast MSC. IL-10 and GM-CSF differences between slow and fast cells were 12% and 18% respectively.
Figure 8.
Stimulated PBMC + MSC co-culture concentration of IL-6 (a), G-CSF (b), MCP-1 (c), IL-10 (d), GM-CSF (e) and TNF-α (f) plotted against cell motility. Each row (70 cells) represents a MSC population. Abbreviations: O = single cells; — = penalized spline smoother; grey area = confidence band. (S = slow, M = middle, F = fast moving cells)
Discussion
In this study, we found that in vitro mesenchymal stem cells (MSC) motility correlates to some aspects of their immunosuppressive potential and production capacity of some cytokines. MSC immunomodulation effects were determined in mixed lymphocyte reaction assay, a broadly used method which provides direct contact and allows most fundamental interactions between cells. In co-cultures with peripheral blood mononuclear cells (PBMC), PBMC blastogenesis was prevented in all MSC co-cultured samples and MSC successfully inhibited CD4+ T-cells and CD8+ T-cells proliferation but also the production of IgG. We stratified the MSC populations according to our empirical observations in three representative cell motility groups: slow moving (0.1-0.2 mm/day), medium moving (0.4-0.5 mm/day) and fast moving (0.9-1.0 mm/day). In co-culture with PBMC, fast moving MSC inhibited more effectively IgG production and proliferation of PBMC in comparison to slower cells, and were the most metabolically active. Interestingly, in the case of PBMC co-cultured with fast MSC, reduced secretion of G-CSF and TNF-α were observed, along with increased IL-10 secretion. This particular combination of cytokine secretion is peculiar of M2 phenotype of macrophages (involved in parasite control, tissue remodelling, immune regulation and phagocytic activity), which are characterized by higher anti-inflammatory potential compared to M1 macrophages (producing pro-inflammatory cytokines, mediating resistance to pathogens and promoting Th1 responses)[32]. The ability of MSCs to shift macrophages toward an M2 phenotype in vitro has been already described[33], and our data on secretion of cytokines suggest that fast moving MSC correlate better to M2 phenotype shift. Cytokine expression analysis of MSC in monoculture showed that IL-6 and MCP-1 were secreted in large amount by faster cells compared to slower ones. As a limitation, we cannot discuss properly the secretion origins of MCP-1 in co-cultures because in our experimental setting we cannot discriminate which type of cell — MSC or PBMC — produced this cytokine.
Our results suggest that within the same MSC population, sub-groups of cells have different roles in modulating the action of PBMC. There might be a possibility that the observed intra-donor variability of MSC motility extrapolates even to the stem cell variability between people. This speculation is supported by the observation that MSC isolated from patients with multiple sclerosis had functional differences compared to healthy controls, such as reduced anti-proliferative capacity and lower secretion of anti-inflammatory cytokines[34]. The dynamics occurring between sub-populations of MSC with different cell motility may play an important role for their overall immune-regulatory capacity. To better understand these dynamics, we also investigated the release of cytokines and chemokines by MSC, which are known to play a key role in the suppressive signalling.
Despite the complex nature of cytokine signalling, in co-cultures we could discriminate distinct responses related to MSC regulatory abilities. The correlation between MSC motility and immunomodulation was based on the measurement in culture medium of the cytokines IL-2, IL-4, IL-6, IL-10, TNF-α, G-CSF, GM-CSF and MCP-1, shown previously to be relevant because of their anti-and pro-inflammatory properties and expression by both MSC and PBMC (Table 1). Stimulated PBMC secreted large amount of IL-10, TNF-α and GM-CSF, while unstimulated PBMC produced mostly MCP-1 and GM-CSF. On the other hand, MSC in monocultures produced only relevant amount of MCP-1 and IL-6, and negligible quantity of the other cytokines, as previously described in the literature[35]. No cross-talk from the cytokines used in the stimulation cocktail was expected since the pre-stimulated PBMC were thoroughly washed ahead of their culturing.
The immuno-suppressive action of MSC in co-culture with stimulated PBMC was demonstrated by the reduced PBMC secretion of pro-inflammatory cytokines (TNF-α) and increased MSC secretion of anti-inflammatory cytokines (IL-6, MCP-1 and G-CSF). Unexpectedly, the anti-inflammatory cytokine IL-10 was reduced by MSC, but a growing body of evidence shows that IL-10 action is multifactorial and in some settings may not be the previously thought inhibitor of immune functions[36,37]. Furthermore, IL-10 was described to stimulate IgG isotype switch in B-lymphocytes[38] and ultimately has been used as a main component of PBMC stimulation cocktail. The secretion by stimulated PBMC of another important cytokine, IL-6, was observed in co-culture with MSC, indicating an anti-inflammatory action by IL-6 in this particular setting[39,40]. Also MCP-1 had an anti-inflammatory pattern, where its expression was higher in both co-cultures compared to monocultures. Not surprisingly, the other immuno-modulatory molecule G-CSF — which has also been proven to have an anti-inflammatory role[41] — was massively upregulated when MSC were co-culture with stimulated PBMC. In vivo, G-CSF is a hematopoietic cytokine produced by monocytes, macrophages, fibroblasts, and endothelial cells which regulates neutrophil mobilization during infections and inflammations[42]. We speculate that such a large production of G-CSF was triggered from MSC, what might mimic the innate immune-activation — namely instant blood-mediated inflammatory and anti-inflammatory reactions — observed in vivo after systemic injection of MSC[43]. As a matter of evidence[44], in vitro long-term expansion of MSC has been related to impaired inflammatory modulation and we observed the same pattern: co-cultures with high passage MSC (P6) were significantly producing more IL-6 and G-CSF than early passage MSC (P2 and P3). Similar results were reflected in a phase II clinical trial for the treatment of acute graft versus host disease (GvHD) where MSC transplantation failed to prevent the development of grade II acute GvHD in one patient because increased gene expression of IL-6 and CSF which possibly may have promoted T- and B-cell proliferation and macrophages activation[45]. Among all cytokines analysed, GM-CSF concentration was not affected by the presence of MSC and we concluded that it might not be involved in the immunomodulation process.
The limitation of our study is the experimental application of a single PBMC donor. However, the aim of this study was to compare MSC behaviours without introducing further confounders. Indeed, the results presented in this work focus on MSC cell motility and immunomodulatory potential rather than the effects of multiple sources of PBMC. To avoid misleading results, the choice of the PBMC donor was based on IgG production and selecting the closest donor to the mean value of the investigated population. Further limitation, is that we did not examine neither the functional outcomes that cell motility might have on specific immune cell subsets, nor the correlation of MSC hypoimmunogenicity to in vitro cell tracking.
Conclusion
We showed that MSC motility is a prospective indicator for MSC immunomodulatory potential. Although the heterogeneity of cell motility in MSC populations reduce the accuracy of the proposed method, it can be fruitfully used to indicate the overall potential of cell populations, especially in those with lower variability. In monoculture, fast MSC were more metabolically active and produced larger amounts of G-CSF, IL-6 and MCP-1. In co-culture with stimulated PBMC, fast MSC inhibited more efficiently IgG production, and correlated with higher IL-10 concentrations. The process of standardization of cell production — i.e. MSC extraction, expansion and administration — is fundamental in the application of MSC as a treatment. We believe that in vitro cell tracking can contribute to a better understanding of the immunomodulatory properties of MSC, beyond the standard MSC molecular markers. In combination with the previously demonstrated predictive value of live-imaging for differentiation potential[27], we think that the measurement of cell motility is a fast assay which can be used alone or complementary to other tests in order to improve the prediction of clinical outcomes.
Acknowledgments
Acknowledgments
The authors thank Dr W. Wei-Lynn Wong and her team at the University of Zurich for her technical support.
Glossary
Abbreviations
- MCS:
Mesenchymal stem cells
- FBS:
Fetal bovine serum
- PBMC:
Peripheral blood mononuclear cells
- IL-2:
Interleukin-2
- IL-4:
Interleukin-4
- IL-6:
Interleukin-6
- IL-10:
Interleukin-10
- G-CSF:
Granulocyte-colony stimulating factor
- GM-CSF:
Granulocyte-macrophage colony-stimulating factor
- MCP1:
Monocyte chemoattractant protein 1
- TNF-α:
Tumor necrosis factor-alpha
- GvHD:
Graft versus host disease
Potential Conflicts of Interests
None
Financial support
This work was supported by the Swiss Paraplegic Foundation, the Center for Applied Biotechnology and Molecular Medicine (Grant CABMM to J. Stoyanov from 3 march 2015) and the Swiss National Foundation (Grant CR2313_159744).
References
- 1.Schallmoser K, Rohde E, Reinisch A, Bartmann C, Thaler D, Drexler C, Obenauf AC, Lanzer G, Linkesch W, Strunk D. Rapid large-scale expansion of functional mesenchymal stem cells from unmanipulated bone marrow without animal serum. Tissue engineering Part C, Methods. 2008;14(3):185–96. doi: 10.1089/ten.tec.2008.0060. [DOI] [PubMed] [Google Scholar]
- 2.Colter DC, Class R, DiGirolamo CM, Prockop DJ. Rapid expansion of recycling stem cells in cultures of plastic-adherent cells from human bone marrow. Proceedings of the National Academy of Sciences of the United States of America. 2000;97(7):3213–8. doi: 10.1073/pnas.070034097. [DOI] [PMC free article] [PubMed] [Google Scholar]
- 3.Kyurkchiev D, Bochev I, Ivanova-Todorova E, Mourdjeva M, Oreshkova T, Belemezova K, Kyurkchiev S. Secretion of immunoregulatory cytokines by mesenchymal stem cells. World journal of stem cells. 2014;6(5):552–70. doi: 10.4252/wjsc.v6.i5.552. [DOI] [PMC free article] [PubMed] [Google Scholar]
- 4.Pittenger MF, Mackay AM, Beck SC, Jaiswal RK, Douglas R, Mosca JD, Moorman MA, Simonetti DW, Craig S, Marshak DR. Multilineage potential of adult human mesenchymal stem cells. Science. 1999;284(5411):143–7. doi: 10.1126/science.284.5411.143. [DOI] [PubMed] [Google Scholar]
- 5.Miyahara Y, Nagaya N, Kataoka M, Yanagawa B, Tanaka K, Hao H, Ishino K, Ishida H, Shimizu T, Kangawa K, Sano S, Okano T, Kitamura S, Mori H. Monolayered mesenchymal stem cells repair scarred myocardium after myocardial infarction. Nat Med. 2006;12(4):459–65. doi: 10.1038/nm1391. [DOI] [PubMed] [Google Scholar]
- 6.Uccelli A, Benvenuto F, Laroni A, Giunti D. Neuroprotective features of mesenchymal stem cells. Best practice & research Clinical haematology. 2011;24(1):59–64. doi: 10.1016/j.beha.2011.01.004. [DOI] [PubMed] [Google Scholar]
- 7.Eom YW, Kim G, Baik SK. Mesenchymal stem cell therapy for cirrhosis: Present and future perspectives. World journal of gastroenterology. 2015;21(36):10253–61. doi: 10.3748/wjg.v21.i36.10253. [DOI] [PMC free article] [PubMed] [Google Scholar]
- 8.Nauta AJ, Fibbe WE. Immunomodulatory properties of mesenchymal stromal cells. Blood. 2007;110(10):3499–506. doi: 10.1182/blood-2007-02-069716. [DOI] [PubMed] [Google Scholar]
- 9.Le Blanc K, Frassoni F, Ball L, Locatelli F, Roelofs H, Lewis I, Lanino E, Sundberg B, Bernardo ME, Remberger M, Dini G, Egeler RM, Bacigalupo A, Fibbe W, Ringdén O. Developmental Committee of the European Group for Blood and Marrow Transplantation. Mesenchymal stem cells for treatment of steroid-resistant, severe, acute graft-versus-host disease: a phase II study. Lancet. 2008;371(9624):1579–86. doi: 10.1016/S0140-6736(08)60690-X. [DOI] [PubMed] [Google Scholar]
- 10.Wei X, Yang X, Han ZP, Qu FF, Shao L, Shi YF. Mesenchymal stem cells: a new trend for cell therapy. Acta pharmacologica Sinica. 2013;34(6):747–54. doi: 10.1038/aps.2013.50. [DOI] [PMC free article] [PubMed] [Google Scholar]
- 11.Gao F, Chiu SM, Motan DA, Zhang Z, Chen L, Ji HL, Tse HF, Fu QL, Lian Q. Mesenchymal stem cells and immunomodulation: current status and future prospects. Cell death & disease. 2016;7:e2062–e2062. doi: 10.1038/cddis.2015.327. [DOI] [PMC free article] [PubMed] [Google Scholar]
- 12.Francois M, Galipeau J. New insights on translational development of mesenchymal stromal cells for suppressor therapy. J Cell Physiol. 2012;227(11):3535–8. doi: 10.1002/jcp.24081. [DOI] [PubMed] [Google Scholar]
- 13.Meisel R, Zibert A, Laryea M, Gobel U, Daubener W, Dilloo D. Human bone marrow stromal cells inhibit allogeneic T-cell responses by indoleamine 2,3-dioxygenase-mediated tryptophan degradation. Blood. 2004;103(12):4619–21. doi: 10.1182/blood-2003-11-3909. [DOI] [PubMed] [Google Scholar]
- 14.Aggarwal S, Pittenger MF. Human mesenchymal stem cells modulate allogeneic immune cell responses. Blood. 2005;105(4):1815–22. doi: 10.1182/blood-2004-04-1559. [DOI] [PubMed] [Google Scholar]
- 15.Sotiropoulou PA, Perez SA, Gritzapis AD, Baxevanis CN, Papamichail M. Interactions between human mesenchymal stem cells and natural killer cells. Stem Cells. 2006;24(1):74–85. doi: 10.1634/stemcells.2004-0359. [DOI] [PubMed] [Google Scholar]
- 16.Ren G, Zhang L, Zhao X, Xu G, Zhang Y, Roberts AI, Zhao RC, Shi Y. Mesenchymal stem cell-mediated immunosuppression occurs via concerted action of chemokines and nitric oxide. Cell stem cell. 2008;2(2):141–50. doi: 10.1016/j.stem.2007.11.014. [DOI] [PubMed] [Google Scholar]
- 17.English K. Mechanisms of mesenchymal stromal cell immunomodulation. Immunology and cell biology. 2013;91(1):19–26. doi: 10.1038/icb.2012.56. [DOI] [PubMed] [Google Scholar]
- 18.DelaRosa O, Lombardo E, Beraza A, Mancheño-Corvo P, Ramirez C, Menta R, Rico L, Camarillo E, García L, Abad JL, Trigueros C, Delgado M, Büscher D. Requirement of IFN-gamma-mediated indoleamine 2,3-dioxygenase expression in the modulation of lymphocyte proliferation by human adipose-derived stem cells. Tissue Eng Part A. 2009;15(10):2795–806. doi: 10.1089/ten.TEA.2008.0630. [DOI] [PubMed] [Google Scholar]
- 19.Batten P, Sarathchandra P, Antoniw JW, Tay SS, Lowdell MW, Taylor PM, Yacoub MH. Human mesenchymal stem cells induce T cell anergy and downregulate T cell allo-responses via the TH2 pathway: relevance to tissue engineering human heart valves. Tissue engineering. 2006;12(8):2263–73. doi: 10.1089/ten.2006.12.2263. [DOI] [PubMed] [Google Scholar]
- 20.Melief SM, Geutskens SB, Fibbe WE, Roelofs H. Multipotent stromal cells skew monocytes towards an anti-inflammatory interleukin-10-producing phenotype by production of interleukin-6. Haematologica. 2013;98(6):888–95. doi: 10.3324/haematol.2012.078055. [DOI] [PMC free article] [PubMed] [Google Scholar]
- 21.Cassatella MA, Mosna F, Micheletti A, Lisi V, Tamassia N, Cont C, Calzetti F, Pelletier M, Pizzolo G, Krampera M. Toll-like receptor-3-activated human mesenchymal stromal cells significantly prolong the survival and function of neutrophils. Stem Cells. 2011;29(6):1001–11. doi: 10.1002/stem.651. [DOI] [PubMed] [Google Scholar]
- 22.Rafei M, Hsieh J, Fortier S, Li M, Yuan S, Birman E, Forner K, Boivin MN, Doody K, Tremblay M, Annabi B, Galipeau J. Mesenchymal stromal cell-derived CCL2 suppresses plasma cell immunoglobulin production via STAT3 inactivation and PAX5 induction. Blood. 2008;112(13):4991–8. doi: 10.1182/blood-2008-07-166892. [DOI] [PubMed] [Google Scholar]
- 23.Deshmane SL, Kremlev S, Amini S, Sawaya BE. Monocyte chemoattractant protein-1 (MCP-1): an overview. Journal of interferon & cytokine research : the official journal of the International Society for Interferon and Cytokine Research. 2009;29(6):313–26. doi: 10.1089/jir.2008.0027. [DOI] [PMC free article] [PubMed] [Google Scholar]
- 24.Akiyama K, Chen C, Wang D, Xu X, Qu C, Yamaza T, Cai T, Chen W, Sun L, Shi S. Mesenchymal-stem-cell-induced immunoregulation involves FAS-ligand-/FAS-mediated T cell apoptosis. Cell stem cell. 2012;10(5):544–55. doi: 10.1016/j.stem.2012.03.007. [DOI] [PMC free article] [PubMed] [Google Scholar]
- 25.Kim N, Cho SG. Clinical applications of mesenchymal stem cells. The Korean journal of internal medicine. 2013;28(4):387–402. doi: 10.3904/kjim.2013.28.4.387. [DOI] [PMC free article] [PubMed] [Google Scholar]
- 26.Prockop DJ, Sekiya I, Colter DC. Isolation and characterization of rapidly self-renewing stem cells from cultures of human marrow stromal cells. Cytotherapy. 2001;3(5):393–6. doi: 10.1080/146532401753277229. [DOI] [PubMed] [Google Scholar]
- 27.Bertolo A, Gemperli A, Gruber M, Gantenbein B, Baur M, Pötzel T, Stoyanov J. In vitro cell motility as a potential mesenchymal stem cell marker for multipotency. Stem cells translational medicine. 2015;4(1):84–90. doi: 10.5966/sctm.2014-0156. [DOI] [PMC free article] [PubMed] [Google Scholar]
- 28.Heidt S, Hester J, Shankar S, Friend PJ, Wood KJ. B cell repopulation after alemtuzumab induction-transient increase in transitional B cells and long-term dominance of naive B cells. American journal of transplantation : official journal of the American Society of Transplantation and the American Society of Transplant Surgeons. 2012;12(7):1784–92. doi: 10.1111/j.1600-6143.2012.04012.x. [DOI] [PMC free article] [PubMed] [Google Scholar]
- 29.Jurk M, Schulte B, Kritzler A, Noll B, Uhlmann E, Wader T, Schetter C, Krieg AM, Vollmer J. C-Class CpG ODN: sequence requirements and characterization of immunostimulatory activities on mRNA level. Immunobiology. 2004;209(1-2):141–54. doi: 10.1016/j.imbio.2004.02.006. [DOI] [PubMed] [Google Scholar]
- 30.Melief SM, Zwaginga JJ, Fibbe WE, Roelofs H. Adipose tissue-derived multipotent stromal cells have a higher immunomodulatory capacity than their bone marrow-derived counterparts. Stem cells translational medicine. 2013;2(6):455–63. doi: 10.5966/sctm.2012-0184. [DOI] [PMC free article] [PubMed] [Google Scholar]
- 31.Ruppert D, Wand MP, Carroll RJ. Semiparametric regression during 2003-2007. Electronic journal of statistics. 2009;3:1193–256. doi: 10.1214/09-EJS525. [DOI] [PMC free article] [PubMed] [Google Scholar]
- 32.Kim J, Hematti P. Mesenchymal stem cell-educated macrophages: a novel type of alternatively activated macrophages. Exp Hematol. 2009;37(12):1445–53. doi: 10.1016/j.exphem.2009.09.004. [DOI] [PMC free article] [PubMed] [Google Scholar]
- 33.Mosser DM. The many faces of macrophage activation. J Leukoc Biol. 2003;73(2):209–12. doi: 10.1189/jlb.0602325. [DOI] [PubMed] [Google Scholar]
- 34.de Oliveira GL, de Lima KW, Colombini AM, Pinheiro DG, Panepucci RA, Palma PV, Brum DG, Covas DT, Simões BP, de Oliveira MC, Donadi EA, Malmegrim KC. Bone marrow mesenchymal stromal cells isolated from multiple sclerosis patients have distinct gene expression profile and decreased suppressive function compared with healthy counterparts. Cell Transplant. 2015;24(2):151–65. doi: 10.3727/096368913X675142. [DOI] [PubMed] [Google Scholar]
- 35.Park CW, Kim KS, Bae S, Son HK, Myung PK, Hong HJ, Kim H. Cytokine secretion profiling of human mesenchymal stem cells by antibody array. International journal of stem cells. 2009;2(1):59–68. doi: 10.15283/ijsc.2009.2.1.59. [DOI] [PMC free article] [PubMed] [Google Scholar]
- 36.Rasmusson I, Ringden O, Sundberg B, Le Blanc K. Mesenchymal stem cells inhibit lymphocyte proliferation by mitogens and alloantigens by different mechanisms. Experimental cell research. 2005;305(1):33–41. doi: 10.1016/j.yexcr.2004.12.013. [DOI] [PubMed] [Google Scholar]
- 37.Xu G, Zhang L, Ren G, Yuan Z, Zhang Y, Zhao RC, Shi Y. Immunosuppressive properties of cloned bone marrow mesenchymal stem cells. Cell research. 2007;17(3):240–8. doi: 10.1038/cr.2007.4. [DOI] [PubMed] [Google Scholar]
- 38.Malisan F, Brière F, Bridon JM, Harindranath N, Mills FC, Max EE, Banchereau J, Martinez-Valdez H. Interleukin-10 induces immunoglobulin G isotype switch recombination in human CD40-activated naive B lymphocytes. The Journal of experimental medicine. 1996;183(3):937–47. doi: 10.1084/jem.183.3.937. [DOI] [PMC free article] [PubMed] [Google Scholar]
- 39.Scheller J, Chalaris A, Schmidt-Arras D, Rose-John S. The pro- and anti-inflammatory properties of the cytokine interleukin-6. Biochimica et biophysica acta. 2011;1813(5):878–88. doi: 10.1016/j.bbamcr.2011.01.034. [DOI] [PubMed] [Google Scholar]
- 40.Schindler R, Mancilla J, Endres S, Ghorbani R, Clark SC, Dinarello CA. Correlations and interactions in the production of interleukin-6 (IL-6), IL-1, and tumor necrosis factor (TNF) in human blood mononuclear cells: IL-6 suppresses IL-1 and TNF. Blood. 1990;75(1):40–7. [PubMed] [Google Scholar]
- 41.Hartung T. Anti-inflammatory effects of granulocyte colony-stimulating factor. Current opinion in hematology. 1998;5(3):221–5. doi: 10.1097/00062752-199805000-00013. [DOI] [PubMed] [Google Scholar]
- 42.Bajrami B, Zhu H, Kwak HJ, Mondal S, Hou Q, Geng G, Karatepe K, Zhang YC, Nombela-Arrieta C, Park SY, Loison F, Sakai J, Xu Y, Silberstein LE, Luo HR. G-CSF maintains controlled neutrophil mobilization during acute inflammation by negatively regulating CXCR2 signaling. The Journal of experimental medicine. 2016;213(10):1999–2018. doi: 10.1084/jem.20160393. [DOI] [PMC free article] [PubMed] [Google Scholar]
- 43.Moll G, Rasmusson-Duprez I, von Bahr L, Connolly-Andersen AM, Elgue G, Funke L, Hamad OA, Lönnies H, Magnusson PU, Sanchez J, Teramura Y, Nilsson-Ekdahl K, Ringdén O, Korsgren O, Nilsson B, Le Blanc K. Are therapeutic human mesenchymal stromal cells compatible with human blood? Stem Cells. 2012;30(7):1565–74. doi: 10.1002/stem.1111. [DOI] [PubMed] [Google Scholar]
- 44.von Bahr L, Sundberg B, Lönnies L, Sander B, Karbach H, Hägglund H, Ljungman P, Gustafsson B, Karlsson H, Le Blanc K, Ringdén O. Long-term complications, immunologic effects, and role of passage for outcome in mesenchymal stromal cell therapy. Biology of blood and marrow transplantation : journal of the American Society for Blood and Marrow Transplantation. 2012;18(4):557–64. doi: 10.1016/j.bbmt.2011.07.023. [DOI] [PubMed] [Google Scholar]
- 45.Kuzmina LA, Petinati NA, Parovichnikova EN, Lubimova LS, Gribanova EO, Gaponova TV, Shipounova IN, Zhironkina OA, Bigildeev AE, Svinareva DA, Drize NJ, Savchenko VG. Multipotent Mesenchymal Stromal Cells for the Prophylaxis of Acute Graft-versus-Host Disease-A Phase II Study. Stem cells international. 2012;2012 doi: 10.1155/2012/968213. 968213. [DOI] [PMC free article] [PubMed] [Google Scholar]


