

ABSTRACT
Tilorone dihydrochloride (tilorone) is a small-molecule, orally bioavailable drug that is used clinically as an antiviral outside the United States. A machine-learning model trained on anti-Ebola virus (EBOV) screening data previously identified tilorone as a potent in vitro EBOV inhibitor, making it a candidate for the treatment of Ebola virus disease (EVD). In the present study, a series of in vitro ADMET (absorption, distribution, metabolism, excretion, toxicity) assays demonstrated the drug has excellent solubility, high Caco-2 permeability, was not a P-glycoprotein substrate, and had no inhibitory activity against five human CYP450 enzymes (3A4, 2D6, 2C19, 2C9, and 1A2). Tilorone was shown to have 52% human plasma protein binding with excellent plasma stability and a mouse liver microsome half-life of 48 min. Dose range-finding studies in mice demonstrated a maximum tolerated single dose of 100 mg/kg of body weight. A pharmacokinetics study in mice at 2- and 10-mg/kg dose levels showed that the drug is rapidly absorbed, has dose-dependent increases in maximum concentration of unbound drug in plasma and areas under the concentration-time curve, and has a half-life of approximately 18 h in both males and females, although the exposure was ∼2.5-fold higher in male mice. Tilorone doses of 25 and 50 mg/kg proved efficacious in protecting 90% of mice from a lethal challenge with mouse-adapted with once-daily intraperitoneal (i.p.) dosing for 8 days. A subsequent study showed that 30 mg/kg/day of tilorone given i.p. starting 2 or 24 h postchallenge and continuing through day 7 postinfection was fully protective, indicating promising activity for the treatment of EVD.
KEYWORDS: Ebola virus, tilorone, antiviral, interferon inducer, Ebola virus disease
INTRODUCTION
Ebola virus disease (EVD) is a severe, often fatal illness, with a mortality rate of up to 90%. It is caused by the Ebola virus (EBOV), a member of the filovirus family. Members of this taxonomic group, which also includes Marburg virus, form filamentous infectious viral particles and encode their genome in the form of single-stranded negative-sense RNA. Both viruses, and some of their lesser-known relatives, cause severe disease in humans and nonhuman primates in the form of viral hemorrhagic fevers (1). There are currently no therapeutics approved by the FDA for the treatment of EBOV infections, indicating an important public health gap in our preparedness for both the intentional release of this pathogen in a biowarfare scenario and a pandemic outbreak scenario, similar to the 2014–2016 Ebola outbreak in West Africa (which resulted in more than 28,000 cases and over 11,000 deaths). As recently as 2016, the Centers for Disease Control and Prevention (CDC) has reported cases of EBOV infections in Sierra Leone, Guinea, and Liberia. This year, there were 15 confirmed cases, 4 deaths, over 1,200 contacts with these individuals, and an emergency response coordination involving 50 health care facilities. These outbreaks are incredibly costly in terms of human life and financial impact on the health care systems of the countries involved. Although EBOV has been identified since 1976, there is also new information showing EBOV can persist in some survivors for more than 18 months, sustaining the possibility of person-to-person transmission (2).
To date there have been a relatively limited number of studies that have described potential small-molecule inhibitors of EBOV (3–5). The current pipeline of anti-EBOV therapeutics has been steadily increasing, although the only small-molecule drugs that have undergone human clinical testing are antivirals targeting the Ebola RNA polymerase (favipiravir [6], GS-5734 [7], and galidesivir [8]) as well as drug combinations of existing FDA-approved drugs (GBV-006), for which there is little published information available. Several compounds are in development at the preclinical stage targeting viral entry, required host pathways, and innate immunity pathways (9, 10). Despite this drug development activity against EBOV, there remain significant needs for clinically proven anti-EBOV therapeutics and prophylactic agents. Also, combination therapies against multiple targets is an increasingly common antiviral therapeutic strategy to both enhance efficacy and minimize the emergence of mutation-based drug resistance (11), and this requires further studies.
Tilorone dihydrochloride [tilorone; 2,7-bis(2-(diethylamino)ethoxy)fluoren-9-one dihydrochloride] (Fig. 1) is a small, orally bioavailable molecule (12) that is used clinically as an antiviral outside the United States. Sold under the trade name Amixin or Lavomax, tilorone is approved for use in Russia, Ukraine, Kazakhstan, Belarus, Armenia, Georgia, Kyrgyzstan, Moldova, Turkmenistan, and Uzbekistan for multiple viral disease indications (i.e., influenza, acute respiratory viral infection, viral hepatitis, viral encephalitis, myelitis, and others) and is included in the list of vital and essential medicines of the Russian Federation. Tilorone has a broad array of biological activities (13–20) and was first reported to be a small-molecule interferon (IFN) inducer with broad-spectrum antiviral activities (21–23). IFNs are pleiotropic cytokines with a long history of involvement in the development and treatment of viral infections and can inhibit viral replication by direct or indirect means such that combining IFNs with other antiviral drugs is a proven clinical strategy. Others have suggested that tilorone does not induce interferon in humans and therefore may have different activities in different species (24). The antiviral activity of tilorone has been reported against a broad-spectrum array of viruses, including herpes simplex virus (21, 25, 26), influenza A and B virus (21, 27), Venezuelan equine encephalitis virus (28), Mengo virus (21), Semliki Forest virus (21, 26, 29), vesicular stomatitis virus (21, 22), and West Nile virus (30). Human clinical studies outside the United States have evaluated tilorone as a treatment for acute respiratory viral infections (ARVIs), where it demonstrated significantly improved patient outcomes (24, 31–33). The drug also showed 72% prophylactic efficacy for respiratory tract infections in humans (34).
FIG 1.
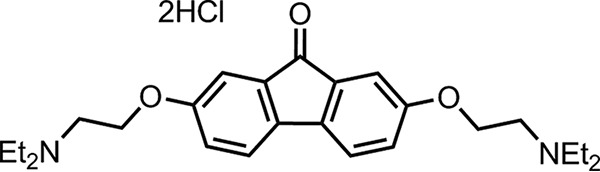
Chemical structure of tilorone dihydrochloride.
Despite its history of use for myriad viral diseases in other countries, tilorone's potential activity against Ebola virus was only recently uncovered by ourselves using a machine-learning computational model (35) trained on in vitro anti-Ebola screening data (36). The training data were generated through a collaborative drug-repurposing program with the goal of identifying multiple classes of Ebola inhibitors with in vitro and in vivo activities (10, 36). The Bayesian machine-learning models predicted Ebola inhibitory activity for tilorone, which then was tested using an in vitro anti-EBOV assay for activity. Tilorone gave a 50% effective concentration (EC50) of 230 nM (35), making it one of the most potent small-molecule inhibitors of EBOV reported. This result is also consistent with reports showing IFN-λ inhibits EBOV infection (37).
The reported clinical efficacy of tilorone against other types of viral infections combined with its potent in vitro activity against EBOV led us to further evaluate this drug as a potential treatment or prophylactic measure for EBOV infections. This work therefore describes the evaluation of the molecular properties and anti-EBOV efficacy of tilorone in preclinical drug development models.
RESULTS
In vitro ADMET evaluation of tilorone.
A significant percentage of drug candidate attrition can be attributed to problems that arise from pharmacokinetic (PK) processes (38, 39). It is therefore imperative that factors that determine the disposition of a pharmaceutical compound in an organism, such as absorption, distribution, metabolism, excretion, and toxicity (ADMET), are assessed early enough in the drug development process so that any potential issues can be addressed. While many of these properties can be reliably predicted (40, 41), there is still tremendous value to generating in vitro data for drug candidates. To that end, kinetic solubility (42), CYP inhibition (43), metabolic stability (44), Caco-2 permeability (45), and plasma protein binding (in mice and humans) (46) all were evaluated. Tilorone was found to be relatively soluble, has good mouse microsomal metabolic stability, suggesting it is moderately stable, has low protein binding in human and mouse, has good Caco-2 permeability (a predictor of absorption and oral bioavailability), and is not a P-glycoprotein (P-gp) substrate (Table 1). These in vitro ADME characteristics demonstrate that the drug is very well behaved and is suitable for further in vivo PK studies.
TABLE 1.
In vitro ADME properties for tilorone
| ADME property | Value(s) |
|---|---|
| Solubility | 465 μM at pH 7.4 |
| Cytochrome P450 inhibition | CYPs 1A2, 2C9, 2C19, 3A4, 2D6 (IC50 >50 μM) |
| Mouse liver microsome properties | t1/2, 47.8 min; CLint, 14.5 μl/min/mg protein |
| Mouse plasma protein binding | 61.4% |
| Mouse plasma stability (at 5 h) | 95.2% |
| Human plasma protein binding | 52% |
| Human plasma stability (at 5 h) | 94.8% |
| Caco-2 permeability | Papp A-B, 20.4 × 10⁻⁶ cm/s; Papp B-A, 8.87 × 10⁻⁶ cm/s; efflux ratio, 0.435 |
Mouse dose range-finding toxicity.
Tilorone was given to male and female BALB/c mice in a single dose by intraperitoneal (i.p.) administration to assess the tolerability of the compound and select dose groups for pharmacokinetics studies (Table 2). The compound was formulated in 20% Kolliphor HS 15 (Solutol) in sterile water. Clinical observations were performed immediately postdose and twice daily up to 72 h postdose. In the tilorone dose groups, ruffled fur, hunched posture, dehydration, and/or hypoactivity was observed across the three lower-dose groups, whereas all 3 male (M) and 3 female (F) mice in the 300-mg/kg of body weight dose group were found deceased on day 1. Based on these results, the maximum tolerated dose (MTD) for a single dose was determined as 100 mg/kg, with the noted adverse effects at lower doses as well.
TABLE 2.
Single-dose-range-finding tolerability of tilorone with i.p. administration
| Group | Dose (mg/kg) | No. of animals | Survival (no. of mice) | Clinical observation(s)a |
|---|---|---|---|---|
| 1 | 10 | 3 M/3 F | 6 of 6 | Ruffled fur |
| 2 | 50 | 3 M/3 F | 6 of 6 | Ruffled fur, hunched posture |
| 3 | 100 | 3 M/3 F | 6 of 6 | Ruffled fur, hunched posture, dehydration, hypoactivity |
| 4 | 300 | 3 M/3 F | 0 of 6 | NA |
NA, not applicable.
Mouse pharmacokinetics evaluation of tilorone.
Based on the dose range-finding study results, dose groups of 2 and 10 mg/kg (well below the MTD) were selected for an assessment of the pharmacokinetics of tilorone in mice. Both male and female mice were administered tilorone by i.p. injection in the same vehicle (20% Kolliphor HS 15). Blood was collected from the treated mice at 5 and 15 min and at 1, 2, 4, 6, 8, and 24 h postdose for processing to plasma. All samples were analyzed by liquid chromatography-tandem mass spectrometry (LC-MS/MS) for drug levels with a lower limit of quantitation (LLOQ) of 5.0 ng/ml.
After an initial rapid absorption phase, the tilorone plasma levels decreased through 4 h and then decreased more slowly; all samples collected at 24 h had concentrations of tilorone in plasma that were greater than the LLOQ (Fig. 2).
FIG 2.

Plasma concentrations of tilorone after i.p. administration to male and female BALB/c mice. The data points represent the means ± standard deviations (SD) from 3 mice.
The plasma drug level data were analyzed using noncompartmental modeling for extravascular administration and sparse sampling. This allowed calculation of pharmacokinetic parameters for tilorone in mice with i.p. administration (Table 3). Tilorone plasma levels reached the peak by 0.083 or 0.25 h. The elimination-phase half-life (t1/2) ranged from 15.7 h (2 mg/kg males) to 20.8 h (10 mg/kg males). Exposure to tilorone, based on maximum concentration of unbound drug in plasma (Cmax), area under the concentration-time curve from time zero to the last measurable concentration (AUClast), and area under the concentration-time curve from time zero to infinity (AUCinf), increased with the dose level in both males and females. Plasma levels of tilorone were lower in female mice, resulting in AUCinf values for male mice that were about 2.5-fold higher than those in females. CL/F (clearance) and V/F (volume of distribution) were not corrected for absolute bioavailability (F) and were relatively high.
TABLE 3.
Pharmacokinetic parameters of tilorone after i.p. administration to BALB/c mice
| Dose (mg/kg) | Sex | t1/2 (h) | Tmax (h) |
Cmax (ng/ml) |
AUClast (h-ng/ml) |
AUCinf (h-ng/ml) | CL/F (ml/h/kg) | V/F (ml/kg) | ||
|---|---|---|---|---|---|---|---|---|---|---|
| Mean | SE | Mean | SE | |||||||
| 2 | M | 15.7 | 0.083 | 50.5 | 5.84 | 356 | 39.6 | 516 | 87,900 | 3,870 |
| 2 | F | 18.7 | 0.083 | 17.5 | 3.55 | 133 | 9.16 | 210 | 257,000 | 9,510 |
| 10 | M | 20.8 | 0.25 | 135 | 2.33 | 1099 | 69.6 | 1940 | 155,000 | 5,160 |
| 10 | F | 18.9 | 0.25 | 92.3 | 7.85 | 513 | 74.0 | 793 | 343,000 | 12,600 |
Mouse dose range-finding efficacy.
Tilorone then was evaluated for efficacy against mouse-adapted EBOV (maEBOV) in mice across a range of doses. For this study, experimentally naive BALB/c mice were randomly assigned to groups (n = 10/group) and administered either tilorone or vehicle i.p. The virus challenge day was defined as study day 0. Figure 3A shows only 10% of challenged vehicle control mice survived by study day 7, with one control animal that lived to the end of the study. Ninety percent of the mice treated with either 25 or 50 mg/kg of tilorone lived to the end of the study. The lowest-dose group of tilorone (10 mg/kg) was associated with only 20% mouse survival. The clinical observations for the 25-mg/kg group showed only mild signs of lethargy with some fur ruffling and no hunched posture (Fig. 3B). Body weights in the 25- and 50-mg/kg groups decreased slightly starting on day 4 but returned to or exceeded the study day 0 values by the end of the study (Fig. 3C). Viral load analysis by plaque assay as well as quantitative real-time PCR (qRT-PCR) confirmed that surviving mice did not have viable virus or detectable levels of viral RNA in the sera by the end of the study, indicating apparent clearance of the virus from the mice (Fig. 3D and E).
FIG 3.

Tilorone multidose efficacy study results with maEBOV challenge on day 0 and once-daily i.p. dosing of tilorone at 10 mg/kg (red), 25 mg/kg (green), and 50 mg/kg (purple) or dosing with vehicle (blue). Dosing was performed once daily, beginning 1 h postchallenge, for 8 days. (A) Kaplan-Meier survival curves. *, P < 0.01 for treatment versus vehicle groups as assessed by log-rank analysis using the Dunnett-Hsu procedure to adjust for multiple comparisons. (B) Clinical scoring results (means ± SD). (C) Body weight results (means ± SD). (D) qRT-PCR measurement of viral RNA in sera for each dose group at the end of the study. (E) Plaque assay for viable EBOV in sera at the end of the study.
Mouse treatment window efficacy.
A subsequent two-dose, time course efficacy study then was performed to determine the dosing window and narrow the minimum effective dose (Fig. 4). This study was similar to the prior efficacy study but used only two dose levels (30 and 60 mg/kg), and the initial drug dose was given either 2, 24, or 48 h postinfection with maEBOV. The two groups given 30 mg/kg tilorone at either 2 or 24 h postinfection both had 100% survival rates with only minimal adverse clinical observations. The 60-mg/kg group displayed some signs of drug toxicity from the repeated dosing. At this dose level, the group dosed at 24 h postinfection had 100% survival; however, the group dosed at 2 h postinfection had only 60% survival. This unexpected result presumably is due to drug toxicity from a nonoptimal dosing regimen leading to drug accumulation and may not completely reflect a lack of efficacy. The 60-mg/kg group dosed at 48 h postinfection had only a 30% survival, which was not significant and was further confounded with the observed drug toxicity observed at this dose level. It may also be significant that all mice that died in the early treatment group dosed with 60 mg/kg were female.
FIG 4.

Tilorone time course efficacy study results with maEBOV. Virus challenge was on day 0, and once-daily i.p. dosing of tilorone at 30 mg/kg was given at 2 h postinfection (h p.i.) (red), 30 mg/kg at 24 h p.i. (green), 60 mg/kg at 2 h p.i. (purple), 60 mg/kg at 24 h p.i. (orange), and 60 mg/kg at 48 h p.i. (black), or vehicle was given (blue). (A) Kaplan-Meier survival curves. *, P < 0.01 for treatment versus vehicle groups, assessed by log-rank analysis using the Dunnett-Hsu procedure to adjust for multiple comparisons. (B) Clinical scoring results (means ± SD). (C) Body weight results (means ± SD). (D) qRT-PCR measurement of viral RNA in sera for each dose group at the end of the study. (E) Plaque assay for viable EBOV in sera at the end of the study.
Viremia was assessed by plaque assays and qRT-PCR on samples obtained from mice that met criteria for euthanasia during daily observation 1 or 2 or from animals that survived to the end of the study (Fig. 4D and E). The mean viral titer of seven of the nine mice that succumbed to disease in the vehicle control group was 3.81 × 10⁷ PFU/ml. Viable virus was not detected in the single survivor in the vehicle control group on day 28. Likewise, no viable virus was detected in treated animals that lived to day 28. Blood was collected from two of the four mice that died on study in group 4 (60 mg/kg starting 2 h postchallenge). The viral titers from the two euthanized animals were 3.30 × 10³ and 3.70 × 10⁵ PFU/ml, respectively. Blood was also collected from four of the seven mice that succumbed to infection in group 6 (60 mg/kg; 48 h postchallenge). Three of those mice had detectable levels of virus, with titers of 1.70 × 10⁶, 2.30 × 10⁴, and 1.45 × 10⁶ PFU/ml. Interestingly, one mouse which met euthanasia criteria (score of 5) on day 9 did not have detectable levels of virus in circulation. All samples from mice that survived to the end of the study were below the limit of detection or limit of quantitation by qRT-PCR. Of the samples obtained from group 1 nonsurvivors, six samples were positive for EBOV RNA, with a mean titer of 3.92 × 10⁶ genome equivalents/μl (GEq/μl). There were some individual mice where the serum was positive in the plaque assay but was below the limit of detection in the qRT-PCR assay. Quantifiable viral RNA was not detected in any of the samples from the 60-mg/kg, 48-h group, including the three mice which had viable virus detected in the plaque assay. These samples were reanalyzed a second time but remained below the limit of quantitation.
DISCUSSION
Since Ebola was first identified in 1976, there have been fewer than 500 cases reported per year, and no cases were reported at all between 1979 and 1994. The 2014 Ebola epidemic then became the largest outbreak of the disease recorded. Multiple countries in West Africa were affected, and the disease managed to make its way to the United States via those infected and health workers. People can become exposed via direct contact with blood and/or secretions of an infected person, which puts friends and family members at an elevated risk when caring for an infected person. Healthcare workers also have been infected frequently in medical facilities and are therefore at great risk. Therapeutic and prophylactic agents remain a serious unmet medical need for Ebola virus. There have been promising clinical trial results for several vaccine candidates that are in phase III clinical studies (i.e., GSK-3390107A, V-920, and VAC-69120), but vaccines require administration well before pathogen exposure and are likely to be used only on high-risk populations. The monoclonal antibody cocktail zMapp was used effectively to treat a small number of patients in the recent outbreak under FDA Expanded Access (“compassionate use”) authorization, but this cocktail is difficult to scale up for large treatment populations (47).
Tilorone hydrochloride is an investigational agent that has been known for over 40 years as an antiviral (21) and was the first synthetic, orally active interferon (IFN) inducer demonstrated in mice (22, 48). There were several clinical reports published that showed that even though tilorone was a potent antiviral and inducer of IFN in rodents, there was a lack of correlation between IFN induction and viral protection (49). An early study in humans also reported that tilorone failed to produce detectable IFN (24). These results raised questions about how well low-molecular-weight IFN inducers would translate to humans, and tilorone development was halted in the United States. Subsequently, tilorone has been repeatedly demonstrated to be an effective IFN inducer in humans (34, 50, 51), but the direct target of the drug and underlying mechanisms of its antiviral activity remain poorly understood. Measurement of tilorone's in vitro anti-EBOV activity in the IFN-deficient Vero 76 cell line (52, 53) showed a lack of antiviral activity at any concentration below the 50% cytotoxicity concentration (CC50; 12 μM). These observations support the hypothesis that tilorone's antiviral activity is acting through an IFN-related innate immunity pathway. Tilorone has been shown to possess a broad array of other biological activities, including cell growth inhibition in PC3 CDK5dn prostate cancer cells (IC50, 8 to 12 μM) (13) and inhibition of primase DnaG from Bacillus anthracis (IC50,7.1 μM) (14), and in a mouse model of pulmonary fibrosis it decreased lung hydroxyproline content and the expression of collagen genes (15). Other biologically important activities include α7 nicotinic receptor (nAChR) agonist activity (Ki, 56 nM) (16) and activated human alpha7 nAChR with an EC50 of 2.5 μM (17), which is a target for various central nervous system diseases. Tilorone was also shown to have radioprotective activity (18), potent modulation of HIF-mediated gene expression in neurons with neuroprotective properties (19), induction of the accumulation of glycosaminoglycans, delayed infectious prion clearance, and prolonged prion disease incubation time (20).
In this study, we have shown that tilorone exhibits excellent drug-like properties (solubility, Caco-2 permeability, metabolic stability, and CYP inhibition) and can be labeled as a class 1 drug based on the Biopharmaceutics Classification System (54, 55). These results were borne out by the pharmacokinetics data from mice showing good half-life and exposure, although there was a sex difference upon i.p. dosing from 2 mg/kg to 10 mg/kg. Prior literature reports on the PK of tilorone were performed in a single gender of mice and therefore did not observe these gender differences (12, 56). These results and the maximum tolerated dose indicated that we can dose mice at a level that can achieve drug serum concentrations above the 50% effective concentration (EC50, 230 nM) observed in the in vitro EBOV infection assay.
Our previous work has involved high-throughput screens which identified chloroquine, amodiaquine, and other molecules which were ultimately tested in vivo; however, most of these drugs were relatively unsuccessful at improving survival in various in vivo models of EVD (10, 36) (Table 4). More recently, we have used the in vitro screening data to derive computational machine learning models (35). These were then used for further virtual screening to identify three compounds that were not previously tested against EBOV. All three compounds were found to have EC50s that were submicromolar (35). In the current study, we have focused on the most active of those compounds, tilorone, which was found to result in a statistically significant 90% survival in mice at 25 and 50 mg/kg. At 30 mg/kg it resulted in 100% survival when dosed at 2 h or 24 h postchallenge.
TABLE 4.
In vitro and in vivo data for small-molecule therapeutics against Ebolaa
| Compound (reference) | EC50 (μM) | Drug class | Dose (mg/kg) and dosage regimenb | % survival (treatment) in mice | % survival (control) in mice |
|---|---|---|---|---|---|
| Amodiaquine (10) | 34†, 2.6* | Antimalarial | 60, i.p., BID | 0 | 0 |
| Benztropine (10) | 9.2†, 14* | Antihistamine/anticholinergic | 13, p.o., QD | 10 | 0 |
| 5, i.p., BID | 10 | 0 | |||
| Chloroquine (36, 57) | 16†, 4.7* | Antimalarial antirheumatic | 90, i.p., BID | 80 | 0 |
| 90, i.p., BID | 0 | 0 | |||
| Chlorotetracycline (10) | 24†, >50* | Antibiotic | 200, p.o., QD | 0 | 0 |
| 50, i.p., BID | 0 | 0 | |||
| Clomiphene (10) | 11†, 1.3* | Selective estrogen modulator | 60, i.p., BID | 10 | 0 |
| 21, p.o., QD | 0 | 0 | |||
| Favipiravir (58, 59) | 31–67† | Purine nucleic acid analogue | 150, p.o., BID | 100 | 0 |
| 300, p.o., BID | 100 | 0 | |||
| FGI-106 (60) | 0.1† | Antiviral | 2, i.p., QD | 100 | 10 |
| 5, i.p., QD | 100 | 10 | |||
| Galidesivir (61) | 3.1† | Nucleoside analog | 25, i.m., BID | 100‡ | 0 |
| GS-5734 (7) | 1.5† | Nucleoside analog | 10 (day 0) and 3 (day 3), i.p. | 100‡ | 0 |
| 10, i.v., QD | 100‡ | 0 | |||
| NSC 62914 (62) | 5.2† | Antioxidant | 2, i.p., QD | 90 | 0 |
| Prochlorperazine (10) | 11†, 1.9* | Phenothiazine antipsychotic | 10, i.p., QD | 10 | 20 |
| Tetrandrine (9) | 0.055† | Two-pore channel blocker | 30, i.p., QD (days 0, 1, 3, 5, 7) | 70 | 0 |
| 30, i.p., QD (days 1, 3, 5, 7) | 30 | 0 | |||
| 90, i.p., QD (days 1, 3, 5, 7) | 40 | 0 | |||
| Tilorone | 0.23† | Antiviral | 25, i.p., QD | 90 | 10 |
| 50, i.p., QD | 90 | 10 | |||
| 30, i.p., QD | 100 | 10 | |||
| 60, i.p., QD | 100 | 10 |
Symbols: †, replication; *, entry; ‡, nonhuman primate.
BID, twice a day; QD, once daily; i.m., intramuscular; p.o., per os; i.v., intravenous; i.p., intraperitoneal.
These results show the potential promise of using tilorone for treatment of EVD relative to other early-stage compounds (Table 4); however, further investigation is warranted into the mechanism of action and studies in additional higher-order animal models that better replicate human disease. The advantage of this compound is its availability on production scale and its history of safe human use for other antiviral diseases (it is currently available over the counter in Russia). This represents an example of computationally driven drug repurposing (63) and suggests the important value of exploring medicines that are globally available and used outside the United States. Additional preclinical development studies are needed to determine if tilorone can ultimately become a useful drug for EVD in humans. The relatively small number of potential drugs for Ebola underscores the need to identify additional candidates, as there is likely to be attrition among those drugs currently in development. Tilorone could be further investigated as a standalone drug or in combination with one of the current clinical stage anti-Ebola drugs (e.g., FGI-106, GS-5734, and galidesivir) to provide additional treatment options.
MATERIALS AND METHODS
Chemicals and reagents.
Tilorone dihydrochloride was purchased from Sigma-Aldrich (St. Louis, MO).
In vitro ADME assays.
All in vitro ADME studies were performed by BioDuro (San Diego, CA).
Bioanalytical method for in vitro ADME studies.
Test compounds were analyzed by reverse-phase high-performance liquid chromatography (HPLC) with a Kinetex 2.6μ C18 100A column (3.0 mm by 50 mm; Phenomenex, Torrance, CA) using a Shimadzu (Columbia, MD) LC-20AD system. The mobile phase consisted of solvent A (water with 0.1% formic acid) and solvent B (acetonitrile with 0.1% formic acid). The MS detection was performed by using an API 4000 Q trap system. The amount of parent compound was determined on the basis of the peak area ratio (compound area to internal standard [IS] area). IC50 was calculated using GraphPad Prism 5 software. The final dimethyl sulfoxide (DMSO) percentage was 1%.
Kinetic solubility.
A volume of 396 μl of universal aqueous buffer (pH 7.4) was added to 4 μl of a 50 mM DMSO stock solution of tilorone. Wells were agitated for 4 h at 20°C and then filtered. The compound then was diluted to serial concentrations with DMSO, followed by serial dilutions with acetonitrile-H2O (1:1) prior to LC-MS analysis. The calculated concentration (in micromolars) of soluble tilorone was determined in reference to a standard curve.
Caco-2 permeability.
Caco-2 cells were grown on 24-well (pore size, 0.4 μm) polycarbonate filters. The monolayers were preincubated with prewarmed HBSS (Hanks' balanced salt solution) containing 2.5% HEPES buffer (pH 7.4) for 0.5 h at 37°C. After preincubation, the buffer was removed and tilorone was added to reach a final concentration of 10 μM. Bovine serum albumin (BSA; 2%) was added to the receiver buffer for the study. The total volume was 400 μl for the apical (A) side and 1,200 μl for the basolateral (B) side. For the apical-to-basolateral transport study (A-B), 100 μl each was collected from both sides for sample analysis at the start of the assay, and then 200 μl was collected from the apical side at 90 min (end of the study). The same time points and amounts were used for the basolateral-to-apical transport study (B-A).
The apparent permeability coefficient (Papp) was calculated from the equation Papp (cm/s) = [v(∂C/∂t)]/(AC), where v is volume of the receiver cell, A is exposed surface area (0.64 cm2), C is initial donor concentration, and ∂C/∂t is change in receiver concentration over time.
CYP inhibition.
Human liver microsome solution (0.2 mg/ml), along with substrate, was aliquoted into a 0.05 M phosphate buffer (pH 7.4) in 1.1-ml tubes. Study samples (containing either control inhibitor or test compound) were into added into the tubes, vortexed gently, and preincubated for 5 min at 37°C. Twenty microliters of NADPH solution was aliquoted into all tubes and then vortexed to start the reaction and to ensure adequate mixing of the NADPH. After mixing, the tubes were incubated for 20 min at 37°C in a shaking water bath and then quenched in 300 ml formic acid-acetonitrile solution. After quenching, the samples were vortexed vigorously for 1 min and centrifuged at 4,000 rpm for 15 min (4°C). Supernatant (100 μl) was transferred to 0.65-ml tubes for LC-MS analysis by the bioanalytical method described earlier. The CYP450 substrates and control inhibitors for each enzyme were 1A2 (phenacetin and naphthoflavone), 2C9 (diclofenac and sulfaphenazole), 2C19 (omeprazole and tranylcypromine), 2D6 (dextromethorphan and quinidine), and 3A4 (midazolam and ketoconazole).
Mouse liver microsome stability.
Mouse liver microsome solution (197.5 μl; 1 mg/ml protein concentration) was aliquoted into 1.1-ml tubes, to which 2.5-μl volumes of positive-control and tilorone stock solutions (100 μM in DMSO) were added. The tubes were vortexed gently and preincubated for 5 min at 37°C, and then 50 μl of 5 mM NADPH or LM buffer (no NADPH buffer) was added into the tubes. For analysis, an aliquot of 15 μl was removed from each tube at 0, 5, 15, 30, and 60 min (no-NADPH reaction, 0, 30, and 60 min) and quenched with 300 μl of 25 ng/ml propranolol in acetonitrile. Samples were vigorously vortexed for 1 min and then centrifuged at 4,000 rpm for 15 min at 4°C. Supernatant (100 μl) from each sample was transferred to 0.65-ml tubes for LC-MS analysis. The amount of parent compound was determined on the basis of the peak area ratio (compound area to IS area) for each time point. Clearance rates were calculated by the equation CLint (μl/min/mg protein) = Ln(2) × 1,000/t1/2/protein concentration.
Protein binding in plasma.
The donor sides of dialysis inserts were filled with 200 μl plasma containing 5 μM tilorone and 0.5% DMSO, and the receiver side of the dialysis inserts was filled with 350 μl of phosphate-buffered saline (PBS) buffer (100 mM, pH 7.4). The prepared dialysis apparatus was placed in a shaker (37°C, 100 rpm) for 5 h. Two tubes with plasma containing 5 μM tilorone also were prepared for stability tests: one tube was placed in the freezer (4°C) for 5 h, and the other tube was placed in a shaker (3°C, 100 rpm) for 5 h. Samples were collected from the donor and receiver sides of each dialysis insert. The same volume of blank plasma was added to buffer samples and blank buffer to plasma samples to make sure all sample mixtures contained 50% plasma and 50% buffer. Fifty microliters of each sample was mixed with 300 μl of acetonitrile containing 25 ng/ml internal standard (propranolol). All samples were vortexed for 1 min and then centrifuged at 4,000 rpm, 4°C, for 15 min. One hundred microliters of the supernatant was transferred to 0.65-ml tubes for LC-MS analysis. The amount of compound was determined on the basis of the peak area ratio (compound area to internal standard area) for the two sides, and protein binding was determined using the equation % bound = 100 × ([area ratio of donor at 5 h] × 5 − [area ratio of receiver at 5 h])/([area ratio of donor at 5 h] × 5). The percent remaining at 37°C after 5 h was calculated on the basis of the amount measured at 0°C after 5 h.
Test article preparation for in vivo studies.
Dose formulations were aseptically prepared under yellow light by mixing the appropriate amount of test article in melted Kolliphor HS 15 (Solutol) (20% final volume) using a vortex mixer for 30 s. The remaining sterile water (Sigma-Aldrich) was added, and the formulations were mixed using a vortex mixer for 30 s and sonication for 15 min. The final 20% Kolliphor HS 15 dose formulations were observed to be clear, red solutions.
In vivo pharmacokinetic and toxicity.
Tilorone was administered to 7- to 8-week-old male and female BALC/c mice (Charles River) by i.p. injection. Animals were checked at least once daily, and clinical observations were recorded immediately postdose and then once daily for up to 72 h. Blood from the retro-orbital sinus of mice under isoflurane anesthesia was collected in tubes containing K3EDTA, processed to plasma, and stored frozen at ≤−60°C. The drug level of tilorone was determined in collected plasma samples using the bioanalytical method described below. The plasma drug level data were analyzed using Phoenix WinNonlin (version 6.3) software (Certara, Princeton, NJ) to perform noncompartmental modeling for extravascular administration and sparse sampling. The dose administered was input to the program as milligrams per kilogram, and as a result no additional corrections for individual body weights of the animals was necessary. Nominal times were used. Parameters determined were time to maximum concentration of drug in serum (Tmax), Cmax, t1/2, AUCinf, AUClast, V/F, and CL/F. The software also calculated the standard errors (SE) for Cmax and AUClast.
Bioanalytical method.
The extraction method for analysis and quantitation of tilorone in mouse plasma was 0.05 ml of an internal standard solution (50.0 ng/ml metoprolol tartrate in acetonitrile) added to 0.02 ml mouse plasma in a 2-ml microcentrifuge tube. The sample vials were vortexed briefly, and then 1 ml of extracting solvent (chloroform–methyl-tert-butyl ether, 1:2 [vol/vol]) was added to all samples to perform a liquid-liquid extraction. The upper organic layer was transferred into 1.5-ml microcentrifuge tubes, which then were placed in a centrifugal evaporator to remove the organic solvent. The dried residues were reconstituted in 0.2 ml reconstitution solution (mobile phase A [0.1% heptaflurobutyric acid in water]-mobile phase B [acetonitrile], 80:20, vol vol). Samples were analyzed by LC-MS/MS using a Phenomenex Kinetex Evo C18, 50- by 2.1-mm (5μ) column with a flow rate of 0.5 ml/min. With a 10-μl sample injection volume, chromatography was performed with the following gradient: 0 to 0.5 min (20% B), 0.5 to 2.5 min (20 to 30% B), 2.5 to 3.51 min (30 to 98% B), and 3.51 to 4 min (98% B). Quantitation was performed using MS/multiple reaction monitoring (MRM) analysis on an AB Sciex 4000 Q-Trap mass spectrometer (Sciex, Framingham, MA). Tilorone was measured by m/z 411.3→100.2 and metoprolol by m/z 268.2→116.2. The LC-MS/MS data were acquired, peak areas were integrated, the calibration line regression was calculated, and the final concentrations were generated using AB Sciex Analyst software.
Virus strains.
For in vivo experiments, a well-characterized mouse-adapted Ebola virus stock (Ebola virus M. musculus/COD/1976/Mayinga-CDC-808012; first reported by Bray et al. [64]) was used for all tilorone efficacy studies. All work involving infectious maEBOV was performed at the Galveston National Laboratory (GNL) biosafety level (BSL) 4 laboratory, registered with the Centers for Disease Control and Prevention Select Agent Program for the possession and use of biological select agents.
In vivo efficacy clinical observations and scoring.
All work with maEBOV-challenged mice was approved by the University of Texas Medical Branch's IACUC and was done in accordance with all applicable sections of the Final Rules of the Animal Welfare Act regulations (9 CFR Parts 1, 2, and 3) and the Guide for the Care and Use of Laboratory Animals (65). This work was conducted in UTMB's AAALAC-accredited GNL BSL4 laboratory.
Animals were monitored daily by visual examination. Clinical scoring and health assessments were performed and documented at each observation using a quantitative assessment of pain and distress scoring system. Animals are scored based on the following observations: 1, healthy; 2, displaying mild signs of lethargy, some fur ruffling, no hunched posture; 3, fur ruffling, hunched posture, mild signs of lethargy; 4, ruffled, hunched posture, increased lethargy, and limited mobility; 5, moribund (ruffled, hunched posture with reduced or minimal mobility consistent with inability to reach food or water or a >20% weight loss).
Once animals reached a clinical score of 3, they were observed twice daily with 6 to 8 h between observations. Animals in advanced disease (score of 4) were observed a third time. The third observation occurred 4 to 6 h after the afternoon observation. All surviving animals were humanely euthanized on study day 28. Mice were weighed daily through study day 7. Following this period and for the remainder of the study, animals were weighed every 3 days and monitored at least once per day for the development of clinical signs.
Virus administration.
Stock virus was diluted to a target challenge dose concentration of 1,000 PFU/ml such that animals received a target of 100 PFU per 100-μl dose. Virus administration was performed via i.p. injection, and the viral dose administered was verified through plaque assay analysis of the prepared virus suspension. Dosing was performed once daily beginning 1 h ± 15 min postchallenge for 8 days (8 total doses).
Viral load determination.
From each euthanized mouse (with the exception of those that required euthanasia during the third observation period as described above), blood was collected for viral load assessment via plaque assay and quantitative real-time PCR (qRT-PCR). Serum was harvested for plaque assay analysis and stored frozen (in an ultralow [i.e., −80°C] freezer) until the conclusion of the in-life portion of the animal study, after which samples were batch processed. Collected sera for qRT-PCR analysis were added to TRIzol LS reagent and then stored frozen (in an ultralow freezer) until the conclusion of the in-life portion of the animal study, after which samples were batch processed in the plaque and qRT-PCR assays.
EBOV plaque assay.
Serum samples were removed from frozen storage, thawed, and serially diluted in filtered-sterilized dilution medium (minimal essential medium–1% heat-inactivated fetal bovine serum [HI-FBS]–1% penicillin-streptomycin [PS]) for analysis. Titers of samples were determined on Vero CCL-81 cells in 12-well plates by standard protocols. Briefly, log dilutions of serum samples were added to 80% confluent monolayers and rocked every 15 min. At 1 h postinfection cells were overlaid with semisolid overlay of MEM, 0.5% methylcellulose, 2% HI-FBS, and 1% PS. Ten days postinfection the overlay was removed, and monolayers were stained and fixed using 10% neutral buffered formalin with crystal violet. Plaques were enumerated and virus titers determined as PFU per ml calculated.
EBOV qRT-PCR assay.
On the day of collection, harvested serum (target of 0.05 ml) was added to TRIzol LS reagent (5× volume, i.e., 0.25 ml) and mixed thoroughly. This solution was stored frozen as already described. For processing, samples were removed from frozen storage, thawed, and processed for RNA extraction and purification using the Zymo Direct-zol RNA miniprep kit. RNA samples were analyzed via quantitative RT-PCR using a Qiagen QuantiFast probe RT-PCR kit (forward primer, 5′-TTT TCA ATC CTC AAC CgT AAg gC-3′; reverse primer, 5′-Cag TCC ggT CCC AgA ATg Tg-3′; probe, 5′-6FAM-CAT gTg CCg CCC CAT CgC TgC-MGBNFQ-3′). All reactions were performed on a Bio-Rad CFX96 real-time PCR detection system. For quantification purposes, an HPLC-purified synthetic EBOV RNA standard derived from the conserved EBOV glycoprotein (GP) gene was used. For this assay, the lower limit of quantification (LLOQ) was defined as either 1.00E + 03 GEq/μl or 1.00E + 04 GEq/μl for the various plates, as these were the lowest standards on which both duplicate samples were detected. The upper limit of quantification was defined as 1.00E + 10 GEq/μl, as this was the highest tested point in the standard curve.
ACKNOWLEDGMENTS
This project was funded in whole or in part with federal funds from the Division of Microbiology and Infectious Diseases, National Institute of Allergy and Infectious Diseases, National Institutes of Health, Department of Health and Human Services, under contract no. HHSN2722011000221 (SRI principal investigator [PI], J.C.M.) and HHSN272201000040I, task order HHSN27200011 (UTMB PI, David Beasley). We also kindly acknowledge NIH funding R21TR001718 from NCATS (PI, S.E.).
We thank the technical staff at UTMB for performing the high-containment studies, including Terry Juelich, Birte Kalveram, Shane Massey, David Perez, Jennifer Smith, Rose Wanjala, and Lihong Zhang.
S.E. is the CEO of Collaborations Pharmaceuticals, Inc., and Phoenix Nest, Inc.
REFERENCES
- 1.Kiley MP, Bowen ET, Eddy GA, Isaacson M, Johnson KM, McCormick JB, Murphy FA, Pattyn SR, Peters D, Prozesky OW, Regnery RL, Simpson DI, Slenczka W, Sureau P, van der Groen G, Webb PA, Wulff H. 1982. Filoviridae: a taxonomic home for Marburg and Ebola viruses? Intervirology 18:24–32. doi: 10.1159/000149300. [DOI] [PubMed] [Google Scholar]
- 2.Caviness K, Kuhn JH, Palacios G. 2017. Ebola virus persistence as a new focus in clinical research. Curr Opin Virol 23:43–48. doi: 10.1016/j.coviro.2017.02.006. [DOI] [PubMed] [Google Scholar]
- 3.Ekins S, Coffee M. 2015. FDA approved drugs as potential Ebola treatments. F1000Res 48:4. [DOI] [PMC free article] [PubMed] [Google Scholar]
- 4.Ekins S, Southan C, Coffee M. 2015. Finding small molecules for the “next Ebola.” F1000Res 4:58. [DOI] [PMC free article] [PubMed] [Google Scholar]
- 5.Litterman N, Lipinski C, Ekins S. 2015. Small molecules with antiviral activity against the Ebola virus. F1000Res 4:38. [DOI] [PMC free article] [PubMed] [Google Scholar]
- 6.Sissoko D, Laouenan C, Folkesson E, M'Lebing A-B, Beavogui A-H, Baize S, Camara A-M, Maes P, Shepherd S, Danel C, Carazo S, Conde MN, Gala J-L, Colin G, Savini H, Bore JA, Le Marcis F, Koundouno FR, Petitjean F, Lamah M-C, Diederich S, Tounkara A, Poelart G, Berbain E, Dindart J-M, Duraffour S, Lefevre A, Leno T, Peyrouset O, Irenge L, Bangoura NF, Palich R, Hinzmann J, Kraus A, Barry TS, Berette S, Bongono A, Camara MS, Chanfreau Munoz V, Doumbouya L, Souley H, Kighoma PM, Koundouno FR, Réné L, Loua CM, Massala V, Moumouni K, Provost C, Samake N, Sekou C, et al. 2016. Experimental treatment with favipiravir for Ebola virus disease (the JIKI trial): a historically controlled, single-arm proof-of-concept trial in Guinea. PLoS Med 13:e1001967. doi: 10.1371/journal.pmed.1001967. [DOI] [PMC free article] [PubMed] [Google Scholar]
- 7.Warren TK, Jordan R, Lo MK, Ray AS, Mackman RL, Soloveva V, Siegel D, Perron M, Bannister R, Hui HC, Larson N, Strickley R, Wells J, Stuthman KS, Van Tongeren SA, Garza NL, Donnelly G, Shurtleff AC, Retterer CJ, Gharaibeh D, Zamani R, Kenny T, Eaton BP, Grimes E, Welch LS, Gomba L, Wilhelmsen CL, Nichols DK, Nuss JE, Nagle ER, Kugelman JR, Palacios G, Doerffler E, Neville S, Carra E, Clarke MO, Zhang L, Lew W, Ross B, Wang Q, Chun K, Wolfe L, Babusis D, Park Y, Stray KM, Trancheva I, Feng JY, Barauskas O, Xu Y, Wong P, Braun MR, Flint M, McMullan LK, Chen SS, Fearns R, Swaminathan S, Mayers DL, Spiropoulou CF, Lee WA, Nichol ST, Cihlar T, Bavari S. 2016. Therapeutic efficacy of the small molecule GS-5734 against Ebola virus in rhesus monkeys. Nature 531:381–385. doi: 10.1038/nature17180. [DOI] [PMC free article] [PubMed] [Google Scholar]
- 8.Taylor R, Kotian P, Warren T, Panchal R, Bavari S, Julander J, Dobo S, Rose A, El-Kattan Y, Taubenheim B, Babu Y, Sheridan WP. 2016. BCX4430–a broad-spectrum antiviral adenosine nucleoside analog under development for the treatment of Ebola virus disease. J Infect Public Health 9:220–226. doi: 10.1016/j.jiph.2016.04.002. [DOI] [PMC free article] [PubMed] [Google Scholar]
- 9.Sakurai Y, Kolokoltsov AA, Chen CC, Tidwell MW, Bauta WE, Klugbauer N, Grimm C, Wahl-Schott C, Biel M, Davey RA. 2015. Ebola virus. Two-pore channels control Ebola virus host cell entry and are drug targets for disease treatment. Science 347:995–998. [DOI] [PMC free article] [PubMed] [Google Scholar]
- 10.Madrid PB, Panchal RG, Warren TK, Shurtleff AC, Endsley AN, Green CE, Kolokoltsov AA, Davey RA, Manger ID, Gilfillan L, Bavari S, Tanga MJ. 2015. Evaluation of Ebola virus inhibitors for drug repurposing. ACS Infect Dis 1:317–326. doi: 10.1021/acsinfecdis.5b00030. [DOI] [PubMed] [Google Scholar]
- 11.Strasfeld L, Chou S. 2010. Antiviral drug resistance: mechanisms and clinical implications. Infect Dis Clin North Am 24:809–833. doi: 10.1016/j.idc.2010.07.001. [DOI] [PubMed] [Google Scholar]
- 12.Zinkovsky VG, Zhuk OV, Sumriy SK. 2007. Pharmacokinetics of a synthetic interferon inducer amixin in mice. Pharmacol Rep 59:739–751. [PubMed] [Google Scholar]
- 13.Wissing MD, Dadon T, Kim E, Piontek KB, Shim JS, Kaelber NS, Liu JO, Kachhap SK, Nelkin BD. 2014. Small-molecule screening of PC3 prostate cancer cells identifies tilorone dihydrochloride to selectively inhibit cell growth based on cyclin-dependent kinase 5 expression. Oncol Rep 32:419–424. doi: 10.3892/or.2014.3174. [DOI] [PMC free article] [PubMed] [Google Scholar]
- 14.Biswas T, Green KD, Garneau-Tsodikova S, Tsodikov OV. 2013. Discovery of inhibitors of Bacillus anthracis primase DnaG. Biochemistry 52:6905–6910. doi: 10.1021/bi4011286. [DOI] [PubMed] [Google Scholar]
- 15.Lepparanta O, Tikkanen JM, Bespalov MM, Koli K, Myllarniemi M. 2013. Bone morphogenetic protein-inducer tilorone identified by high-throughput screening is antifibrotic in vivo. Am J Respir Cell Mol Biol 48:448–455. doi: 10.1165/rcmb.2012-0201OC. [DOI] [PubMed] [Google Scholar]
- 16.Schrimpf MR, Sippy KB, Briggs CA, Anderson DJ, Li T, Ji J, Frost JM, Surowy CS, Bunnelle WH, Gopalakrishnan M, Meyer MD. 2012. SAR of alpha7 nicotinic receptor agonists derived from tilorone: exploration of a novel nicotinic pharmacophore. Bioorg Med Chem Lett 22:1633–1638. doi: 10.1016/j.bmcl.2011.12.126. [DOI] [PubMed] [Google Scholar]
- 17.Briggs CA, Schrimpf MR, Anderson DJ, Gubbins EJ, Gronlien JH, Hakerud M, Ween H, Thorin-Hagene K, Malysz J, Li J, Bunnelle WH, Gopalakrishnan M, Meyer MD. 2008. Alpha7 nicotinic acetylcholine receptor agonist properties of tilorone and related tricyclic analogues. Br J Pharmacol 153:1054–1061. doi: 10.1038/sj.bjp.0707649. [DOI] [PMC free article] [PubMed] [Google Scholar]
- 18.Kim K, Damoiseaux R, Norris AJ, Rivina L, Bradley K, Jung ME, Gatti RA, Schiestl RH, McBride WH. 2011. High throughput screening of small molecule libraries for modifiers of radiation responses. Int J Radiat Biol 87:839–845. doi: 10.3109/09553002.2011.560994. [DOI] [PMC free article] [PubMed] [Google Scholar]
- 19.Ratan RR, Siddiq A, Aminova L, Langley B, McConoughey S, Karpisheva K, Lee HH, Carmichael T, Kornblum H, Coppola G, Geschwind DH, Hoke A, Smirnova N, Rink C, Roy S, Sen C, Beattie MS, Hart RP, Grumet M, Sun D, Freeman RS, Semenza GL, Gazaryan I. 2008. Small molecule activation of adaptive gene expression: tilorone or its analogs are novel potent activators of hypoxia inducible factor-1 that provide prophylaxis against stroke and spinal cord injury. Ann N Y Acad Sci 1147:383–394. doi: 10.1196/annals.1427.033. [DOI] [PMC free article] [PubMed] [Google Scholar]
- 20.Mayer-Sonnenfeld T, Avrahami D, Friedman-Levi Y, Gabizon R. 2008. Chemically induced accumulation of GAGs delays PrP(Sc) clearance but prolongs prion disease incubation time. Cell Mol Neurobiol 28:1005–1015. doi: 10.1007/s10571-008-9274-1. [DOI] [PMC free article] [PubMed] [Google Scholar]
- 21.Krueger RE, Mayer GD. 1970. Tilorone hydrochloride: an orally active antiviral agent. Science 169:1213–1214. doi: 10.1126/science.169.3951.1213. [DOI] [PubMed] [Google Scholar]
- 22.Mayer GD, Krueger RF. 1970. Tilorone hydrochloride: mode of action. Science 169:1214–1215. doi: 10.1126/science.169.3951.1214. [DOI] [PubMed] [Google Scholar]
- 23.Stringfellow DA, Glasgow LA. 1972. Tilorone hydrochloride: an oral interferon-inducing agent. Antimicrob Agents Chemother 2:73–78. doi: 10.1128/AAC.2.2.73. [DOI] [PMC free article] [PubMed] [Google Scholar]
- 24.Kaufman HE, Centifanto YM, Ellison ED, Brown DC. 1971. Tilorone hydrochloride: human toxicity and interferon stimulation. Proc Soc Exp Biol Med 137:357–360. doi: 10.3181/00379727-137-35576. [DOI] [PubMed] [Google Scholar]
- 25.Isakov VA, Ermolenko DK, Isakov DV. 2011. Perspectives of prevention and treatment of herpes symplex with regular recurrence. Ter Arkh 83:44–47. [PubMed] [Google Scholar]
- 26.Katz E, Margalith E, Winer B. 1976. The effect of tilorone hydrochloride on the growth of several animal viruses in tissue cultures. J Gen Virol 31:125–129. doi: 10.1099/0022-1317-31-1-125. [DOI] [PubMed] [Google Scholar]
- 27.Uchaikin VF, Cheshik SG, Balabolkin II. 2001. Therapeutic efficacy and safety of Amixin in children with influenza and other respiratory viral infections. RMJ 9 https://cyberleninka.ru/article/n/znachenie-induktorov-interferona-v-lechenii-i-profilaktike-respiratornyh-infektsiy. (In Russian.) [Google Scholar]
- 28.Kuehne RW, Pannier WL, Stephen EL. 1977. Evaluation of various analogues of tilorone hydrochloride against Venezuelan equine encephalitis virus in mice. Antimicrob Agents Chemother 11:92–97. doi: 10.1128/AAC.11.1.92. [DOI] [PMC free article] [PubMed] [Google Scholar]
- 29.Stringfellow DA. 1981. Induction of interferon with low molecular weight compounds: fluorenone esters, ethers (tilorone), and pyrimidinones. Methods Enzymol 78:262–284. doi: 10.1016/0076-6879(81)78128-X. [DOI] [PubMed] [Google Scholar]
- 30.Loginova S, Koval'chuk AV, Borisevich SV, Syromiatnikova SI, Borisevich GV, Pashchenko Iu I, Khamitov RA, Maksimov VA, Shuster AM. 2004. Antiviral activity of an interferon inducer amixin in experimental West Nile fever. Vopr Virusol 49:8–11. [PubMed] [Google Scholar]
- 31.Selkova EP, Iakovlev VN, Semenenko TA, Filatov NN, Gotvianskaia TP, Danilina GA, Pantiukhova TN, Nikitina G, Tur'ianov M. 2001. Evaluation of amyxin effect in prophylaxis of acute respiratory viral infections. Zh Mikrobiol Epidemiol Immunobiol 2001:42–46. [PubMed] [Google Scholar]
- 32.Selkova EP, Tur'ianov MC, Pantiukhova TN, Nikitina GI, Semenenko TA. 2001. Evaluation of amixine reactivity and efficacy for prophylaxis of acute respiratory tract infections. Antibiot Khimioter 46:14–18. [PubMed] [Google Scholar]
- 33.Semenenko TA, Selkova EP, Nikitina GY, Gotvyanskaya TP, Yudina TI, Amaryan MP, Nosik NN, Turyanov MH. 2002. Immunomodulators in the prevention of acute respiratory viral infections. Russ J Immunol 7:105–114. [PubMed] [Google Scholar]
- 34.Selkova EP, Semenenko TA, Nosik NN, Iudina TI, Amarian MP, Lavrukhina LA, Pantiukhova TN, Tarasova G. 2001. Effect of amyxin–a domestic analog of tilorone–on characteristics of interferon and immune status of man. Zh Mikrobiol Epidemiol Immunobiol 2001:31–35. [PubMed] [Google Scholar]
- 35.Ekins S, Freundlich JS, Clark AM, Anantpadma M, Davey RA, Madrid P. 2015. Machine learning models identify molecules active against the Ebola virus in vitro. F1000Res 4:1091. doi: 10.12688/f1000research.7217.3. [DOI] [PMC free article] [PubMed] [Google Scholar]
- 36.Madrid PB, Chopra S, Manger ID, Gilfillan L, Keepers TR, Shurtleff AC, Green CE, Iyer LV, Dilks HH, Davey RA, Kolokoltsov AA, Carrion R Jr, Patterson JL, Bavari S, Panchal RG, Warren TK, Wells JB, Moos WH, Burke RL, Tanga MJ. 2013. A systematic screen of FDA-approved drugs for inhibitors of biological threat agents. PLoS One 8:e60579. doi: 10.1371/journal.pone.0060579. [DOI] [PMC free article] [PubMed] [Google Scholar]
- 37.Rhein BA, Powers LS, Rogers K, Anantpadma M, Singh BK, Sakurai Y, Bair T, Miller-Hunt C, Sinn P, Davey RA, Monick MM, Maury W. 2015. Interferon-γ inhibits Ebola virus infection. PLoS Pathog 11:e1005263. doi: 10.1371/journal.ppat.1005263. [DOI] [PMC free article] [PubMed] [Google Scholar]
- 38.Kola I, Landis J. 2004. Can the Pharmaceutical industry reduce attrition rates. Nat Rev Drug Discov 3:711–715. doi: 10.1038/nrd1470. [DOI] [PubMed] [Google Scholar]
- 39.Meanwell NA. 2011. Improving drug candidates by design: a focus on physicochemical properties as a means of improving compound disposition and safety. Chem Res Toxicol 24:1420–1456. doi: 10.1021/tx200211v. [DOI] [PubMed] [Google Scholar]
- 40.Clark AM, Dole K, Coulon-Spector A, McNutt A, Grass G, Freundlich JS, Reynolds RC, Ekins S. 2015. Open source bayesian models. 1. Application to ADME/Tox and drug discovery datasets. J Chem Infect Model 55:1231–1245. [DOI] [PMC free article] [PubMed] [Google Scholar]
- 41.Clark AM, Ekins S. 2015. Open source Bayesian models. 2. Mining a “big dataset” to create and validate models with ChEMBL. J Chem Infect Model 55:1246–1260. [DOI] [PubMed] [Google Scholar]
- 42.Stoner CL, Gifford E, Stankovic C, Lepsy CS, Brodfuehrer J, Prasad JV, Surendran N. 2004. Implementation of an ADME enabling selection and visualization tool for drug discovery. J Pharm Sci 93:1131–1141. doi: 10.1002/jps.20020. [DOI] [PubMed] [Google Scholar]
- 43.Ansede JH, Thakker DR. 2004. High-throughput screening for stability and inhibitory activity of compounds toward cytochrome P450-mediated metabolism. J Pharm Sci 93:239–255. doi: 10.1002/jps.10545. [DOI] [PubMed] [Google Scholar]
- 44.Di L, Kerns EH, Hong Y, Kleintop TA, McConnell OJ, Huryn DM. 2003. Optimization of a higher throughput microsomal stability screening assay for profiling drug discovery candidates. J Biomol Screen 8:453–462. doi: 10.1177/1087057103255988. [DOI] [PubMed] [Google Scholar]
- 45.Stoner CL, Cleton A, Johnson K, Oh DM, Hallak H, Brodfuehrer J, Surendran N, Han HK. 2004. Integrated oral bioavailability projection using in vitro screening data as a selection tool in drug discovery. Int J Pharm 269:241–249. doi: 10.1016/j.ijpharm.2003.09.006. [DOI] [PubMed] [Google Scholar]
- 46.Andersson TB, Bredberg E, Ericsson H, Sjoberg H. 2004. An evaluation of the in vitro metabolism data for predicting the clearance and drug-drug interaction potential of CYP2C9 substrates. Drug Metab Dispos 32:715–721. doi: 10.1124/dmd.32.7.715. [DOI] [PubMed] [Google Scholar]
- 47.Sayburn A. 2014. WHO gives go ahead for experimental treatments to be used in Ebola outbreak. BMJ 349:g5161. [DOI] [PubMed] [Google Scholar]
- 48.Stringfellow DA. 1977. Comparation interferon-inducing and antiviral properties of 2-amino-5-bromo-6-methyl-4-pyrimidinol (U-25,166), tilorone hydrochloride, and polyinosinic-polycytidylic acid. Antimicrob Agents Chemother 11:984–992. doi: 10.1128/AAC.11.6.984. [DOI] [PMC free article] [PubMed] [Google Scholar]
- 49.Giron DJ, Schmidt JP, Pindak FF. 1972. Tilorone hydrochloride: lack of correlation between interferon induction and viral protection. Antimicrob Agents Chemother 1:78–79. doi: 10.1128/AAC.1.1.78. [DOI] [PMC free article] [PubMed] [Google Scholar]
- 50.Maev IV, Grigorian SS, Gadzhieva MG, Ovchinnikova NI, Ospel'nikova TP, Kaziulin AN. 2002. Interferon status of patients with non-specific ulcerous colitis and its correction with interferon inducers. Ter Arkh 74:31–35. [PubMed] [Google Scholar]
- 51.Velychko LN, Vit VV, Maletskyi AP, Bogdanova AV. 2015. Immunomodulating effect of adjuvant interferon inducers in patients receiving combined photocoagulation/strontium-90 brachytherapy organ-saving treatment for uveal melanoma. Clin Ophthalmol 2015:17–22. [Google Scholar]
- 52.Desmyter J, Melnick JL, Rawls WE. 1968. Defectiveness of interferon production and of rubella virus interference in a line of African green monkey kidney cells (Vero). J Virol 2:955–961. [DOI] [PMC free article] [PubMed] [Google Scholar]
- 53.Emeny JM, Morgan MJ. 1979. Regulation of the interferon system: evidence that Vero cells have a genetic defect in interferon production. J Gen Virol 43:247–252. doi: 10.1099/0022-1317-43-1-247. [DOI] [PubMed] [Google Scholar]
- 54.Wu CY, Benet LZ. 2005. Predicting drug disposition via application of BCS: transport/absorption/elimination interplay and development of a biopharmaceutics drug disposition classification system. Pharm Res 22:11–23. doi: 10.1007/s11095-004-9004-4. [DOI] [PubMed] [Google Scholar]
- 55.Khandelwal A, Bahadduri PM, Chang C, Polli JE, Swaan PW, Ekins S. 2007. Computational models to assign biopharmaceutics drug disposition classification from molecular structure. Pharm Res 24:2249–2262. doi: 10.1007/s11095-007-9435-9. [DOI] [PubMed] [Google Scholar]
- 56.Golovenko NY, Borisyuk IY. 2005. Pharmacokinetics of amixin after repeated peroral administration to mice. Bull Exp Biol Med 140:708–710. doi: 10.1007/s10517-006-0061-z. [DOI] [PubMed] [Google Scholar]
- 57.Falzarano D, Safronetz D, Prescott J, Marzi A, Feldmann F, Feldmann H. 2015. Lack of protection against Ebola virus from chloroquine in mice and hamsters. Emerg Infect Dis 21:1065–1067. doi: 10.3201/eid2106.150176. [DOI] [PMC free article] [PubMed] [Google Scholar]
- 58.Oestereich L, Lüdtke A, Wurr S, Rieger T, Muñoz-Fontela C, Günther S. 2014. Successful treatment of advanced Ebola virus infection with T-705 (favipiravir) in a small animal model. Antiviral Res 105:17–21. doi: 10.1016/j.antiviral.2014.02.014. [DOI] [PubMed] [Google Scholar]
- 59.Smither SJ, Eastaugh LS, Steward JA, Nelson M, Lenk RP, Lever MS. 2014. Post-exposure efficacy of oral T-705 (favipiravir) against inhalational Ebola virus infection in a mouse model. Antiviral Res 104:153–155. doi: 10.1016/j.antiviral.2014.01.012. [DOI] [PubMed] [Google Scholar]
- 60.Aman MJ, Kinch MS, Warfield K, Warren T, Yunus A, Enterlein S, Stavale E, Wang P, Chang S, Tang Q, Porter K, Goldblatt M, Bavari S. 2009. Development of a broad-spectrum antiviral with activity against Ebola virus. Antiviral Res 83:245–251. doi: 10.1016/j.antiviral.2009.06.001. [DOI] [PubMed] [Google Scholar]
- 61.Warren TK, Wells J, Panchal RG, Stuthman KS, Garza NL, Van Tongeren SA, Dong L, Retterer CJ, Eaton BP, Pegoraro G, Honnold S, Bantia S, Kotian P, Chen X, Taubenheim BR, Welch LS, Minning DM, Babu YS, Sheridan WP, Bavari S. 2014. Protection against filovirus diseases by a novel broad-spectrum nucleoside analogue BCX4430. Nature 508:402–405. doi: 10.1038/nature13027. [DOI] [PMC free article] [PubMed] [Google Scholar]
- 62.Panchal RG, Reid SP, Tran JP, Bergeron AA, Wells J, Kota KP, Aman J, Bavari S. 2012. Identification of an antioxidant small-molecule with broad-spectrum antiviral activity. Antiviral Res 93:23–29. doi: 10.1016/j.antiviral.2011.10.011. [DOI] [PubMed] [Google Scholar]
- 63.Ekins S, Williams AJ, Krasowski MD, Freundlich JS. 2011. In silico repositioning of approved drugs for rare and neglected diseases. Drug Discov Today 16:298–310. doi: 10.1016/j.drudis.2011.02.016. [DOI] [PubMed] [Google Scholar]
- 64.Bray M, Davis K, Geisbert T, Schmaljohn C, Huggins J. 1999. A mouse model for evaluation of prophylaxis and therapy of Ebola hemorrhagic fever. J Infect Dis 179(Suppl 1):S248–S258. doi: 10.1086/514292. [DOI] [PubMed] [Google Scholar]
- 65.National Research Council. 2011. Guide for the care and use of laboratory animals, 8th ed National Academies Press, Washington, DC. [Google Scholar]