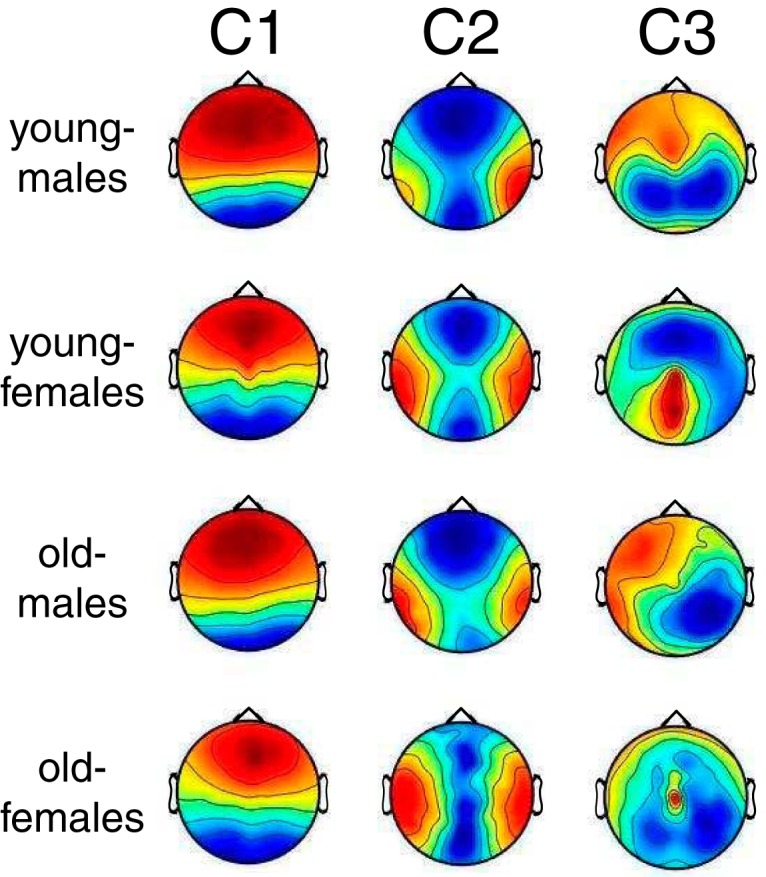
Figure 7.

Spatial distributions corresponding to the three strongest components of ISC (C1–C3). Red and blue colors indicate positive and negative correlation of the voltages on the scalp surface with the component activity. These maps are unitless due to an arbitrary scale on the projection vectors. Here, the projections have been computed separately for the combination of the two sex and age groups. As the scalp topographies were relatively consistent across the groups, the differences in ISC across these groups were not due to differences in the spatial topography of correlation within the group.
