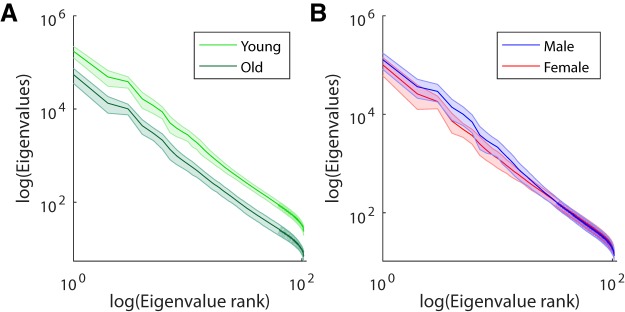
Figure 8.
Eigenvalue spectra of the average covariances for each demographic group. Eigenvalues measure the power of the signal in principal components of the EEG (correlated across time for each stimulus). Each curve is the average eigenvalue spectrum for each group averaged across all stimuli and subjects. A, Young subjects have more power than old subjects in all dimensions. This is represented by the upward shift in their average eigenvalue spectrum. B, The eigenvalue spectrum of females has a shallower slope than that for males, indicating that they have a more diverse set of neural responses.

