Abstract
Introduction
‘Porcelain aorta’ is listed in the second consensus document of the Valve Academic Research Consortium as a risk factor in aortic valve replacement. However, the extent of circumferential involvement is poorly defined with great variability in reported incidence. We present a simple, reproducible classification to describe the extent of aortic calcification and thus appropriately define ‘porcelain aorta’, aiding clinical decision-making and registry data collection.
Methods
175 consecutive CT aortograms were reviewed. The aorta was divided into three sections, and each section divided into quadrants. These were individually scored using a 5-point scale (0—no calcification, 5—complete contiguous calcification).
Results for each quadrant were summated for each segment to provide an indication of the distribution of calcification.
Results
Only one patient (0.6%) had a ‘true’ porcelain aorta, defined as contiguous calcification across all quadrants at any aortic level. Intraobserver and interobserver variation was excellent for the ascending aorta (K=0.85–0.88 and 0.81–0.96, respectively) while the interobserver variation in the transverse arch was good at 0.75.
Conclusions
Our data suggest the incidence of ‘true’ porcelain aorta may be significantly lower than reported in the literature. The predominance of calcification within the anterior wall of the proximal ascending aorta and the superior wall of the transverse arch may be clinically important. Application of this quick, simple and reproducible grading system, with no requirement for advanced software, may provide a tool to support accurate assessment of focal aortic calcification and its relationship to subsequent procedural risk.
Keywords: aortic valve disease, aortic disease, percutaneous valve therapy, CT scanning, Cardiopulmonary bypass
KEY QUESTIONS:
What is already known about this subject?
Porcelain aorta is a documented risk factor for aortic valve surgery and intervention, but is poorly defined with highly variable incidence reported in the literature.
What does this study add?
This study reports a quick, easily applied and reproducible system for describing the location and extent of ascending aortic calcification. This better defines ‘porcelain aorta’.
How might this impact on clinical practice?
Applying the term porcelain aorta to a patient with a less extensively calcified aorta could deny them surgery or transcatheter aortic valve implantation. This system could be implemented to describe the location and extent of aortic calcification in a more granular fashion, allowing future research of the relationship of aortic calcification and procedural risk and a more personalised approach to surgical and interventional planning.
Introduction
Porcelain aorta, defined as ‘circumferential calcification or severe atheromatous plaque of the entire ascending aorta, extending to the arch, such that aortic cross clamping is not feasible’ is listed as a risk factor in aortic valve replacement in the second consensus document of the Valve Academic Research Consortium.1 Its incidence has been reported to be as high as 18%2–5; however, the extent of circumferential involvement is not defined and, likely as a result, there is great variability in the incidence reported within the literature.
The presence of aortic calcification has been found to convey an increased risk of periprocedural complication and is an independent predictor of mortality in surgical patients.6–8 Severe calcific atherosclerotic disease may complicate or preclude aortic cross-clamping, thereby excluding some patients from conventional aortic valve surgery. While transcatheter aortic valve implantation (TAVI) offers hope to some patients unable to undergo surgical aortic valve replacement, the presence of vascular calcification has been associated with an increased procedural risk of vascular injury.9
Multidetector CT (MDCT) plays a crucial role in patient selection and procedural planning for both aortic surgery and TAVI, allowing accurate assessment of aortic valve annular circumference, aortic root dimensions, calibre, tortuosity and atheromatous disease extent and location within the aorta and ‘access’ vessels, within a single rapid acquisition.9
Aims
We believe a standard CT-based grading system could be implemented to describe the location and extent of ascending aortic calcification.
Our primary aim was to develop a simple, reproducible, visual classification system to more accurately describe the position and extent of ascending aortic calcification. This could be used to more appropriately define the term ‘porcelain aorta’, for the sake of both clinical decision-making and registry data collection.
As a secondary analysis, we aimed to investigate possible trends in calcific plaque location across our patient cohort.
Methods
175 consecutive CT aortograms, performed for clinical TAVI planning, were retrospectively reviewed. These were acquired in arterial phase, following 80 mL of iodinated contrast (Visipaque 320), administered via a peripheral cannula within the antecubital fossa. A test bolus method was used to achieve maximum arterial enhancement. All images were acquired on a 128-slice, dual source MDCT scanner (SOMATOM Definition Flash, Siemens, Erlangen, Germany), using a high-pitch ECG-gated protocol, imaging the aortic root at end-diastole.
Images were reconstructed at 1 mm intervals with a slice thickness of 1 mm using a soft tissue kernel and viewed at wide window settings to differentiate calcification from adjacent luminal contrast material.
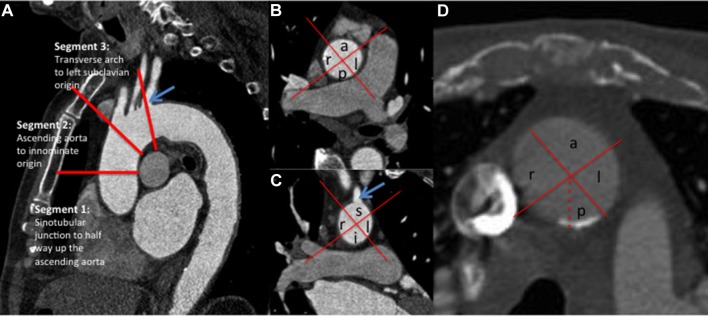
The ascending aorta was divided into three tubular sections (see figure 1A):
Figure 1.
(A) Sagittal section through the thoracic aorta demonstrating division of the ascending aorta from the sinotubular junction to the origin of the left subclavian artery (blue arrow) into three segments. (B) Axial section through the ascending aorta at the level of the right pulmonary artery demonstrating division of the ascending aorta (segments 1 and 2) into four quadrants (anterior (a), posterior (p), right (r) and left (l)). (C) Coronal reformat at the level of the left subclavian artery origin (blue arrow) demonstrating division into right (r), left (l), superior (s), inferior (i) quadrants. (D) Axial section through the ascending aorta at the level of the left pulmonary artery (segment 2) demonstrating calcification extending across just over 50% of the posterior segment (assigned a score of 3: 50%–74% involvement). No calcification is demonstrated in the other quadrants at this level.
Section 1. Sinotubular junction to mid-ascending aorta.
Section 2. Mid-ascending aorta to innominate artery origin.
Section 3. Innominate artery origin to left subclavian artery origin.
The ascending aorta (sections 1 and 2) was reviewed on axial sections and the transverse aorta (section 3) was assessed on coronal reformatted images. On each slice, the ascending aorta was divided into quadrants. For segments 1 and 2, these were termed anterior, left, posterior and right (figure 1B). As segment 3 tends to be more transverse in orientation, the terms superior and inferior were used instead of anterior and posterior (figure 1C).
For the primary analysis, each of the three aortic segments was examined as a whole and a score was assigned based on a visual approximation of the greatest perceived extent of calcification within each quadrant throughout that segment. Each quadrant was assigned a score of 0–5 according to a visual approximation of the proportion involved by calcification, where 0=no calcification; 1=<25% involvement within that segment; 2=25%–49% involvement; 3=50%–74% involvement; 4=75%–99% involvement; and 5=100% involvement (figure 1D).
The above scoring system was designed to provide a rapid visual assessment, feasible for use as a clinical tool. A secondary analysis was performed to provide a more detailed indication of total calcific burden within the ascending aorta and its distribution. Each individual 1 mm axial image was scored using the same grading system (as opposed to the primary technique of visually approximating maximal calcification extent in each quadrant over the course of a whole segment). The scores for each quadrant were summated and a mean score was calculated for each quadrant per segment (ie, mean quadrant score for segment=total quadrant score÷number of axial sections within segment) to account for differences in segment lengths throughout the cohort.
The images were initially scored by an imaging cardiologist with 2 years of cardiovascular CT experience (observer 1). Four months after the primary analysis, 30 patients, identified at random from the study cohort, were rescored by the same investigator and a second investigator (observer 2, a radiologist with 5 years of cardiovascular CT experience), both blinded to the results of the original analysis, to provide a measure of intraobserver and interobserver variability, respectively. Another repeat analysis was undertaken by observer 2, four months later, to provide further intraobserver variation data. A quadratic-weighted Cohen’s kappa coefficient was calculated using a web-based calculator (www.vassarstats.net/kappa.html) as close agreement between observations was deemed necessary for a clinically useful scoring system.
Results
Demographics
A total of 175 consecutive patients were included in the analysis. The cohort was predominantly male (102, 58.3%) with a median age of 79 (range 46–92) years. Full demographic details are summarised in table 1.
Table 1.
Patient demographics
| n (±SD) | % | |
| Patient cohort | 175 | |
| Male:female | 102:73 | 58.3 male |
| Median age (years) | 79 | |
| Extracardiac arteriopathy | 38 | 21.7 |
| Coronary artery disease | ||
| No disease >50% | 90 | 51.4 |
| Single-vessel disease | 38 | 21.7 |
| Two-vessel disease | 20 | 11.4 |
| Three-vessel disease | 27 | 15.4 |
| Diabetes mellitus | 36 | 20.6 |
| Cerebrovascular disease | ||
| Yes | 23 | 13.1 |
| TIA | 15 | (65.2) |
| CVA | 8 | (34.8) |
| Renal dysfunction (eGFR <60 mL/min/1.73 m2) |
54 | 30.8 |
| Smoking status | ||
| Never | 56 | 32.0 |
| Ex | 112 | 64.0 |
| Current | 7 | 4.0 |
CVA, cerebrovascular accident; eGFR, estimated glomerular filtration rate; TIA, transient ischaemic attack.
Primary analysis: instigation of a rapid visual quadrantic scoring system across whole segments
CT demonstrated a complete absence of aortic calcification in 33 patients (18.9%).
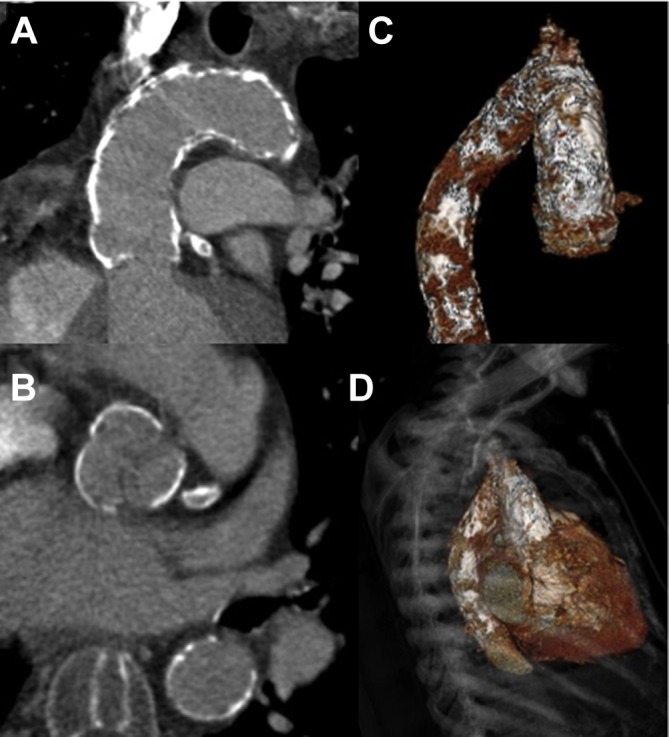
Only a single patient (0.6% of our cohort) demonstrated complete calcification of each quadrant at a least one level in all three segments (ie, a truly ‘porcelain aorta’). No other patient demonstrated circumferential calcification of any one or more of the three segments described (figure 2).
Figure 2.

A truly ‘porcelain aorta’. Coronal (A) and axial (B) CT reconstructions demonstrate confluent, circumferential calcification extending from the sinuses of Valsalva to the distal transverse aortic arch. The full extent of calcification is well demonstrated on volume-rendered tomograms (C and D) with further, less confluent, involvement of the proximal descending aorta.
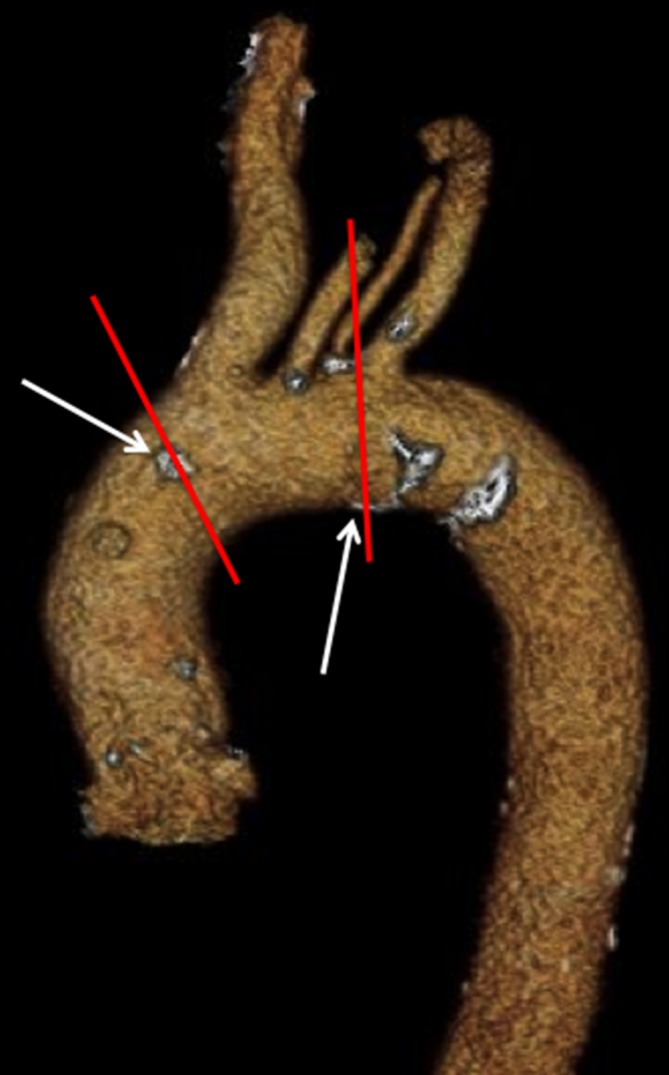
Intraobserver variation of the simple visual score was excellent, with kappa coefficients of 0.88 within segment 1, 0.88 within segment 2, and 0.85 within segment 3 (for observer 1) and 0.88, 0.89 and 0.77, respectively, for observer 2. Interobserver variability for the ascending aorta was also excellent with kappa values of 0.96 for segment 1 and 0.81 for segment 2. Interobserver variability for the transverse aortic arch was good (kappa coefficient of 0.75). Calcification at the division between segments 2 and 3, as the aorta moves from vertical in orientation into a transverse plane, can easily be scored as part of either segment 2 or 3, particularly within the posterior/inferior quadrant, likely explaining the poorer interobserver and intraobserver agreement in segment 3 (figure 3).
Figure 3.

Focal calcification at the borders between segments impacts on reproducibility. This is particularly relevant in segment 3 (between the red lines), where calcification both proximal and distal to the segment boundaries may be included (arrows), likely explaining poorer interobserver and intraobserver variability in this segment.
Observer 2 elected to time the scoring exercise using a mobile phone-based stopwatch. The mean time taken to score the entire ascending aorta was 1 min 48 s (range 36 s to 3 min 25 s), with faster times for those with very little calcification and the single patient with extensive circumferential calcification, and longer times for those with more extensive, non-contiguous calcification.
Secondary analysis: detailed extent and location
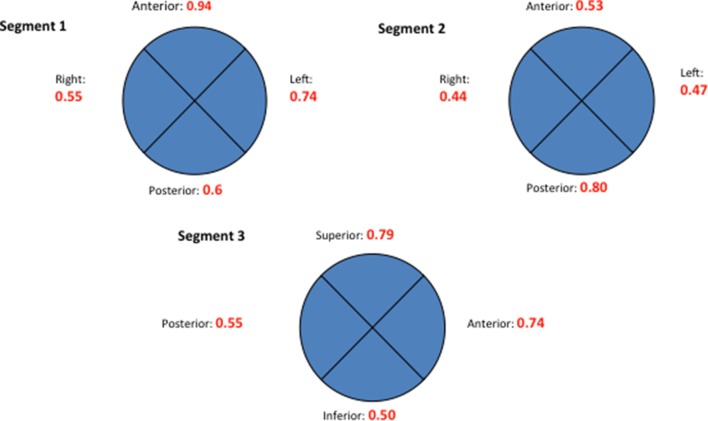
The distribution and extent of calcification was highly variable. Table 2 and figure 4 illustrate the location and mean calcification score (maximum score: 5 per quadrant) for the quadrants of each of the three aortic segments. As described in the Methods section, to account for differences in segment length, mean values were calculated across individual 1 mm images in each segment and expressed as an absolute value. There appears to be a greater incidence of calcification in the left/anterior wall of segment 1 (scores: 0.94 and 0.74, respectively), with relative sparing in the same regions of segment 2. Calcification was more prevalent posteriorly in segment 2, in keeping with anecdotal findings on surgical inspection at the time of conventional aortic cross-clamping and cannulations for cardiopulmonary bypass. Segment 3 showed more pronounced calcification superiorly, most prevalent around the origin of the head and neck vessels.
Table 2.
Grade and location of ascending aortic calcification (grade 0=no calcification, grade 1=<25%, grade 2=25%–49%, grade 3=50%–74%, grade 4=75%–99%, grade 5=100%)
| Aortic calcification grading | Segment, n (%) | ||
| 1 | 2 | 3 | |
| 0 | 72 (41.1) | 84 (48) | 88 (50.3) |
| 1 | 87 (49.7) | 72 (41.1) | 60 (34.3) |
| 2 | 10 (5.7) | 16 (9.1) | 17 (9.7) |
| 3 | 3 (1.7) | 1 (0.6) | 8 (4.6) |
| 4 | 2 (1.1) | 1 (0.6) | 2 (1.1) |
| 5 (‘Porcelain aorta’) | 1 (0.6) | 1 (0.6) | 0 |
Figure 4.
Extent and distribution of calcification in the ascending aorta/arch by location, normalised by dividing quadrant totals by segment length. (Segment 3 represents proximal aortic arch and therefore quadrant orientation changes, eg, anterior quadrant becomes superior quadrant.) Mean absolute values are calculated by averaging axial image scores for each quadrant within each segment. Maximum score of 5 (segment 1: sinotubular junction (STJ) to mid-way to the origin of the innominate artery; segment 2: from midpoint to the origin of the innominate artery; segment 3: origin of the innominate artery to the origin of the left subclavian artery (LSCA)).
Discussion
If ‘porcelain aorta’ is defined as circumferential calcification of the ascending aorta, then our results, in a cohort of elderly patients, many with significant risk factors, demonstrate a significantly lower incidence than is reported in the literature (only 0.6% of our cohort).
While the distribution of ascending aortic calcification is highly variable, we did find a mild predominance of calcification within the left/anterior quadrant of the proximal ascending aorta (segment 1), the posterior quadrant of the superior ascending aorta (segment 2) and the superior quadrant of the transverse aorta (segment 3). This is potentially of clinical interest as TAVI is often performed via a transfemoral approach, directly opposing the valve delivery system against the superior portion of the transverse arch and the anterior portion of the more proximal ascending aorta. The reason for the predominance of calcified plaque within these regions is not clear, but the advent of wall sheer stress modelling and four-dimensional flow MRI may lead to interesting avenues of investigation in future studies.
Data from Cohen et al,10 using intraoperative ultrasound to assess the ascending aorta, demonstrated a fourfold increase in risk of postoperative cerebrovascular accident (CVA) in patients with atheromatous disease within the ascending aorta (8.7% vs 1.8%). Our study cohort included three patients with periprocedural CVA, but was not sufficiently powered to demonstrate a significant increase in periprocedural CVAs. It does, however, seem feasible that calcification in these areas of opposition of vascular endothelium and valve delivery system may increase the risk of adverse events during catheter manipulation. Use of our simple, rapid and reproducible aortic calcification localisation system may enable a larger scale study to assess for any significant association of peri-TAVI CVA with the location of aortic calcification, demonstrated on preprocedural CT.
Conclusion
Our quick and simple visual grading system has been demonstrated to be highly reproducible with excellent interobserver reproducibility within the proximal ascending aorta and the distal ascending aorta (kappa 0.81). Furthermore, it does not require specific software or lengthy analysis.
By collecting data regarding the extent and location of ascending aortic calcification on routinely performed CT examinations, future studies may provide insight into the relevance of focal aortic calcification and procedural risk in patients undergoing aortic cross-clamping or transcatheter aortic implantation.
Limitations
This study has a number of limitations. It is a retrospective study using subjective visual assessment of aortic calcification. We acknowledge interobserver variability in reporting the semiquantitative location and extent of calcification; however, we feel the frameworks’ simplicity strengthens its validity and provides a robust grading system while Cohen’s kappa coefficient values demonstrate excellent reproducibility.
The small population size makes this study statistically underpowered to reveal any relationship between location and extent of ascending aortic calcification and major adverse cardiovascular and cerebrovascular events as this was not an aim of this study. It will, however, provide an interesting avenue of future investigation.
Footnotes
Contributors: All authors listed have provided the necessary input to qualify for authorship. The images and figures are original and have not been published elsewhere.
Competing interests: None declared.
Provenance and peer review: Not commissioned; externally peer reviewed.
Data sharing statement: There are no unpublished data available elsewhere.
References
- 1. Leon MB, Piazza N, Nikolsky E, et al. Standardized endpoint definitions for transcatheter aortic valve implantation clinical trials: a consensus report from the valve academic research consortium. Eur Heart J 2011;32:205–17. 10.1093/eurheartj/ehq406 [DOI] [PMC free article] [PubMed] [Google Scholar]
- 2. Moat NE, Ludman P, de Belder MA, et al. Long-term outcomes after transcatheter aortic valve implantation in high-risk patients with severe aortic stenosis: the U.K. TAVI (United Kingdom Transcatheter Aortic Valve Implantation) registry. J Am Coll Cardiol 2011;58:2130–8. 10.1016/j.jacc.2011.08.050 [DOI] [PubMed] [Google Scholar]
- 3. Rodés-Cabau J, Webb JG, Cheung A, et al. Transcatheter aortic valve implantation for the treatment of severe symptomatic aortic stenosis in patients at very high or prohibitive surgical risk: acute and late outcomes of the multicenter Canadian experience. J Am Coll Cardiol 2010;55:1080–90. 10.1016/j.jacc.2009.12.014 [DOI] [PubMed] [Google Scholar]
- 4. Leon MB, Smith CR, Mack M, et al. Transcatheter aortic-valve implantation for aortic stenosis in patients who cannot undergo surgery. N Engl J Med 2010;363:1597–607. 10.1056/NEJMoa1008232 [DOI] [PubMed] [Google Scholar]
- 5. Smith CR, Leon MB, Mack MJ, et al. Transcatheter versus surgical aortic-valve replacement in high-risk patients. N Engl J Med 2011;364:2187–98. 10.1056/NEJMoa1103510 [DOI] [PubMed] [Google Scholar]
- 6. Sanchez-Recalde A, Gonzalez-Obeso E, Oliver JM. Bilateral coronary artery occlusion after aortic valve replacement in a patient with porcelain ascending aorta. Eur Heart J 2007;28:1553 10.1093/eurheartj/ehl493 [DOI] [PubMed] [Google Scholar]
- 7. van der Linden J, Hadjinikolaou L, Bergman P, et al. Postoperative stroke in cardiac surgery is related to the location and extent of atherosclerotic disease in the ascending aorta. J Am Coll Cardiol 2001;38:131–5. 10.1016/S0735-1097(01)01328-6 [DOI] [PubMed] [Google Scholar]
- 8. Gillinov AM, Lytle BW, Hoang V, et al. The atherosclerotic aorta at aortic valve replacement: surgical strategies and results. J Thorac Cardiovasc Surg 2000;120:957–65. 10.1067/mtc.2000.110191 [DOI] [PubMed] [Google Scholar]
- 9. Leipsic J, Gurvitch R, Labounty TM, et al. Multidetector computed tomography in transcatheter aortic valve implantation. JACC Cardiovasc Imaging 2011;4:416–29. 10.1016/j.jcmg.2011.01.014 [DOI] [PubMed] [Google Scholar]
- 10. Cohen A, Tzourio C, Bertrand B, et al. Aortic plaque morphology and vascular events: a follow-up study in patients with ischemic stroke. FAPS Investigators. French Study of Aortic Plaques in Stroke. Circulation 1997;96:3838–41. [DOI] [PubMed] [Google Scholar]


