

Abstract
Copy-number variants of chromosome 16 region 16p11.2 are linked to neuropsychiatric disorders1–6 and are among the most prevalent in autism spectrum disorders1,2,7. Of many 16p11.2 genes, Kctd13 has been implicated as a major driver of neurodevelopmental phenotypes8,9. The function of KCTD13 in the mammalian brain, however, remains unknown. Here we delete the Kctd13 gene in mice and demonstrate reduced synaptic transmission. Reduced synaptic transmission correlates with increased levels of Ras homolog gene family, member A (RhoA), a KCTD13/CUL3 ubiquitin ligase substrate, and is reversed by RhoA inhibition, suggesting increased RhoA as an important mechanism. In contrast to a previous knockdown study8, deletion of Kctd13 or kctd13 does not increase brain size or neurogenesis in mice or zebrafish, respectively. These findings implicate Kctd13 in the regulation of neuronal function relevant to neuropsychiatric disorders and clarify the role of Kctd13 in neurogenesis and brain size. Our data also reveal a potential role for RhoA as a therapeutic target in disorders associated with KCTD13 deletion.
Deletions in and duplications of 16p11.2 are genetic risk factors for multiple neuropsychiatric conditions including autism1,2,4, intellectual disability4,5, attention-deficit/hyperactivity disorder4, schizophrenia3,6, bipolar3,6, epilepsy4,5, and obesity5 as well as alterations in brain size and head circumference3–5. This chromosomal region contains approximately 29 genes, none of which has been individually linked to 16p11.2-associated neuropsychiatric disorders10–12. Additional human genetic findings, however, do suggest a smaller critical region of five genes or fewer that includes the potassium-channel-tetramerization-domain-containing 13 gene (KCTD13, also known as BACURD1, POLDIP1, PDIP1, TNFAIP1-like)8,13. In zebrafish, kctd13 has been implicated in brain size in 16p11.2 copy-number variants via its morpholino-mediated knockdown8. Experiments in HeLa cells have elucidated the function of KCTD13 as a substrate-recognizing, BTB (broad-complex (Br-C), tramtrack (ttk), bric à brac (bab))14 domain adaptor protein that complexes with CUL3 ubiquitin E3 ligase to target the small GTPase RhoA for ubiquitination and degradation15. CUL3 is one of approximately 71 high-confidence autism spectrum disorder risk genes or regions11,12,16. These findings and literature on the role of RhoA in the modulation of dendrites and synaptic spines17–23 led us to hypothesize that Kctd13 modulates synaptic transmission.
We created a Kctd13 deletion mouse (Fig. 1a) resulting in loss of KCTD13 in brains of Kctd13 knockouts (KO) and an approximately 50% decrease in heterozygotes (HET, Fig. 1b; see Supplementary Table 1 for statistics and Supplementary Fig. 1 for gel source data). Polymerase chain reaction (PCR) confirmed loss of Kctd13 mRNA (Fig. 1c). β-galactosidase staining revealed Kctd13 promoter activity in a neuronal pattern throughout the brain (Fig. 1d), consistent with in situ hybridization data24.
Figure 1. Kctd13 deletion reduces synaptic transmission in area CA1 of the hippocampus.
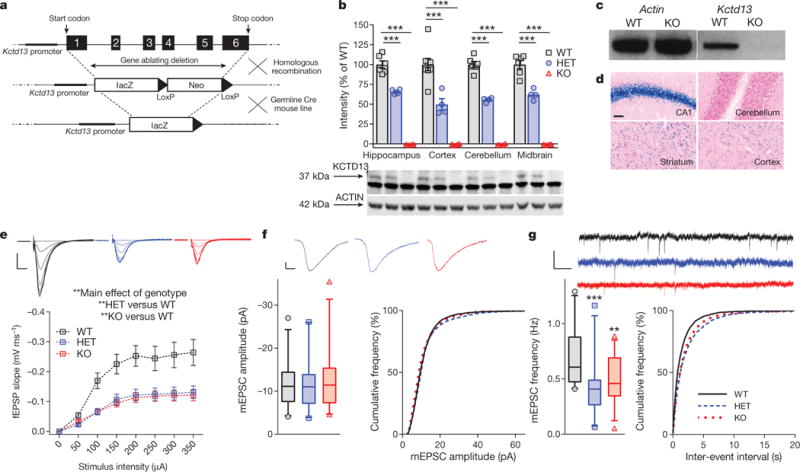
a, Kctd13 deletion targeting strategy. b, Western blots against KCTD13 confirm loss from multiple brain regions; mean ± s.e.m., P < 0.000001 (hippocampus: WT n = 6 mice; HET n = 4; KO n = 4; cortex: WT n = 8; HET n = 4; KO n = 4; cerebellum: WT n = 6; HET n = 4; KO n = 4; midbrain: WT n = 6; HET n = 4; KO n = 4). c, Reverse transcriptase PCR confirms lack of Kctd13 mRNA. d, Kctd13 promoter activity via β-galactosidase staining. Scale bar, 50 μm. e, Input/output curves of stimulus intensity versus fEPSP slope in Kctd13 mutants; P = 0.002 (WT n = 19/6 slices/mice; HET n = 14/7; KO n = 20/6) plotted as mean ± s.e.m. for clarity. Scale bar, 0.25 mV, 5 ms. f, CA1 pyramidal neuron mEPSC amplitude (left) and cumulative distribution of mEPSC amplitudes (right); P = 0.867 (WT n = 26/9 cells/mice; HET n = 24/7; KO n = 30/8). Scale bar, 2 pA, 5 ms. g, mEPSC frequency in CA1 neurons from Kctd13 mutants (left), and right-shift in cumulative distribution of inter-event frequency (right); P = 0.0007 (WT n = 26/9 cells/mice; HET n = 24/7; KO n = 30/8). Scale bar, 20 pA, 200 ms. *P < 0.05, **P < 0.01, ***P ≤ 0.001. Box (interquartile range), whiskers (5th–95th percentile confidence intervals), line (median) in box and whisker plots.
Kctd13 mutants demonstrated a significant reduction in synaptic transmission in area CA1 of the hippocampus compared with wild-type (WT) littermates (Fig. 1e–g). Extracellular recordings of field excitatory postsynaptic potentials (fEPSPs) revealed an approximately 50% reduction of fEPSP slope in Kctd13 mutants (Fig. 1e). The amplitude of CA1 pyramidal neuron miniature excitatory postsynaptic currents (mEPSCs) was unchanged (Fig. 1f), mostly ruling out a purely postsynaptic change. By contrast, a significant decrease in mEPSC frequency was seen in Kctd13 mutants (Fig. 1g). Decreased mEPSC frequency can suggest decreased presynaptic release probability or decreased functional synapse number. As an indirect correlate of presynaptic release probability, we observed no change in paired-pulse facilitation (Extended Data Fig. 1a). Using another indirect correlate of presynaptic release probability, we also measured the stimulus-evoked decay of NMDA (N-methyl-D-aspartate)-receptor-mediated EPSCs in CA1 pyramidal neurons in the presence of the relatively irreversible open-channel-blocker MK-801 (ref. 25). We found no change in the rate of decay of NMDA receptor (NMDAR)-mediated EPSCs (Extended Data Fig. 1b), indicating no detectable change in presynaptic release probability. Our findings are consistent with decreased Kctd13 resulting in decreased functional synapse number.
Because the number of excitatory synapses can correlate with dendritic length, complexity, or spine density, we performed Golgi stains of WT and Kctd13 mutants. Sholl analysis demonstrated a significant reduction in dendritic length (Extended Data Fig. 1c), complexity (Extended Data Fig. 1d), and dendritic spine density (Extended Data Fig. 1e) in Kctd13 mutants (representative images in Extended Data Fig. 1f, g). These structural differences support our conclusion of decreased synapse numbers in Kctd13 mutants, although additional, molecular-scale alterations may still play a role.
Because RhoA is a target of CUL3/KCTD13 ubiquitination and subsequent proteasomal degradation in HeLa cells15, we next hypothesized that reduction of Kctd13 alters synaptic transmission by increasing levels of the small GTPase RhoA. Kctd13 mutants had increased RhoA levels (Fig. 2a) with no change in other Rho family GTPases (Extended Data Fig. 2a).
Figure 2. Synaptic dysfunction in Kctd13 mutants associated with increased RhoA and rescued by RhoA inhibition.
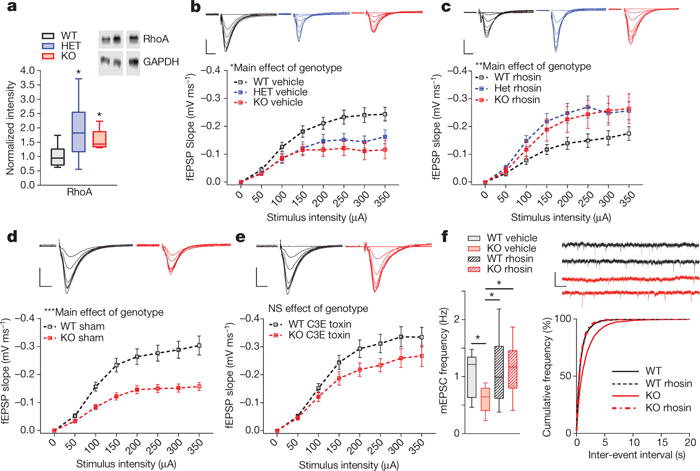
a, Western blots of hippocampi from Kctd13 mutants reveal increased RhoA; P = 0.007 (WT n = 14 mice; HET n = 11; KO n = 7). b, Decreased synaptic transmission replicated in vehicle-treated hippocampus; P = 0.024 (WT vehicle n = 18/6 slices/mice; HET vehicle n = 21/6; KO vehicle n = 19/6). Inset c, d: representative traces. Scale bar, 0.25 mV, 5 ms (b–e plotted as mean ± s.e.m. for clarity) c, Slice incubation for 3.5 h with rhosin (50 μM) reversed synaptic deficits in Kctd13 mutants; P = 0.005 (WT rhosin n = 18/5 slices/mice; HET rhosin n = 15/5; KO rhosin n = 20/6). d, Decreased synaptic transmission in Kctd13 mutants replicated in vehicle-treated slices; P = 0.001 (WT vehicle n = 27/10 slices/mice; KO vehicle n = 16/8). Inset: representative fEPSP traces. Scale bar, 0.25 mV, 5 ms. e, Slice incubation (3.5 h) with C3 (1 mg ml−1) reverses synaptic transmission deficits; NS, non-significant; P = 0.156 (WT C3 n = 24/10 slices/mice; KO C3 n = 16/8). Inset, representative fEPSP traces. Scale bar, 0.25 mV, 5 ms. f, Rhosin incubation reversed mEPSC frequency deficit (left), cumulative distribution of inter-event frequency (right); P = 0.016 (WT vehicle n = 12/4 cells/mice; KO vehicle n = 17/4; WT rhosin n = 17/4; KO rhosin n = 18/4). Inset: representative mEPSC traces. Scale bar, 25 pA, 200 ms. *P < 0.05, ***P < 0.001. Box (interquartile range), whiskers (5th–95th percentile confidence intervals), line (median) in box and whisker plots.
If increased RhoA causes synaptic dysfunction, RhoA inhibition should ameliorate the Kctd13 mutant synaptic phenotype. Thus, we examined effects of the small molecule RhoA inhibitor, rhosin26. In vehicle-treated hippocampus, we replicated decreased synaptic transmission in Kctd13 mutants (Fig. 2b). Incubation of slices in 50 μM rhosin, a selective inhibitor of RhoA/B/C27, for 3.5 h reversed synaptic transmission deficits to vehicle-treated WT levels in Kctd13 mutants (Fig. 2c). The trend towards reduced synaptic transmission in rhosin-treated versus vehicle-treated WT is not significant and is opposite to rhosin’s effect on Kctd13 mutants (Fig. 2b, c and Extended Data Fig. 2b).
To reduce potential off-target effects, we repeated this experiment using a structurally and mechanistically distinct RhoA/B/C inhibitor26,28 derived from exoenzyme C3 transferase of Clostridium botulinum with a cell-penetrating moiety. Again, vehicle-treated slices replicated decreased synaptic transmission in Kctd13 KO slices (Fig. 2d), and incubation in C3 RhoA inhibitor rescued decreased synaptic transmission in Kctd13 KO to the level of vehicle-treated WT (Fig. 2e and Extended Data Fig. 2c).
To further confirm that increased RhoA is responsible for synaptic deficits, we measured mEPSCs in slices treated with vehicle or rhosin. Rhosin treatment had no effect on mESPC amplitude (Extended Data Fig. 2d) but rescued decreased mEPSC frequency in Kctd13 KO mutants to vehicle-treated WT levels (Fig. 2f). Our data are consistent with reduction of Kctd13 resulting in elevated RhoA, which in turn reduces functional synapse number.
These data suggest a model wherein KCTD13, probably in coordination with the E3 ubiquitin ligase CUL3 (refs 9, 15, 29), regulates levels of RhoA in post-mitotic neurons to modulate synaptic transmission (Extended Data Fig. 2e). Although our model does not address whether effects of Kctd13 deletion are initiated pre- or postsynaptically, previous studies in neuronal and slice cultures suggest RhoA effects on dendrites and spines can be postsynaptic and cell-autonomous17,20,21. Reduced synaptic transmission is a plausible mechanism whereby genetic deletions that include Kctd13 may contribute to neuropsychiatric disorder susceptibility.
Additional experiments extended our findings to other cortical regions and to inhibitory synapses (Extended Data Fig. 3).
Because patients with 16p11.2 deletion are often overweight4, we measured body weight in our Kctd13 mutants at 12 weeks of age and found no change at this time point (Extended Data Fig. 4a–c). Taken together with Extended Data Fig. 4d, Kctd13 is unlikely to be a major, independent driver of increased body weight in 16p11.2 deletion.
In a previous zebrafish study, morpholino-mediated knockdown of kctd13 led to increased brain size and cell proliferation8; short hairpin RNA (shRNA)-mediated knockdown of Kctd13 via in utero electroporation (IUE) in mice led to increased cell proliferation8. Our global Kctd13 mutant allowed us to test the role of Kctd13 in mammalian brain cell proliferation and development using a disease-relevant model in which every cell was selectively deficient in Kctd13.
We examined brain size to determine whether deletion of Kctd13 was independently involved in macrocephaly identified in 16p11.2 deletions. Reduction of Kctd13 did not alter brain weight (Extended Data Fig. 4e–j) at approximately 12 weeks of age. MRI of Kctd13 mutants at postnatal day 7 (P7) showed no change in any of 56 brain regions or in total brain volume (Extended Data Fig. 5a–c). MRI of Kctd13 mutants at 12 weeks of age also showed no change in any of 159 independent brain regions or in total brain volume (Extended Data Fig. 5d–f).
Nor did Kctd13 reduction alter mammalian embryonic or adult brain cellular proliferation or neurogenesis. Proliferation of adult (12-week-old) neuronal precursors (Ki67+ cell number) and genesis of immature neurons (doublecortin+ cell number) in the subgranular zone of dentate gyrus were similar in Kctd13 mutants and WT (Extended Data Fig. 6a–d). In addition, survival of adult-generated cells (5-bromodeoxyuridine (BrdU+) cell number 4 weeks after BrdU) was similar in Kctd13 mutants and WT (Extended Data Fig. 6e, f). Embryonic stem cell proliferation was unchanged in Kctd13 mutants at embryonic day 15.5 (E15.5) measured both by BrdU+ cells 2 h after BrdU injection (Fig. 3a and Extended Data Fig. 6g) and by Ki67+ cells (Fig. 3b and Extended Data Fig. 6h). To mimic methodology used in a previous publication8, counts of BrdU/GFP double-labelled cells after IUE were unchanged embryonically in our Kctd13 mutants (Fig. 3c).
Figure 3. Deletion of Kctd13 or kctd13 does not affect brain size or neurogenesis in mice or zebrafish.
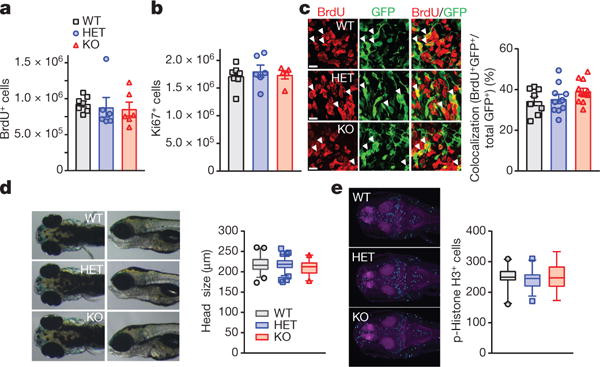
a, b, Embryonic cell proliferation at E15.5 in mice (WT n = 6 mice; HET n = 5; KO n = 5) BrdU (a), P = 0.860; Ki67 (b), P = 0.757. c, No difference in cells double-labelled for BrdU and GFP in mice; P = 0.167 (WT n = 8 mice; HET n = 10; KO n = 12). Scale bar, 20 μm. d, Zebrafish head size not affected; P = 0.079 (WT n = 44 zebrafish; HET n = 93; KO n = 22). e, Phospho-histone H3 staining unchanged in zebrafish; P = 0.800 (WT n = 21 zebrafish; HET n = 36; KO n = 14). Values represent mean ± s.e.m. in a–c. Box (interquartile range), whiskers (5th–95th percentile confidence intervals), line (median) in box and whisker plots in d, e.
Because an IUE study also implicated Kctd13 in neuronal migration and cortical layering30, we examined cortical layer-selective markers Ctip2, Satb2, and Tbr1 in P17 mice and found no differences in cortical layering in Kctd13 mutants at P17 (Extended Data Fig. 7a–j). Extended Data Fig. 8 supports unchanged cortical layering at embryonic day 15 (E15).
To examine cross-species differences, we deleted kctd13 from zebrafish and examined brain size and cell proliferation. We found no change in zebrafish brain size measured by inter-ocular distance8 (Fig. 3d). Phospho-histone H3 staining at 4.5 days post-fertilization demonstrated no change in cell proliferation (Fig. 3e). To determine whether RhoA levels were increased, we examined RhoA protein levels in kctd13 WT and mutant zebrafish by whole-brain immunofluorescence and western blot. Both methods revealed increased RhoA in zebrafish kctd13 homozygotes (Extended Data Fig. 9a–c).
When Kctd13 was selectively and globally reduced or deleted in mice, we found no change in multiple measures of brain size, embryonic cell proliferation, neurogenesis, or cortical layering/migration. Given that previous studies of cultured cells, of brain slice culture, and of IUE over-expression of WT or active RhoA suggest effects on cell proliferation and migration (for references, see Supplementary Information), we determined the developmental time course of increased RhoA expression in Kctd13 mutant brains. Kctd13 deletion does not lead to elevated RhoA until after P7 (Extended Data Fig. 9d). Thus, compensation for loss of Kctd13 or other mechanisms maintaining RhoA levels may be present during early brain development. Because increased RhoA in Kctd13 mutants occurs later in development, our data do not challenge the role that RhoA may play in early brain development including neurogenesis or cortical layering/migration.
We propose several potential explanations for why our data differ from a previous study of kctd13 in zebrafish and of Kctd13 in mice8. First, the previous study used shRNA and morpholinos, approaches that may have off-target effects (for references, see Supplementary Information) not controlled for in previous experiments8. Second, previous IUE work in mice knocked down levels of Kctd13 in only a subset of neural progenitors; this may have resulted in ‘competition’ with nearby WT neural progenitors for resources modulating embryonic neurogenesis. Third, both shRNA IUE in mice and morpholino approaches in zebrafish may not result in the same compensation as in genetic knockout (for reference, see Supplementary Information). Alternatively, other genes in the 16p11.2 region may act alone, in combination, or in concert with Kctd13 to alter brain size.
None of the 29 genes in the 16p11.2 region has yet been individually implicated in human autism spectrum disorders (for reference, see Supplementary Information), causing geneticists and others to suggest that this recurrent deletion syndrome is polygenic in nature rather than the result of deletion of a single gene within the region. Thus, we hypothesized that Kctd13 deletion alone would not be sufficient to induce multiple behavioural abnormalities with face validity to autism or associated neuropsychiatric disorders such as attention-deficit/hyperactivity disorder. Indeed, extensive behavioural analysis of Kctd13 mutants largely supported this hypothesis. We did identify increased locomotor activity as the primary altered behavioural phenotype in Kctd13 mutants (Extended Data Fig. 10a, b). This phenotype may have some face validity for the approximately 20% incidence of attention-deficit/hyperactivity disorder in patients with 16p11.2 (for reference, see Supplementary Information). Additional behavioural results are in Extended Data Fig. 10.
In summary, we provide experimental evidence in mammals that global Kctd13 reduction leads to increased RhoA levels that reduce synaptic transmission (Extended Data Fig. 2e). Moreover, early, global Kctd13 or kctd13 reduction does not alter brain size or neural progenitor cell proliferation in mice or zebrafish. The presence of synaptic phenotypes in heterozygotes emphasizes the potential relevance to patients with KCTD13 haploinsufficiency. Inhibition of RhoA in hippocampal slices reverses the effects of Kctd13 deletion on synaptic transmission, implicating RhoA as a potential therapeutic target for neuropsychiatric disorders associated with copy-number variants that include Kctd13.
METHODS
Generation of Kctd13 knockout mice
Kctd13 tm1 (KOMP) Vlcg (Velocigene) targeted embryonic stem cells (embryonic stem cell line VGB6; strain C57BL/6NTac) were obtained from the University of California, Davis, Knockout Mouse Project (KOMP) Repository. These embryonic stem cells carry the targeting construct designed to replace the entire Mus musculus Kctd13 gene (from second reading frame to 17th base pair (bp) after stop codon of the gene, total 16,080 bp). This construct was created as a ZEN-UB1 cassette (assembled by combining a LacZ-p(A) gene and a hUBCpro-neo-p(A) cassette flanked by two loxP sequences). The neo cassette provided a positive selection marker for the targeted embryonic stem cell clones. The LacZ-p(A) gene provided a reporter for Kctd13 promoter activity. Embryonic stem cell clones were injected into blastocysts (background albino c57BL/6) to generate chimaeras at the Transgenic Facility of University of Texas Southwestern Medical Center at Dallas. Resulting chimaeric mice were bred with C57BL/6J mice to confirm germline transmission identified by PCR with three primers as follows: forward (1), SD-sense (CTCGGATCTTTGAGGAGACAC); reverse, SD (TGTGGCTGATAGCACTGTCC); forward (2), NeoFwd (TCATTCTCAGTATTGTTTTGCC). WT DNA produced a 546-bp band. The knock-in targeting construct to replace the Kctd13 gene DNA produced a 408-bp band. To confirm correct targeting, genomic DNAs from WT and knock-in mice were analysed by Southern blotting with a probe that distinguished between the WT and knock-in Kctd13 alleles. The WT DNA resulted in a 5,790-bp band while knock-in DNA resulted in a 9,454-bp band (not shown). Knock-in mice were further crossed with germline-cre-expressing, B6.C-Tg(CMV-Cre), Cgn/J mice (The Jackson Laboratory; background C57BL/6J) to remove the hUBCpro-neo-p(A) cassette. Successful removal of this selection cassette was identified by PCR using three primers as follows: forward, SU-sense-1 (GCGGTATTCTCCATCCACATGAACAAGG); reverse (1), SU-anti-1 (TGGGACTAGGGAGCCTGGAATGAACTG); reverse (2), LacZ-Rev (GCTGGCTTGGTCTGTCTGTCCTAGC). WT DNA produced a 659 bp band while KO (knockout Kctd13 and neo) DNA produced a 487 bp band (not shown). We also performed RT-PCR to confirm loss of Kctd13 mRNA in the KO mice (forward, GTGAAGCTTCTACACAACCGCAG; reverse, AAGATGTTCAGTGTCTCCTCAAAG; band = 267 bp). The resulting constitutive Kctd13 deletion mice were bred as HET × HET for all experiments. All animal care and use were approved by University of Texas Southwestern Medical Center Institutional Animal Care and Use Committee and were compliant with US Government principles about the care and use of animals, Public Health Service Policy on Humane Care and Use of Laboratory Animals, Guide for the Care and Use of Laboratory Animals, and the Animal Welfare Act. Animal husbandry was performed in a facility accredited by the Association for Assessment and Accreditation of Laboratory Animal Care International.
Electrophysiology
All electrophysiology studies were performed by an experimenter blind to genotype.
Extracellular field recordings
Male mice, 4–6 weeks old, were anaesthetized briefly with isoflurane (Baxter Healthcare Corporation) and rapidly decapitated to remove the brain, which was submerged in ice-cold, sucrose-based cutting solution containing the following (in mM) 75 sucrose, 87 NaCl, 3 KCl, 1.25 NaH2PO4, 7 MgSO4, 26 NaHCO3, 20 dextrose, and 0.5 CaCl2. Acute coronal hippocampal slices were cut 350 μm thick using a vibrating microtome (Leica VT 1000 S). To reduce recurrent excitation of CA3 neurons, a cut was made between CA3 and CA1. Slices were allowed to recover at 34 °C for 15 min in normal artificial cerebrospinal fluid containing (in mM) 124 NaCl, 5 KCl, 1.25 NaH2PO4, 2 MgCl2, 26 NaHCO3, 10 dextrose, and 1 CaCl2. Recovery continued for 45 min as slices were gradually cooled to room temperature before recording. All solutions were pH 7.4 and saturated with 95% O2/5% CO2.
All recordings were performed at 33 ± 0.5°C in artificial cerebrospinal fluid containing (in mM) 124 NaCl, 5 KCl, 1.25 NaH2PO4, 1 MgCl2, 26 NaHCO3, 10 dextrose, and 2 CaCl2 saturated with 95% O2/5% CO2, and all data were collected using Clampex (pClamp software suite version 10.2; Molecular Devices). CA3-CA1 Schaffer-collateral synapses were stimulated by a 100 μs, biphasic pulse through custom-made, nickel dichromate electrodes (A–M Systems) placed 400–500 μm laterally from the recording electrode and kept constant within this range for all experiments. Stimulation was controlled using a model 2200 stimulus isolator (A–M Systems). The recording electrode (1–3 MΩ) was filled with normal artificial cerebrospinal fluid containing (in mM) 124 NaCl, 5 KCl, 1.25 NaH2PO4, 1 MgCl2, 26 NHCO3, 10 dextrose, and 2 CaCl2 saturated with 95% O2/5% CO2 and placed in the stratum radiatum using an SZX7 dissecting microscope (Olympus) at 35 × magnification. Sample size for all extracellular field recordings represents number of hippocampal slices tested with two to four hippocampal slices used per mouse. Data were acquired at 10 kHz and filtered at 1–3 kHz using Multiclamp 700B amplifiers, a Digidata 1440 digitizer, and Clampex version 10.3 data acquisition software (Molecular Devices). Response size was determined by fitting a straight line to the initial slope (10–40%) of the fEPSP using automated analysis in Clampfit (pClamp software suite version 10.2; Molecular Devices). For paired-pulse ratio studies, the stimulus intensity was set to generate approximately 50% of the maximum fEPSP as determined by the input/output curve. All data are represented as mean ± s.e.m.
Whole-cell recordings
Male mice, p14–17, were anaesthetized briefly with isoflurane (Baxter Healthcare Corporation) and rapidly decapitated to remove the brain which was submerged in ice-cold, sucrose-based cutting solution containing (in mM) 75 sucrose, 87 NaCl, 3 KCl, 1.25 NaH2PO4, 7 MgSO4, 26 NaHCO3, 20 dextrose, and 0.5 CaCl2. Acute coronal hippocampal slices were cut 300 μm thick using a vibrating microtome (Leica VT 1000 S). To reduce recurrent excitation, a cut was made between CA3 and CA1. Slices were allowed to recover at 34 °C for 15 min in normal artificial cerebrospinal fluid containing (in mM) 124 NaCl, 5 KCl, 1.25 NaH2PO4, 2 MgCl2, 26 NaHCO3, 10 dextrose, and 1 CaCl2. Recovery continued for 45 min as slices were gradually cooled to room temperature before recording at 33 °C. All solutions were pH 7.4 and saturated with 95% O2/5% CO2.
All whole-cell patch-clamp recordings of EPSCs were performed with 100 μM picrotoxin present in the artificial cerebrospinal fluid to block fast inhibitory transmission. The recording electrode (4–6 MΩ) contained (in mM) 110 Cs-methanesulfonate, 115 CsCl, 8 NaCl, 10 tetraethylammonium-Cl, 2 EGTA, 10 HEPES, 2 Na-ATP, and 0.3 GTP-Tris. pH was 7.4, 290–300 mOsm. Cs-methanesulfonate and CsCl were obtained from Sigma-Aldrich. CA1 neurons were visualized under 80 × magnification using an AxioExaminer D1 differential interface contrast microscope (Zeiss). Whole-cell patch-clamp recordings of mIPSCs onto CA1 pyramidal neurons were recorded from a holding potential of −70 mV in the presence of 1 μm tetrodotoxin, 50 μm D-APV, and 20 μm NBQX. Internal solution consisted of (in mM) 110 Cs-methanesulfonate, 115 CsCl, 8 NaCl, 2 EGTA, 10 tetraethylammonium-Cl, 10 HEPES, 2 Na-ATP, 3 GTP-Tris; pH 7.4, 290-300 mOsm. For each cell, 5-min continuous recordings were analysed after stabilization of the holding potential approximately 2–5 min after break-in.
Use-dependent block of NMDAR-currents
Macroscopic NMDAR-currents were recorded at negative potentials in artificial cerebrospinal fluid with low (0.2 mM) Mg2+ and in the presence of saturating concentrations of picrotoxin (100 μM) and 2,3-dihydroxy-6-nitro-7-sulfamoyl-benzo[f]quinoxaline-2,3-dione (NBQX, 10 μM). This extracellular solution was perfused at a rate of 2.5 ml min−1. After baseline recording, cells were perfused with 20 μM MK-801 for 2 min without stimulation, and stimulation was reinstated afterwards. A 200-ms window was used to determine charge transfer for each event. MK-801 block onset was determined visually and considered to be the first event where currents were decreasing consistently. Charge-transfer data points correspond to the averages of three consecutive events.
Miniature events
Following break-in, mEPSCs were recorded for 15–20 min at a holding potential of −70 mV in the presence of 1 μM tetrodotoxin, which blocks evoked synaptic transmission. Only mEPSCs beginning 5 min after break-in were analysed. Recordings were rejected if the holding current or series resistance varied by more than 25% during the recording. Samples are represented by the total number of cells from more than five mice per group. Raw data were analysed using Clampfit (pClamp software suite version 10.2; Molecular Devices). Statistical analysis was performed using GraphPad Prism.
Rho inhibitor incubations
After the initial 1 h slice recovery period, slices were transferred to an incubation chamber containing (in mM) 124 NaCl, 5 KCl, 1.25 NaH2PO4, 2 MgCl2, 26 NaHCO3, 10 dextrose, 1 CaCl2, 0.05 rhosin (555460, Millipore) or 1.0 μg ml−1 CT04 (CT04 Cytoskeleton) saturated with 95% O2/5% CO2. Slice incubation with Rho inhibitors continued for a minimum of 3.5 h followed by extracellular field or intracellular whole-cell recordings. mEPSCs were recorded at a holding potential of −70 mV.
Western blot and antibodies
Fresh hippocampal tissue was isolated by rapid decapitation/dissection of males and females and lysed in ice-cold RIPA buffer (89901, ThermoScientific) supplemented with Halt Protease and Phosphatase Inhibitor cocktail (78446, ThermoScientific). Individual samples were sonicated, centrifuged at 4 °C for 1 min at 1,000 r.p.m., diluted in 4× Laemmli sample buffer containing β-mercaptoethanol (Bio-Rad), and incubated at 100 °C for 5 min. Protein concentration was determined by BCA Protein Assay (23225, ThermoScientific). Samples were diluted with sample buffer such that 5–25 μg of protein were loaded per lane onto Criterion TGX gels either 10% or 12% (Bio-Rad). Gels were run and then transferred to nitrocellulose membranes, blocked in Odyssey Blocking Buffer (927–40000, LI-COR), and incubated with primary antibody overnight at 4 °C. Membranes were washed in 5% TBS-T followed by a 1 h secondary antibody incubation at room temperature using infrared fluorescence IRDye anti-Rabbit (926-32212) or anti-mouse (926-68071, LI-COR) antibodies at 1:10,000. Proteins were visualized with Odyssey fc imager (LI-COR). Signals were quantified using Image Studio Lite (LI-COR), normalized to β-actin or GAPDH, and analysed using Microsoft Excel and GraphPad Prism. Antibodies used were KCTD13 (HPA043524, Atlas Antibodies, 1:400), RhoA (2117, Cell Signaling, USA, 1:1,000), and actin (MABT825, Sigma-Aldrich, 1:50,000). Both KCTD13 and RhoA antibody bands were verified using corresponding KO brain tissue (RhoA KO brain tissue was a gift from K. Tolias). For RhoA western blots, samples were homogenized and assayed on the same day, and electrophoresed the same day or within 24 h.
All statistical analysis used Microsoft Excel and GraphPad Prism.
MRI
Mice were anaesthetized with ketamine/xylazine and intracardially perfused (rate 1 ml min−1) with 15 ml of 0.1 M phosphate-buffered saline (PBS) containing 10 U ml−1 heparin and 2 mM ProHance (Bracco Diagnostics, a gadolinium contrast agent) followed by 15 ml of 4% paraformaldehyde containing 2 mM ProHance31. After perfusion, mice were decapitated and the skin, lower jaw, ears, and the cartilaginous nose tip were removed. The brain and remaining skull structures were incubated in 4% paraformaldehyde + 2 mM ProHance overnight at 4°C, then transferred to 0.1 M PBS containing 2 mM ProHance and 0.02% sodium azide for at least 1 month before MRI scanning32.
A multi-channel 7.0 T MRI scanner (Agilent) was used to image the brains within the skulls. Sixteen custom-built solenoid coils were used to image the brains in parallel33,34.
For the two different age groups, different sequences were required. To get the contrast required for image registration at P7, a three-dimensional diffusion-weighted, fast spin-echo sequence with an echo train length of 6 was used, with a repetition time (TR) of 270 ms, first echo time (TE) of 30 ms, and a TE of 10 ms for the remaining five echoes, two averages, field-of-view 14 mm × 14 mm × 25 mm and a matrix size of 250 × 250 × 450 yielding an image with 0.056 mm isotropic voxels. Six high b-value images (b = 2,147 s mm−2) in six orthogonal directions were acquired. This was done to acquire an improved grey/white matter contrast at the young age. Total imaging time was 14 h. The high b-value images were averaged to create a single diffusion-weighted image that had the contrast required for image registration. For the adult brains, a T2-weighted three-dimensional fast spin-echo sequence was also used, with a cylindrical acquisition of k-space, and with a TR of 350 ms, and TE of 12 ms per echo for six echoes, two averages, field-of-view of 20 mm × 20 mm × 25 mm and matrix size = 504 × 504 × 630, giving an image with 0.040 mm isotropic voxels35. The scan time required for this sequence was also approximately 14 h.
To visualize and compare any differences in the mouse brains, the images from each age group were linearly (6 parameters followed by 12 parameters) and nonlinearly registered together separated by age group. All scans were then resampled with the appropriate transform and averaged to create a population atlas representing the average anatomy of the study sample. The result of the registration was to have all scans deformed into alignment with each other in an unbiased fashion. This allowed for the analysis of the deformations needed to take each individual mouse’s anatomy into this final atlas space, the goal being to model how the deformation fields related to genotype36,37. The Jacobian determinants of the deformation fields were then calculated as measures of volume at each voxel. Significant volume differences could then be calculated by warping pre-existing classified MRI atlases onto the population atlas. For the P7 mouse brains, this allowed the volume of 56 segmented structures encompassing cortical lobes, large white matter structures (that is, corpus callosum), ventricles, cerebellum, brain stem, and olfactory bulbs38 to be assessed in all brains. For the adult brains, the atlas included further delineations of the cortex39 and cerebellum40, which increased the number of structures in the atlas to 159. In both age groups, these measurements could be examined on a voxel-wise basis to localize the differences found within regions or across the brain. Multiple comparisons in this study were controlled for by using the false discovery rate41.
IUE
All IUE experiments were performed and analysed by experimenters blind to genotype in mixed males and females. Timed-pregnant mice (E13.5) were obtained and deeply anaesthetized with isoflurane (1.5–3% in oxygen) for IUE surgery. Plasmid pCAG-GFP (11150, Addgene) (1–2 μg μl−1) was microinjected into the lateral ventricles of E13.5 embryos to target layer 6 neurons of the cortex. The embryo was held through the uterus with platinum plate electrode tweezers (CUY650P3; Protech International) and electroporated (five, 50 ms pulses of 33 V with an interval of 950 ms; CUY21SC electroporator, NEPA GENE)42–46. After the IUE surgery, buprenorphine (1 mg kg−1 (body weight)) was administered into the wound to alleviate discomfort. At E15.5, pregnant dams were injected intraperitoneally with 150 mg kg−1 (body weight) of BrdU. Two hours later, brains from electroporated pups were collected, fixed with paraformaldehyde overnight, and dehydrated with 30% sucrose. Tissue was cryosectioned at 20 μm. Fluorescent double-staining (GFP and BrdU) was performed as described below.
IUE image processing
The slides stained with GFP and BrdU antibodies were imaged using a Zeiss LSM880 Inverted Microscope. The confocal images with 1 μm Z-stacks were collected with a 63 × objective lens and Zen software (Zeiss). Cells positive for GFP and for both GFP and BrdU in a 100 μm2 region of interest were counted using Cell Counter plugin, Fiji ImageJ. The ratio of GFP+/BrdU+ to GFP+ cells was calculated and graphed.
Zebrafish image processing
Zebrafish larvae were imaged using a Zeiss LSM780 upright microscope. The confocal images with 2 μm Z-stacks were collected with a 20× objective lens and Zen software (Zeiss). Cells positive for both phosphohistone H3 and total Erk stain were counted in the entire brain (excluding the spinal cord) using Cell Counter plugin, Fiji ImageJ.
BrdU injections
To study adult neurogenesis and cell survival, 8-week-old mice were injected intraperitoneally with 150 mg kg−1 (body weight) of BrdU (B5002, Sigma-Aldrich). Tissue was collected 4 weeks after BrdU administration. To examine embryonic neurogenesis, E15.5 pregnant females were injected with 150 mg kg−1 (body weight) of BrdU, and embryonic brains were collected 2 h later.
Histology
Experimenters blind to genotype analysed all histology experiments.
Non-fluorescent immunohistochemistry
Mixed male and female mice were transcardially perfused with 0.1 M PBS followed by 4% paraformaldehyde (NC9245948, Fisher, Hampton, New Hampshire, USA). Brains were removed, fixed with paraformaldehyde for 24 h, and dehydrated with 30% sucrose. Tissue was coronally sectioned in a series of ten (1:10) on a sliding microtome at 30 μm. Slide-mounted sections were incubated with 3% H2O2, 10% methanol in 0.1 M PBS, and then blocked in 5% serum, 0.2% Triton X-100 in 0.1 M PBS. Primary antibodies were diluted in the antibody solution (5% serum in 0.1 M PBS) and applied overnight at room temperature. Slides were next incubated for 1 h with secondary antibodies (1:3,000, Vector Labs) followed by an avidin-biotin-horseradish peroxidase complex formed with a VECTASTAIN ABC kit (PK-4000, Vector Labs). Exposure for 10 min to Metal-Enhanced DAB (34065, ThermoScientific) was performed to visualize the stain. Dehydration was performed with a series of 5 min ethanol dilutions (75%, 95%, 100%) and CitriSolv (04-355-121, Fisher) incubation and coverslips were mounted with DPX mounting medium. For experiments involving BrdU staining, tissue was treated with 2 M HCl for 30 min and washed with 0.1 M borax solution before blocking the endogenous peroxidase. Antibodies used were BrdU (1:400, 6326, Abcam), Doublecortin (1:3,000, 8066), and Ki67 (1:400, MA5-14520, Thermo Scientific).
X-gal staining
Slide-mounted brain sections were washed with 0.1 M PBS and incubated in X-gal (5-bromo-4-chloro-3-indolyl-β-D-galactoside) staining solution (5 mM K3Fe(CN)6, 5 mM K4Fe(CN)6-3H2O, 2 mM MgCl2, 1 mg ml−1 X-gal (15520-034, Invitrogen)) for 6 h. Slides were then washed with 0.1 M PBS and counterstained with Fast Red Nuclear solution (N3020, Sigma-Aldrich). The images were acquired using a Nanozoomer (Hamamatsu) slide scanner at 40 × magnification.
Fluorescent immunohistochemistry
Cryosectioned E15.5 brain sections (20 μm) or slide-mounted adult brain sections (30 μm) were incubated in blocking solution (0.2% Triton X-100, 10% serum, 1% BSA in 0.1 M PBS) for 1 h. Primary antibodies were diluted in 5% serum and 0.1 M PBS and were incubated overnight. Secondary antibodies (1:1,000, Invitrogen) were applied for 1 h at room temperature. After extensive washing, sections were counterstained with DAPI (5 mg ml−1, D3571, Thermo Fisher) for 1 min. ProLong gold mounting media (Thermo Fisher, P36930) were used to secure coverslips. Antibodies used were GFP (1:1,000, ab13970), Tbr1 (1:100, ab31940), Tbr2 (1:100, ab23345), Ctip2 (1:100, ab18465), Satb2 (1:10, ab92446, Abcam), Cux1 (1:50, 13024), and Tuj1 (1:1,000, mms-435p, BioLegend).
Quantification of cortical markers
Images used for quantification of cortical markers were acquired at a magnification of 40 × on an Olympus BX51 microscope. Cell counts, layer thicknesses, and mean fluorescence intensities were measured using ImageJ software. Adult brain tissue (P17) was used for Ctip2, Cux1, Tbr1, and Satb2 cortical markers, and embryonic tissue (E15) was used for Tbr1, Tbr2, and TuJ1 cortical markers. For adult neuronal markers, the positively labelled cells within a fixed cross-sectional area for each marker were counted using the ImageJ ‘analyze particle’ function for four or five slices per animal, and this value was averaged across animals per group and reported as the cell count. For embryonic marker TuJ1, because the density of labelled cells was too high, we measured mean fluorescence intensity of the positively stained region for four or five slices per animal, and this value was averaged across animals per group and reported as the mean fluorescence intensity. For Tbr1 and Tbr2 embryonic stains, mean cell counts were measured and reported as detailed above. Additionally, the thickness of each positively labelled layer was measured using ImageJ line function for four or five slices per animal, and this value was averaged across animals per group and reported as the layer thickness (in micrometres). Markers were selected on the basis of staining patterns described in ref. 47.
Stereology
All stereology experiments were analysed by experimenters blind to genotype. Counting of labelled cells was performed manually for Ki67 and BrdU in adult mouse brains at a magnification of 40× on an Olympus BX51 microscope. All labelled cells within the subgranular zone of the dentate gyrus were counted in every ten sections from one complete series for each mouse. To account for the whole dentate gyrus, final quantification was obtained by adding the cell counts from all sections and multiplying the total by the number of series (ten). Photomicrograph images were taken using a Nanozoomer (Hamamatsu) slide scanner at 40× magnification.
For the embryonic stains (Ki67, BrdU) and doublecortin in the adult brain, the density of labelled cells was too high to accurately and reliably count manually. Therefore, the optical fractionator stereological technique was used in which total cell number was calculated on the basis of cell counts performed in several sampling sites (MBF Bioscience; http://www.stereology.info/the-optical-fractionator/)48. For doublecortin quantification, the dentate gyrus was outlined in every hippocampal section from one complete series, and the StereoInvestigator program (MBF Bioscience) was used to select random sampling sites for cell counts. Final calculation of total cell number was performed by the StereoInvestigator program on the basis of the total area outlined in every section and cell counts obtained from each sampling site (MBF Bioscience; http://www.stereology.info/the-optical-fractionator/). The StereoInvestigator program was also used in embryonic mouse brains to outline and select sampling sites from the subventricular zone of four sections per animal. Density of cell counts was obtained by dividing the calculated total number of cells by the calculated volume.
Fish husbandry and microinjection
All protocols and procedures involving zebrafish were approved by the Harvard University/Faculty of Arts and Sciences Standing Committee on the Use of Animals in Research and Teaching (protocol 25-08). The kctd13 mutant, ZFIN mutant line kctd13a160, was generated by simultaneous injection of four guide RNAs (gRNAs) and approximately 0.5 nl of 50 μM Cas9 protein, both generated as previously described49 into embryos from a nacre (mitfa−/−)50 line crossed to an EK line. The gRNAs targeted the following four genomic loci: GGGTGGTGTTGGACCGATGCGGG, GTGTTGAACTTCCTGCGGGACGG, AGATAGCACGAGGGAGCTGGAGG, and GCCTCTCCACATTACAGGTCAGG. The resulting mosaic adult with a germline mutagenic deletion was crossed to EK, and the offspring were mated to each other to generate homozygous mutants. The out-of-frame mutant, a 46-bp insertion at the first gRNA target and 37-bp deletion between the second and third gRNA targets, was identified and sequenced using the following two primers: CTCAGAGATGCACATTTAAACATGTGTCC (F) and GCTGTCTGTG TTTCCATTATTAATCAAACAAC (R). Subsequently, the mutant was genotyped using the following two primers: CTCAGAGATGCACATTTAAACATGTGTCC (F) and AGGAAGTTCAACACCAGGGAAAAGTG (R). Mutant DNA produced a product of size 143 bp, while WT DNA produced a product of size 97 bp.
The mutant allele is predicted to generate a truncated protein with the following sequence: MSAEASGSSGGHAVTVSGSSPSSSSHVGEEKPGRSLVSSKYVKLNVGGTLHYTTVQTLSKEDSLLRSICDGSTEVSIDSEGWVVLDRIRLVRYQLK-.
This was compared with the following WT sequence: MSAEASGSSGGHAVTVSGSSPSSSSHVGEEKPGRSLVSSKYVKLNVGGTLHYTTVQTLSKEDSLLRSICDGSTEVSIDSEGWVVLDRCGRHFSLVLNFLRDGTVPLPDSTRELEEVLKEAQYYRLQGLVQHCLSTLQKRRDVCRGCHIPMITSAKEEQRMIATCRKPVVKLQNNRGNNKYSYTSNSDDNLLKNIELFDKLGLRFNGRVLFIKDVLGDEICCWSFYGEGRKIAEVCCTSIVYATEKKQTKVEFPEARIFEETLNILIYENGRGSGGMALLESGGVSSSGAGQSEEEGAGAGGGDRRVRRIHVRRHIMHDERGHGQQTVYKD-.
Zebrafish immunohistochemistry and western blotting
Antibody stains were performed as previously described51 and the pigment on fish was bleached after the antigen retrieval step with a 1% H2O2/3% KOH solution. Antibodies used were total ERK (1:500, Cell Signaling 4696) and phospho-histone H3 (1/500, Millipore 06-570).
For western blotting, whole adult brains were dissected and homogenized in RIPA buffer with protease inhibitors. Anti-α-tubulin from Sigma (T6074-200UL (020M4753)) was used as the control at 1/40,000 for approximately 45 min at room temperature, followed by horseradish-peroxidase-coupled mouse secondary antibody for 1 h at room temperature. RhoA antibody from Cytoskeleton (http://www.cytoskeleton.com/arh04) was used at 1/500 overnight at 4 °C. Immunohistochemistry was performed as in ref. 51 with RhoA antibody from Cytoskeleton (http://www.cytoskeleton.com/arh04) freshly diluted in PBS at 1/100.
Zebrafish head size imaging
Live fish were anaesthetized in MS-222 (A-5040, Sigma-Aldrich, St. Louis, Missouri, USA) for imaging, and then PCR-quality genomic DNA was extracted with hot sodium hydroxide (HotSHOT method52) and neutralized with tris pH 8.0.
Behavioural overview
All mice used for behavioural testing were age- and sex-matched littermate progeny of heterozygous Kctd13 mutant crossings. An experimenter blind to genotypes performed all behavioural tests. The behavioural cohort consisted of the following sex- and age-matched littermate triplets and pairs: WT = 26, HET = 20, KO = 21 (male WT = 14, HET = 10, KO = 11; female WT = 12, HET = 10, KO = 10) for locomotor habituation, elevated plus maze, light/dark, open field, rotarod, hot plate, olfactory food finding, grooming, three-chamber sociability, and caged conspecific tests; WT = 26, HET = 22, KO = 21 (male WT = 14, HET = 10, KO = 11; female WT = 12, HET = 11, KO = 10) for nest building, fear conditioning, Morris water maze and pre-pulse inhibition tests; WT = 24, HET = 19, KO = 20 (male WT = 13, HET = 10, KO = 11; female WT = 11, HET = 9, KO = 10) for the novel object recognition test. Mice were 4–9 weeks apart, with the youngest age being 10 weeks. Behavioural tests were done in the order in which they appear in the Methods below. Statistica software was used to perform either two-way analyses of variance or three-way repeated measures analysis of variance with genotype and sex as the main variables and appropriate repeated measures. A Newman-Keuls post hoc test was applied to determine significant effects and interactions. See Supplementary Table 1 for detailed statistics. All behaviour tests were performed essentially as previously described except as noted below53–62.
Elevated plus maze
Mice were placed in the centre of the maze (open arms 30 × 5 cm; closed arms 30 × 5 × 25 cm) and allowed to freely explore the maze for 5 min. The light was set to approximately 7 lx. Noldus Ethovision version 3.1 was used to track and record mouse behaviour.
Dark/light test
Animals were placed in the dark chamber of light/dark test apparatus (light chamber 25 × 26 cm, 2,066 lx; dark chamber 25 × 26 cm, ~ 1 lx) and allowed to habituate for 2 min. After habituation, mice were allowed to explore both chambers freely for 10 min.
Open field
Mice were placed in one of the corners of an open arena (44 × 44 × 44 cm, ~7 lx) and allowed to freely explore for 10 min. Time spent in the centre of the arena (15 × 15 cm) and locomotor activity were measured. The behaviour was recorded and tracked by CleverSys TopScan software.
Locomotor habituation
Mice were placed in novel cages (a clean cage with the same dimensions as their home cage, 27.3 × 16.5 × 12.7 cm) with 1 inch of bedding and allowed to explore freely for 2 h under the red lighting. Horizontal locomotor activity (that is, the number of photobeam breaks) was measured by computer software (San Diego Instruments). Data were analysed and plotted in 5-min bins.
Rotarod
Mice were placed on a stationary rotarod (IITC Life Science). After the test began, the rod accelerated from 0 to 45 r.p.m. over 5 min. The latency to fall off the rod was measured if a mouse fell off the rod or held onto the rotating rod for two complete revolutions. Each mouse received four trials per day for 2 days.
Hotplate sensitivity
Mice were placed on a black, anodized plate that was held at a constant temperature of 52°C (IITC Life Sciences model 39 hotplate) covered with a Plexiglas enclosure. Mice were removed after the first hindpaw lick or after 30 s if no response was elicited.
Olfactory food finding
A peanut butter cookie was placed in the middle of a clean cage 1 inch below the surface of a thick layer (~ 10 cm) of bedding. Mice were placed in the cages and were allowed free exploration for 10 min. The test stopped when the mouse uncovered the cookie.
Grooming
Mice were placed in empty cages where they were habituated for 10 min followed by a 10 min scoring period by observer blind to genotype for time spent in any grooming behaviour (grooming the face, head, body, or tail). Scoring was from videotape.
Marble burying
Twenty marbles were evenly placed in a novel home cage with 5 cm of bedding. Mice were given 30 min to explore the cage in a well-lit room (~70 lx). After 30 min, the number of marbles buried was recorded. A marble was defined as buried when less than one-third of the marble was visible.
Nest building
A cotton nestlet (5.5 × 5.5 × 0.5 cm) was put in the middle of the cage in a well-lit room (~80 lx). The height and width of the nests were measured by a standard ruler at 30, 60, and 90 min time points.
Novel and spatial object recognition
Briefly, mice were habituated for 4 days to an open arena (44 × 44 × 44 cm, ~7 lx) with spatial cues attached to the inside of arena walls. Each mouse underwent one 5 min trial per day for 4 days of habituation. On the fifth day (test day), all animals received seven 5-min trials each with 6- or 45-min intervals. For the fifth trial, three identical objects were placed in the arena. Each object was approximately 12.5 cm from the closest wall. During the sixth trial (spatial test), one of the objects (object A) was relocated to the opposite corner. During the seventh trial (novel object test) a small statue replaced object B. The behaviour was recorded using CleverSys ObjectScan.
Three-chamber sociability
The test consisted of three 10-min trials. During the first trial, the mouse was allowed free exploration of the three-chamber apparatus. Each end-chamber contained an empty cage (upside-down pencil holder) with the middle chamber being empty. In the second 10-min trial, one of the end chambers contained a novel stimulus mouse while the opposite end-chamber contained an empty cage. The test mouse was given a choice between an inanimate cage and a caged, social target. Interaction with the targets was tracked and scored by CleverSys ObjectScan Software.
Caged conspecific test
Mice were placed into the open field arena (44 × 44 × 44 cm, ~7 lx) containing a clear plastic cage. The mouse was allowed to explore the arena for 5 min (trial 1). During the second, 5-min trial, a novel mouse was placed in the cage. Social interaction was tracked and scored by CleverSys SocialScan Software.
Fear conditioning
Mice were placed in a poly(methyl methacrylate) shock box with clear front and rear walls (MedAssociates). After a 2 min exploration period, three, 30-s, 90-dB acoustic conditioned stimuli (white noise) followed by a 2-s, 0.5-mA foot shock with 2-min inter-stimulus intervals were delivered. Mice remained in the chamber 2 min after the last conditioned stimulus/foot shock pairing. Freezing behaviour (motionless except respirations) was monitored at 5-s intervals by an observer blind to the genotype. To test 24 h contextual memory, animals were placed into the same training box for 5 min and scored for freezing behaviour every 5 s. To determine cue-dependent fear conditioning, mice were placed in a novel environment supplemented with vanilla odour for a 3 min baseline followed by 3 min of the conditioned stimulus (tone). Freezing behaviour was scored as for contextual fear conditioning.
Morris water maze
A 10 cm diameter circular platform was submerged approximately 1 cm below the surface of the opaque water (22 ± 1°C) in a 120 cm diameter pool. During the training, animals were placed pseudo-randomly into each of four starting locations for four daily trials. In each trial, mice swam until they found the hidden platform or were guided to it by the experimenter if the platform was not found within 60 s. Mice remained on the platform for 15 s before being returned to their home cage. Daily data were averaged across the four trials. Each animal received four trials per day during ten training days. On the 11th day, a 60 s probe test was conducted. During the probe test, mice were allowed to swim in the pool with no platform. To test basic visual function, the latency to reach the platform with a visible cue atop the platform was performed on day 12. During the visual test, mice were given three trials. The data were averaged across these three trials.
Pre-pulse inhibition and startle
Mice were placed inside a cylinder mounted atop a piezoelectric accelerometer that detected and transduced animal movements inside the startle chambers (San Diego Instruments). For pre-pulse inhibition, mice were subjected to five trial types in a 22 min session: pulse-alone (40 ms, 120 dB, white noise pulse), three different pre-pulse/pulse trials (20 ms pre-pulse of 4, 8, or 16 dB above background noise level of 70 dB preceded the 120 dB pulse by 100 ms onset-onset interval), and no-stimulus. All trials were presented pseudo-randomly with an average of 15 s (7–23 s) between the 62 trials. Before testing, mice were habituated to the cylinders for 5 min then tested in four blocks of test trials. The first and last blocks consisted of six pulse-alone trials. Blocks 2 and 3 each contained six pulse-alone trials, five of each level of pre-pulse/pulse trials, and five no-stimulus trials.
Statistical analysis
See Supplementary Table 1 for complete experimental statistics. All statistical analyses were performed using two-way analysis of variance with repeated measures if needed and Newman-Keuls post hoc testing. All statistical tests were two-sided. As per editorial guidelines, most data with n > 10 in all groups are plotted as box and whisker plots, with the box representing the interquartile range, whiskers representing the 5th–95th percentile range, and the line representing the median. When n ≤ 10 in at least one group, centre values are given or plotted as mean ± s.e.m. (error bars) with individual data points superimposed. Exceptions are made only for those plots that were too crowded or difficult to visualize using box and whisker plots, in which case mean ± s.e.m. alone was plotted for ease of viewing the results. For brain region MRI data, corrections for multiple comparisons were made. Exact n is provided for each experiment in the corresponding figure legend, including both cell/slice numbers and animal numbers with cell/slice used for statistical analysis. Sample size was chosen on the basis of previous experience of the investigators with similar experiments previously published. No animals or slices were excluded from the analysis. Randomization was performed by blinding the investigator to genotype and allowing them to choose each subject blindly. For studies using pharmacological agents, the investigator was aware of the agent being used, but was not aware of the genotypes of the animals used. Not all experiments were replicated. Demonstration of loss of Kctd13 was replicated. Decreased RhoA protein levels were replicated at different ages. Decreased synaptic transmission in Kctd13 mutants was replicated in vehicle-treated groups two additional times for extracellular field recordings. Decreased mEPSC frequency was replicated in vehicle-treated groups one additional time for whole-cell recordings. Inhibition of RhoA using two different drugs was a replication of sorts. X-gal staining was replicated multiple times, as were other qualitative immunohistochemistry and genotyping experiments. Replicates were biological rather than technical. Data met assumptions of statistical tests used in all cases. Variation was estimated using s.e.m. for all groups of data and was similar among the groups being statistically compared. See Supplementary Table 1 for detailed statistical analysis values for each experiment and figure.
Data availability
The datasets generated or analysed during the current study that support its findings are available from the corresponding author upon reasonable request.
Extended Data
Extended Data Figure 1. Loss of Kctd13 causes no change in indirect measures of presynaptic release probability and reduces CA1 pyramidal neuron dendritic length, branching, and spine density.
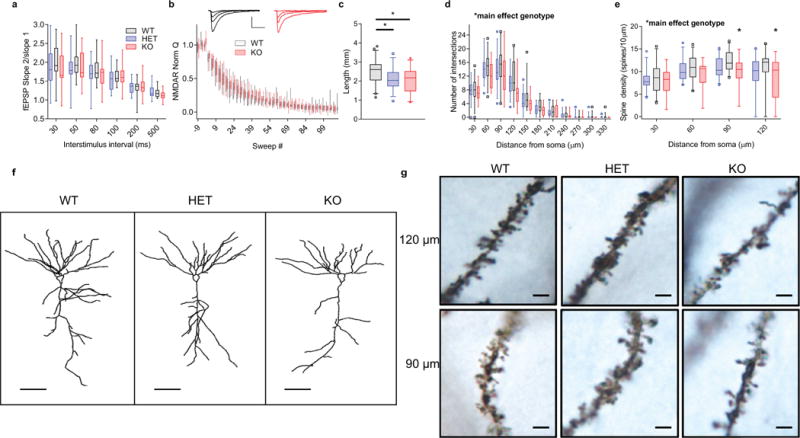
a, Paired-pulse ratio is unchanged at inter-stimulus intervals of 30–500 ms; P = 0.537 (WT n = 18/6 slices/mice; HET n = 17/7; KO n = 17/6). Scale bar, 0.1 mV, 25 ms. b, Rate of decay of NMDAR-mediated EPSC in presence of MK-801; P = 0.360 (WT n = 15/6 cells/mice; KO n = 12/6). Scale bar, 60 pA, 100 ms. c, Total dendritic length is decreased in CA1 pyramidal neurons of Kctd13 mutant mice (WT n = 43/11 neurons/mice; HET n = 33/11; KO n = 29/6). P = 0.011; post hoc: WT versus HET P = 0.14351; WT versus KO P = 0.0046, HET versus KO P = 0.069. d, Kctd13 homozygous mutants have decreased dendritic complexity at 60–120 μm. P = 0.022; post hoc: WT versus HET P = 0.27048; WT versus KO P = 0.0096; HET versus KO P = 0.06014. WT n = 30/11 cells/mice; HET n = 31/11; KO n = 17/6. e, Decreased spine density in CA1 pyramidal neurons (WT n = 30/11 cells/mice; HET n = 31/11; KO n = 14/6). P = 0.042; post hoc: WT versus KO P = 0.0386; WT versus HET P = 0.17584; HET versus KO P = 0.261. f, Representative dendritic tracings from WT, HET, and KO CA1 pyramidal neurons; scale bar, 50 μm. g, Representative Golgi images; scale bar, 2 μm. *P < 0.05. Box (interquartile range), whiskers (5th–95th percentile confidence intervals), line (median) in this and all similar box and whisker plots.
Extended Data Figure 2. Rho GTPase westerns, RhoA inhibitor synaptic transmission data, and model schematic summary.
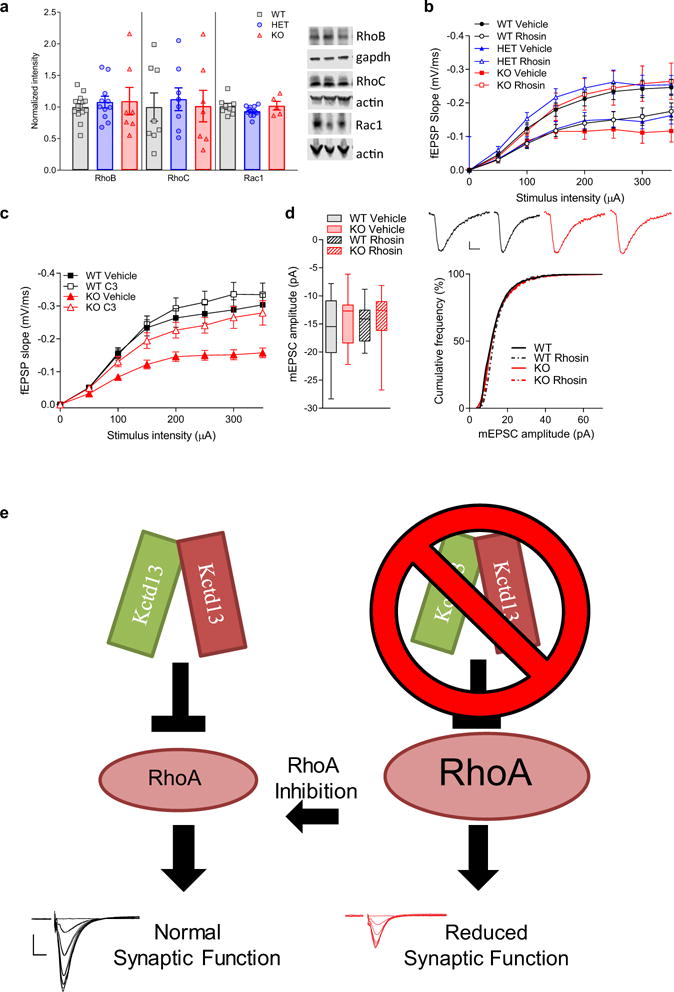
a, Western blots of hippocampal lysates from Kctd13 mutants reveal no change in RhoB, RhoC, or Rac1. b, Combined data from Fig. 2c, d. c, Combined data from Fig. 2e, f. d, Slice incubation (3.5 h) with rhosin had no effect on mEPSC amplitude; P = 0.396 (WT vehicle n = 12/4 cells/mice; KO vehicle n = 17/4; WT rhosin n = 17/4; KO rhosin n = 18/4). Inset: representative mEPSC averaged traces. Scale bar, 2 pA, 5 ms. e, Under normal neuronal conditions, KCTD13 (probably acting with the ubiquitin E3 ligase CUL3, not shown) inhibits RhoA levels and allows for normal synaptic function (left). Heterozygous or homozygous deletion of Kctd13 leads to increased RhoA levels, causing decreased synaptic transmission (right). RhoA inhibition (centre) normalizes RhoA activity to restore synaptic function to normal. Mean ± s.e.m. in a–c. Box (interquartile range), whiskers (5th–95th percentile confidence intervals), line (median) in box and whisker plot in d.
Extended Data Figure 3. Loss of Kctd13 reduces mEPSC frequency in somatosensory cortical layer 2/3 and mIPSC frequency in the hippocampus.
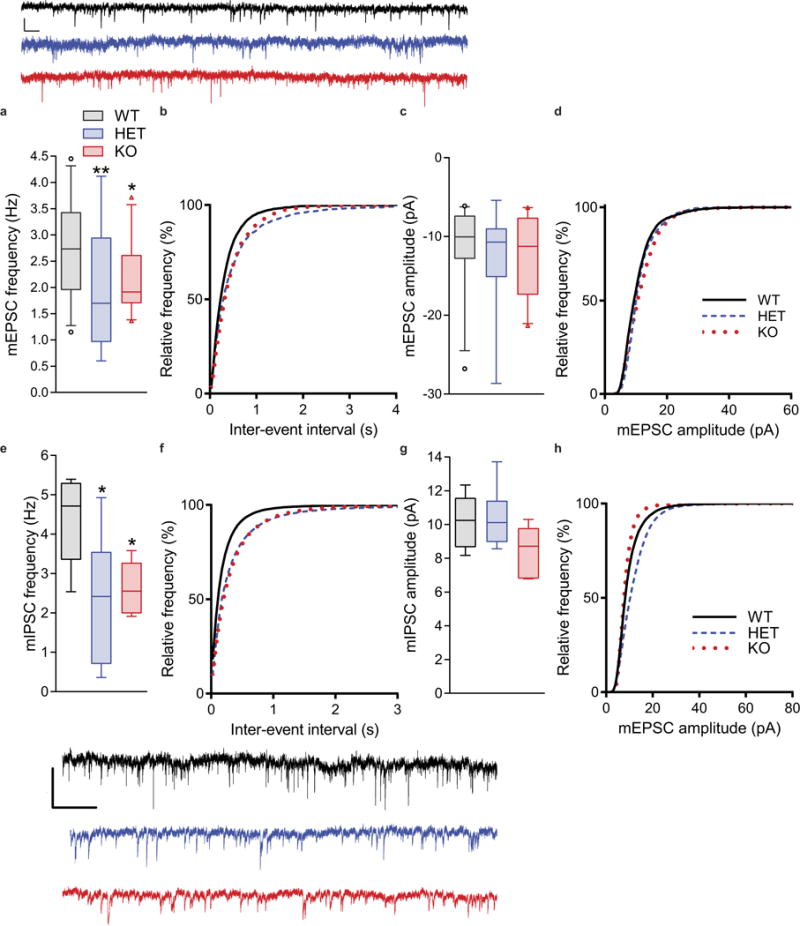
a, b, Mean mEPSC frequency is decreased in somatosensory cortical layer 2/3 neurons from Kctd13 mutants and is represented by the right-shift in cumulative distribution of inter-event frequency; P = 0.0042 (WT n = 20/5 cells/mice; HET n = 20/6; KO n = 24/5). Scale bar, 10 pA, 100 ms. c, d, Mean cortical layer 2/3 neuron mEPSC amplitude and the cumulative distribution of mEPSC amplitudes were not affected by loss of Kctd13; P = 0.397 (WT n = 20/5 cells/mice; HET n = 20/6; KO n = 24/5). Scale bar, 2 pA, 5 ms. e, f, Mean mIPSC frequency is decreased in cortical layer 2/3 neurons from Kctd13 mutants and is represented by the right-shift in cumulative distribution of inter-event frequency; P = 0.041 (WT n = 20/5 cells/mice; HET n = 20/6; KO n = 24/5). Representative traces below. Scale bar, 20 pA, 1.5 s. g, h, Mean CA1 pyramidal neuron mIPSC amplitude and the cumulative distribution of mIPSC amplitudes were not affected by loss of Kctd13; P = 0.145 (WT n = 20/5 cells/mice; HET n = 20/6; KO n = 24/5). Box (interquartile range), whiskers (5th–95th percentile confidence intervals), line (median) in box and whisker plots. *P < 0.05, **P < 0.001.
Extended Data Figure 4. Loss of Kctd13 has no effect on body weight, brain weight, or brain to body weight ratio.
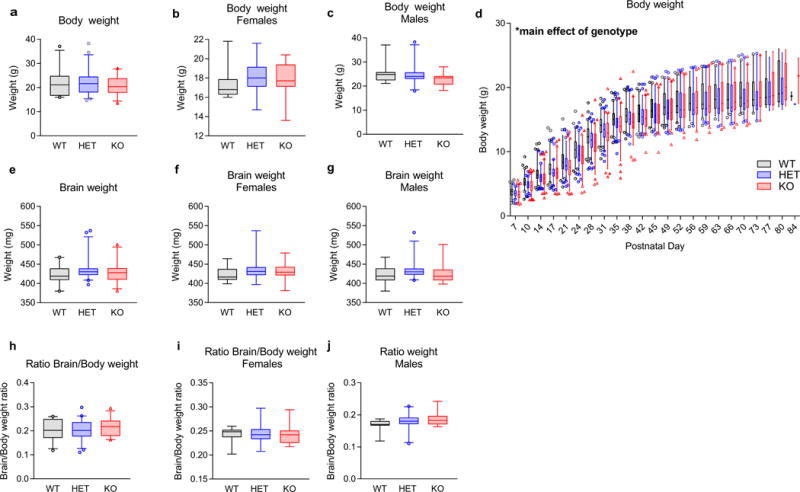
a, Body weight unchanged in 11- to 13-week-olds; P = 0.394 (WT n = 23 (11 male/12 female); HET n = 42 (25 male/17 female); KO n = 25 (14 male/11 female)). b, c, No difference in body weight grouped or divided by sex was observed among 11- to 13-week-old mice; (a) grouped body weight; P = 0.394; (b) female body weight; P = 0.6732; (c) male body weight; P = 0.240. d, Body weight is slightly decreased in Kctd13 mutants; P = 0.008 (WT n = 88 (40 male/48 female); HET n = 86 (28 male/58 female); KO n = 82 (36 male/46 female)). e–g, Brain weight not affected in 11- to 14-week-olds; (e) grouped brain weight, P = 0.112 (WT n = 23 (11 male/12 female); HET n = 42 (25 male/17 female); KO n = 25 (14 male/11 female)); (f) female brain weight, P = 0.328; (g) male brain weight; P = 0.322. h–j, No difference in the ratio of brain to body weight was observed among 11- to 14-week-old mice; (h) grouped ratio of brain to body weight; P = 0.2952; (i) female ratio of brain to body weight; P = 0.998620; (j) male ratio of brain to body weight; P = 0.128485. Same cohort and n values as in e–g above. Box (interquartile range), whiskers (5th–95th percentile confidence intervals), line (median) in box and whisker plots.
Extended Data Figure 5. Summary of regional brain volumes in Kctd13 mutant mice.
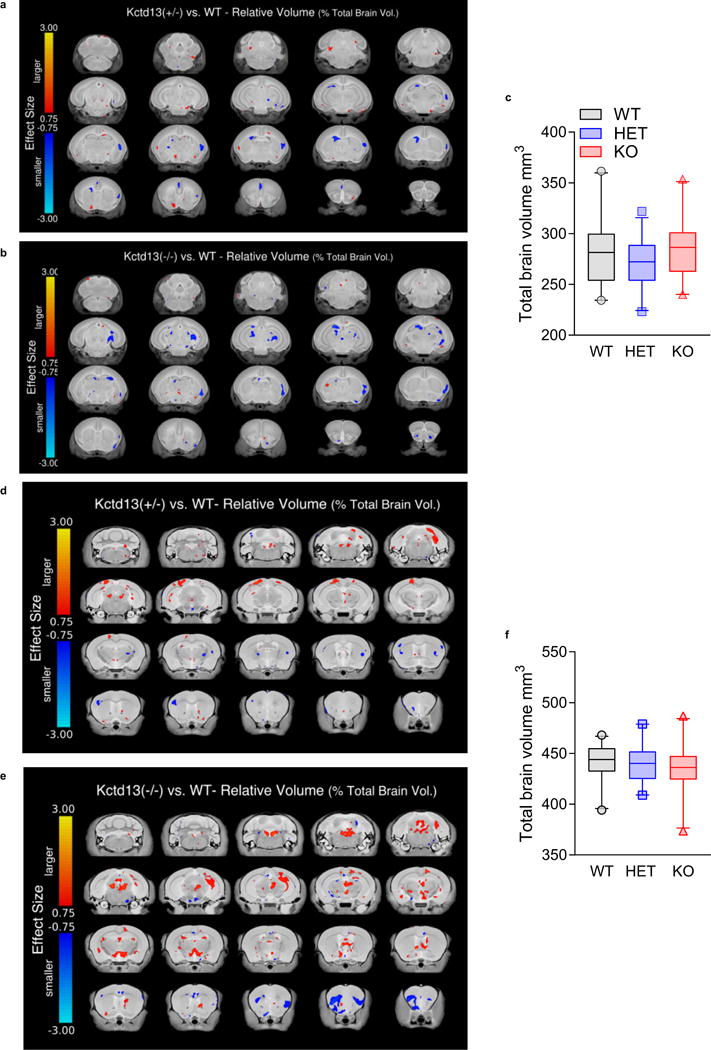
a, P7 Kctd13 HET versus WT mice; 20 different coronal slices of the mouse brain. Highlighted on each slice is the effect size difference in areas that are larger (in orange/yellow) or smaller (in blue/cyan) when comparing relative volume differences between the Kctd13 (+/−, heterozygous) mice and WT. Note this is only highlighting trends as no significant differences were identified (WT n = 23 (11 male/12 female); HET n = 21 (11 male/10 female)). b, P7 Kctd13 KO versus WT mice; 20 different coronal slices of the mouse brain. Highlighted on each slice is the effect size difference in areas that are larger (in orange/yellow) or smaller (in blue/cyan) when comparing relative volume differences between the Kctd13 (−/−, homozygous) mouse and its corresponding WT. Note this is only highlighting trends as no significant differences were found. (WT n = 23 (11 male/12 female); KO n = 21 (11 male/10 female)). c, Total brain volume on MRI is unchanged in 7-week-old Kctd13 mutants; P = 0.225 (WT n = 23 (11 male/12 female); HET n = 21 (11 male/10 female); KO n = 21 (11 male/10 female)). d, Twelve-week-old Kctd13 HET versus WT mice; 20 different coronal slices of the mouse brain. Highlighted on each slice is the effect size difference in areas that are larger (in orange/yellow) or smaller (in blue/cyan) when comparing relative volume differences between the Kctd13 (+/−, heterozygous) mouse and its corresponding WT. Note this is only highlighting trends as no significant differences were found (WT n = 23 (13 male/10 female); HET n = 21 (11 male/10 female)). e, Twelve-week-old Kctd13 KO versus WT mice; 20 different coronal slices of the mouse brain. Highlighted on each slice is the effect size difference in areas that are larger (in orange/yellow) or smaller (in blue/cyan) when comparing relative volume differences between the Kctd13 (−/−, homozygous) mouse and its corresponding WT. Note this is only highlighting trends as no significant differences were found. (WT n = 23 (13 male/10 female); KO n = 23 (13 male/10 female)). f, Total brain volume on MRI is unchanged in 12-week-old Kctd13 mutants; P = 0.462 (WT n = 23 (13 male/10 female); HET n = 21 (11 male/10 female); KO n = 23 (13 male/10 female)). Values represent mean ± s.e.m.
Extended Data Figure 6. Adult and embryonic cell proliferation representative images.
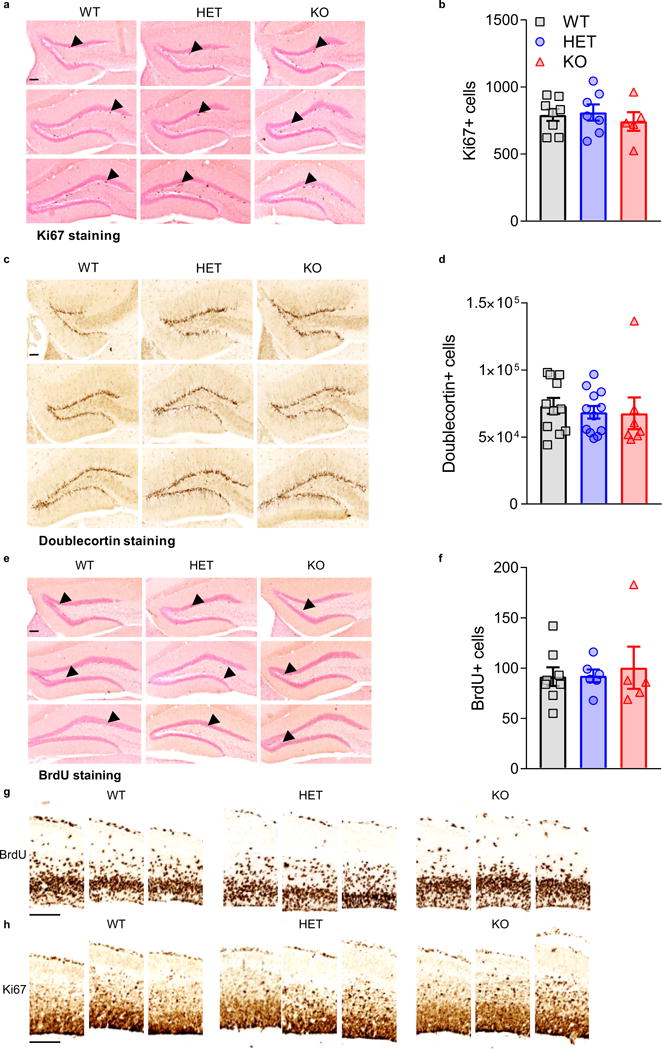
a, Ki67 as a marker of proliferating cells. Representative serial sections from Ki67-stained Kctd13 WT/HET/KO 12-week-old adult tissue with arrowheads indicating examples of positive staining. b, Quantification of no changes in adult dentate gyrus cell proliferation (Ki67) in 12-week-olds; P = 0.737 (WT n = 8; HET n = 7; KO n = 5). c, Doublecortin as a marker of immature neurons. Representative serial sections from doublecortin-stained Kctd13 WT/HET/KO 12-week-old adult tissue. d, Quantification of no changes in adult dentate gyrus immature neurons (doublecortin) in 12-week-olds; P = 0.976 (WT n = 9; HET n = 11; KO n = 7). e, BrdU as a marker of newly born cell survival. Representative serial sections from BrdU-stained Kctd13 WT/HET/KO 12-week-old adult tissue with arrows indicating examples of positive staining. f, Quantification of no change in newborn neuron survival in adults; P = 0.458 (WT n = 8; HET n = 7; KO n = 5). Scale bar, 100 μm. All sections are 300 μm apart and all pictures were taken using a 10× objective lens. g, BrdU as a marker of embryonic stem cell proliferation. Representative serial sections from BrdU-stained Kctd13 WT/HET/KO E15.5 tissue. h, Ki67 as a marker of embryonic stem cell proliferation. Representative serial sections from Ki67 stained Kctd13 WT/HET/KO E15.5 tissue. All sections are 300 μm apart and all pictures were taken using a 10× objective lens. Scale bar, 100 μm. Values represent mean ± s.e.m.
Extended Data Figure 7. Loss of Kctd13 does not affect cortical layer thickness or cell counts in P17 mice.
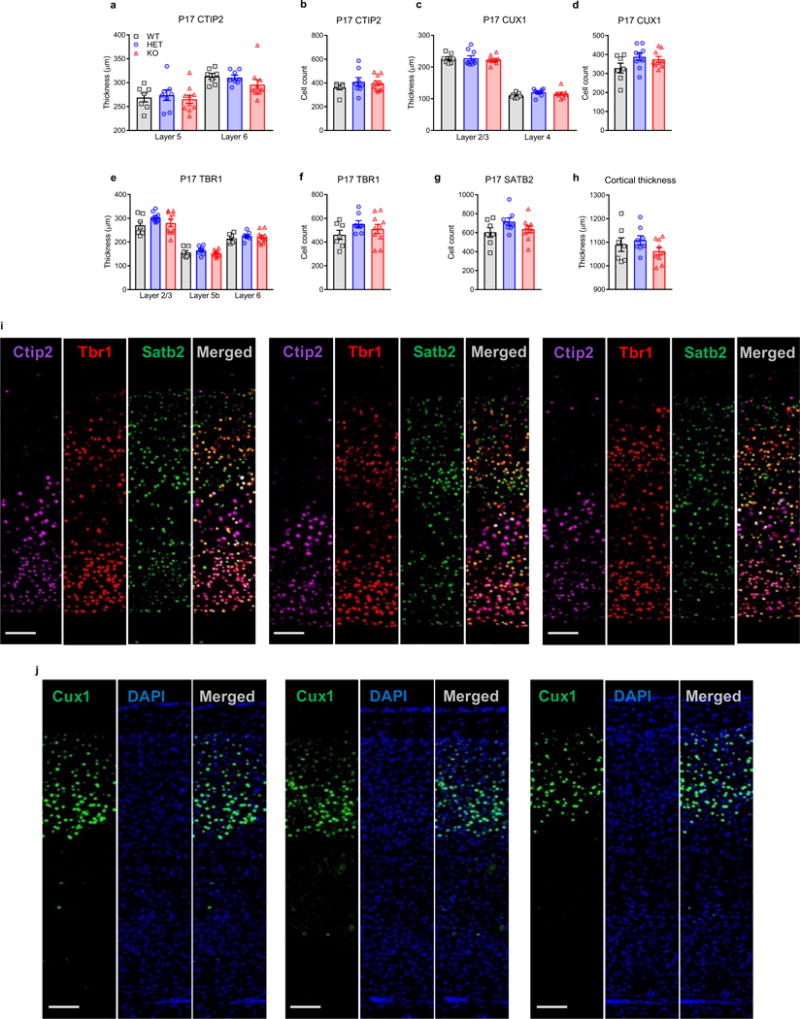
a, b, No differences in Ctip2-stained cortical layer thickness (a) or cell counts (b) were observed in P17 mice; layer 5: P = 0.803 (WT n = 7; HET n = 8; KO n = 10); layer 6: P = 0.272 (WT n = 7; HET n = 8; KO n = 10). Cell count: P = 0.436 (WT n = 7; HET n = 8; KO n = 10). c, d, No differences in Cux1-stained cortical layer thickness (c) or cell counts (d) were observed in P17 mice; layer 2/3: P = 0.844 (WT n = 7; HET n = 9; KO n = 9); layer 4: P = 0.276 (WT n = 7; HET n = 9; KO n = 9). Cell count: P = 0.130 (WT n = 7; HET n = 9; KO n = 9). e, f, No differences in Tbr1-stained cortical layer thickness (e) or cell counts (f) were observed in P17 mice; layer 2/3: P = 0.230 (WT n = 7; HET n = 8; KO n = 10); layer 5: P = 0.353 (WT n = 7; HET n = 8; KO n = 10); layer 6: P = 0.616 (WT n = 7; HET n = 8; KO n = 10). Cell count: P = 0.260 (WT n = 7; HET n = 8; KO n = 10). g, No differences in Satb2-stained cortical layer cell counts were observed in P17 mice; P = 0.192 (WT n = 7; HET n = 8; KO n = 9). h, Total cortical thickness was unchanged among Kctd13 WT and mutant P17 mice; P = 0.284 (WT n = 7; HET n = 8; KO n = 9). i, Representative images of Kctd13 WT, HET, KO cortical Ctip2, Tbr1, and Satb2 triple stains; scale bar, 100 μm. j, Representative images of Kctd13 WT, HET, KO cortical Cux1 and DAPI co-stain; scale bar, 100 μm. Values represent mean ± s.e.m.
Extended Data Figure 8. Loss of Kctd13 does not affect cortical layer thickness or cell counts in E15 embryos.
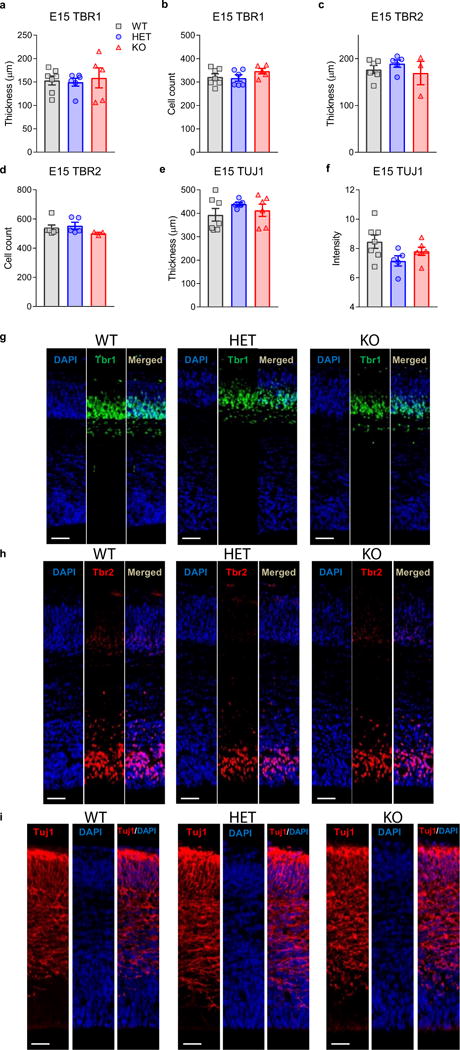
a, b, No differences in Tbr1-stained cortical layer thickness (a) or cell counts (b) were observed in E15 pups; Tbr1 thickness: P = 0.893 (WT n = 7; HET n = 6 ; KO n = 5); cell count: P = 0.304 (WT n = 7; HET n = 6; KO n = 5). c, d, No differences in Tbr2-stained cortical layer thickness (c) or cell counts (d) were observed among Kctd13 WT and mutant E15 pups; TBR2 thickness: P = 0.543 (WT n = 6; HET n = 5; KO n = 3); cell count: P = 0.353 (WT n = 6; HET n = 5; KO n = 3). e, f, No differences in Tuj1-stained cortical layer thickness (e) or the intensity of staining (f) were observed among Kctd13 WT and mutant E15 pups; Tuj1 thickness: P = 0.428 (WT n = 7; HET n = 5; KO n = 6); Tuj1 intensity: P = 0.091 (WT n = 7; HET n = 5; KO n = 6). g, i, Representative images of Kctd13 WT, HET, KO cortical Tbr1, Tbr2, and Tuj1 with DAPI co-stain; scale bar, 50 μm. Values represent mean ± s.e.m.
Extended Data Figure 9. Mammalian RhoA developmental profile reveals delay in RhoA increase; homozygous deletion of Kctd13 in zebrafish results in increased RhoA.
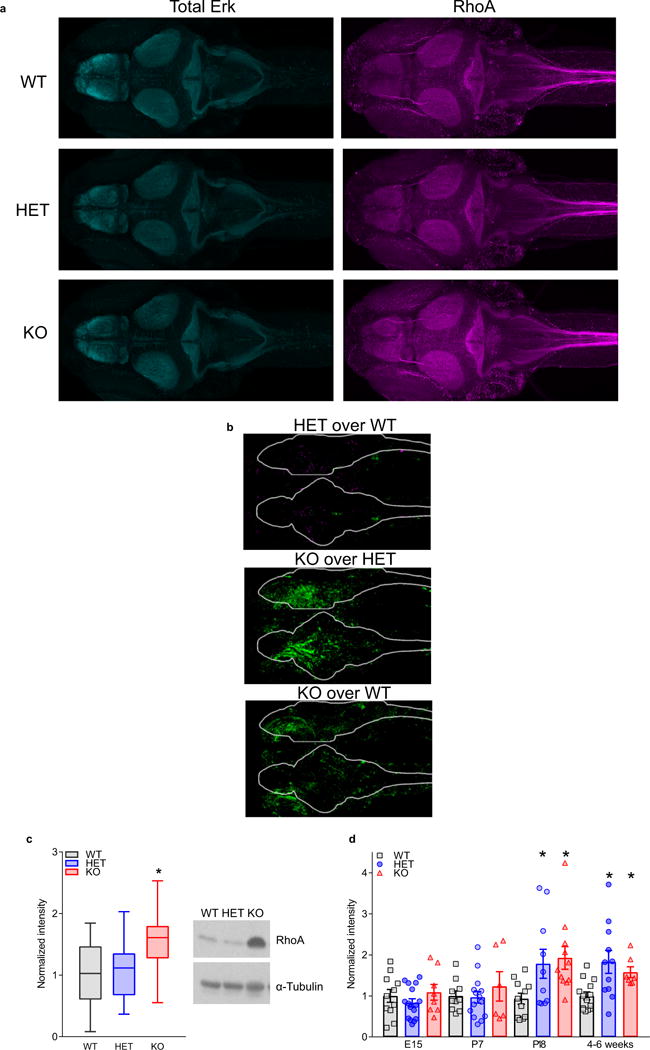
a, Example maximum intensity projections of zebrafish larval (6 days after fertilization) brain immunofluorescence showing total Erk control protein (cyan, left) and RhoA protein (magenta, right). Images were registered to the Z-Brain total Erk-stained reference brain51, using CMTK registration51,63. b, Maximum intensity z and x projections of RhoA immunofluorescence differences among KO, HET, and WT genotypes (WT n = 9; HET n = 7; KO n = 11), quantified using the approach described previously51. RhoA levels were normalized to total Erk levels and the significance threshold for the false discovery rate was set to 0.0005%. Green represents increased RhoA in the first genotype compared with the second, whereas magenta represents decreased RhoA. The approach of registration and morphing antibody-stained images to find statistically significant differences in intensity will only yield approximations of the changes across brain regions, particularly when low numbers of fish (<20) are compared51. c, Western blots of whole-brain lysates from Kctd13 adult (2–12 months) zebrafish mutants reveal increased total RhoA protein; P = 0.0389 (WT n = 12; HET n = 12; KO n = 12). d, Western blots of prefrontal cortex or hippocampal whole-cell lysates from Kctd13 mutant mice reveal increased RhoA protein at P18 and 4–6 weeks with no change in RhoA levels at E15 or P7; E15 P = 0.410 (WT n = 11; HET n = 16; KO n = 8); P7 P = 0.622 (WT n = 10; HET n = 14; KO n = 6); P18 P = 0.0243 (WT n = 11; HET n = 10; KO n = 11); 4–6 weeks P = 0.0069 (WT n = 14; HET n = 11; KO n = 7). Box (interquartile range), whiskers (5th–95th percentile confidence intervals), line (median) in box and whisker plots in c. Values represent mean ± s.e.m. in d.
Extended Data Figure 10. Behavioural analysis of Kctd13 mutant mice.
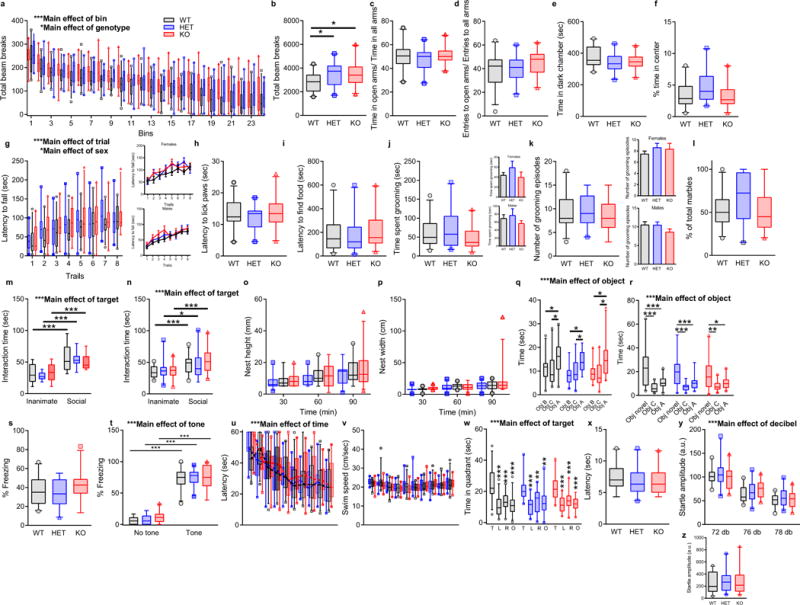
a, Locomotor activity as measured by the number of photobeam breaks during successive 5-min intervals over a 2 h period. Kctd13 KO mice show significantly increased locomotor activity over the full 2 h period; P = 0.012. b, Locomotor activity is expressed as the sum of total photobeam breaks during a 2 h session. Both Kctd13 HETs and KOs show significantly increased numbers of photobeam breaks; P = 0.012. c, d, Ratio of time (c) and entries (d) in the open arms versus time and entries in other arms in the elevated plus maze. No difference in time; P = 0.340 or entries to the open arms; P = 0.605 among the groups was observed. e, Time spent in dark side during the dark/light test. All the groups spent equal time in the dark chamber; P = 0.122. f, Time spent in the centre of the open field arena. No difference among the groups was observed; P = 0.606. g, Latency to fall in the rotarod task. No difference was found among the genotypes; P = 0.232. A main effect of sex was observed; P = 0.0001. The inserts show latency to fall separated by sex. h, Latency to lick the paw during the hotplate test. No difference in the latency was observed among the genotypes; P = 0.430. i, Latency to find food buried under the bedding. No difference in the time spent finding the food was detected among the genotypes; P = 0.145. j, k, Time spent grooming (j) and number of grooming episodes (k) during the 15 min grooming test. No difference was found among the genotypes; time P = 0.191; bouts P = 0.521. A main effect of sex was observed; time (j) P = 0.036; bouts (k) P = 0.027. The inserts show grooming test results in a sex-specific manner. l, Number of marbles buried during the 30 min marble-burying task. No difference was observed among genotypes; P = 0.105. m, Three-chamber sociability test results depicted as interaction time with inanimate object (an empty wire cup) versus social target (a mouse placed under the wire cup). No difference in interaction either with an inanimate object or with a target mouse was found among genotypes; P = 0.853. n, Sequential caged conspecific social interaction test results depicted as interaction time with an inanimate object (an empty plastic cage) alone and with a social (a plastic cage with a novel mouse) target alone; P = 0.494. No difference in interaction either with an inanimate object or with a target mouse was found among the genotypes, although a main effect of sex was observed; P = 0.005. The inserts show test results in a sex-specific manner. o, p, Height (o) and width (p) of nest built as a function of time in a nest-building task. No difference was observed among the genotypes; height P = 0.207; width P = 0.411. q, Time spent interacting with an object placed in a new location (Obj A) during the first, spatial trial of the novel object test. All groups interacted comparably with the familiar location objects (Obj C and Obj B) and showed similar preference for the object moved to a new location; P = 0.241. In addition, a main effect of sex was observed. The inserts show time spent interacting with objects in a sex-specific manner; P = 0.025. r, Time spent interacting with a novel object (Obj B was replaced by Obj novel) during the second trial of the novel object test. All groups interacted comparably with the familiar object (Obj C) and showed similar preference for the novel object; P = 0.414. s, Percentage of time spent freezing during the contextual fear-conditioning test. All genotypes showed equal freezing behaviour when exposed to the training context; P = 0.227. t, Percentage of time freezing during the cued fear-conditioning test. All genotypes showed the same freezing behaviour when exposed to the tone used during training; P = 0.490. u, Latency to reach a hidden platform on successive training days in the Morris water maze test. All genotypes reached the platform within the same time; P = 0.715. v, Swim speed on successive water maze training days. No change in speed among the groups was observed; P = 0.758. w, Time spent in the target and other quadrants during the probe trial in which the target platform was removed. All genotypes showed similar preference for the target quadrant versus other quadrants; P = 1.000. x, Latency to reach a visible platform in the visible platform portion of the water maze. All genotypes reached the visible platform within similar times; P = 0.391. y, Startle response after a pre-pulse at 72, 76, 80, and 84 dB, followed by a pulse at 120 dB. All genotypes show similar startle reflex during the test; P = 0.451. z, Initial startle amplitude in response to 120 db. No difference in response among the genotypes was observed; P = 0.617. *P < 0.05, **P < 0.01, ***P < 0.001. Animal numbers ranged as follows: WT n = 24–26; HET n = 19–22; KO n = 20–22. Box (interquartile range), whiskers (5th–95th percentile confidence intervals), line (median) all similar box and whisker plots. Inset values represent mean ± s.e.m. (See Supplementary Table 1 for animal numbers and detailed statistics.)
Supplementary Material
Acknowledgments
This research was supported by National Institutes of Health (NIH) R01HD069560 and R01HD069560-S1, Autism Speaks, The Hartwell Foundation, Ed and Sue Rose Distinguished Professorship in Neurology, gifts from C. Heighten, D. Caudy and BRAINS for Autism (to C.M.P.), Autism Science Foundation (to C.M.P. and C.O.E.), Canadian Institute for Health Research and Ontario Brain Institute (to J.P.L.), NIH 2K02DA023555 and NASA NNX15AE09G (to A.J.E.), Uehara Foundation (to N.U.), NIH MH102603 (to G.K.), NIH K99MH110603 (to S.B.T.), Damon Runyon Cancer Research Foundation (to S.B.T.), Harvard Brain Institute Bipolar Seed Grant (to A.F.S.), and NIH R01HL109525 (to A.F.S). We thank K. R. Tolias for RhoA KO mouse brain and the University of Texas Southwestern Whole Brain Microscopy Facility WBMF) for assistance with X-gal histology and slide scanning. The WBMF is supported by the Texas Institute for Brain Injury and Repair. Embryonic stem cells were generated by the trans-NIH Knockout Mouse Project (KOMP) from the KOMP Repository (www.komp.org). NIH grants to Velocigene at Regeneron (U01HG004085) and the CSD Consortium (U01HG004080) funded generation of gene-targeted embryonic stem cells for 8,500 genes (KOMP), archived and distributed by the KOMP Repository at the University of California, Davis, and CHORI (U42RR024244).
Footnotes
Online Content: Methods, along with any additional Extended Data display Items and Source Data, are available in the online version of the paper; references unique to these sections appear only in the online paper.
Supplementary Information is available in the online version of the paper.
Author Contributions: C.O.E., I.F., S.B.T., J.E. and C.M.P. designed the study and wrote the paper. All authors edited and approved the manuscript. Z.X.X. generated, confirmed, and genotyped mice with aid from S.L. C.O.E. performed/analysed data for field and whole-cell electrophysiology, biochemistry, and field electrophysiology with rhosin and C3. F.E. performed/analysed MK-801 whole-cell electrophysiology. H.E.S. performed whole-cell electrophysiology with rhosin, miniature inhibitory postsynaptic currents (mIPSCs), and cortical mEPSCs. C.O.E. analysed the data. I.A.L. contributed to biochemistry. I.F. performed biochemistry, immunohistochemistry, and neurogenesis with supervision by A.J.E. I.F. and A.K.W. performed embryonic neurogenesis and A.K.W. analysed the data with consultation by A.J.E. N.U. performed IUE supervised by G.K., I.F. sectioned and stained tissue, and A.K.W. analysed data. I.F. performed cortical layer staining, and R.H. and D.B.M. analysed data. S.B.T. performed zebrafish studies with supervision by A.F.S. J.E. performed and analysed mouse MRI experiments supervised by J.P.L.
The authors declare competing financial interests: details are available in the online version of the paper. Readers are welcome to comment on the online version of the paper.
Publisher’s note: Springer Nature remains neutral with regard to jurisdictional claims in published maps and institutional affiliations.
References
- 1.Kumar RA, et al. Recurrent 16p11.2 microdeletions in autism. Hum Mol Genet. 2008;17:628–638. doi: 10.1093/hmg/ddm376. [DOI] [PubMed] [Google Scholar]
- 2.Weiss LA, et al. Association between microdeletion and microduplication at 16p11.2 and autism. N Engl J Med. 2008;358:667–675. doi: 10.1056/NEJMoa075974. [DOI] [PubMed] [Google Scholar]
- 3.McCarthy SE, et al. Microduplications of 16p11.2 are associated with schizophrenia. Nat Genet. 2009;41:1223–1227. doi: 10.1038/ng.474. [DOI] [PMC free article] [PubMed] [Google Scholar]
- 4.Shinawi M, et al. Recurrent reciprocal 16p11.2 rearrangements associated with global developmental delay, behavioural problems, dysmorphism, epilepsy, and abnormal head size. J Med Genet. 2010;47:332–341. doi: 10.1136/jmg.2009.073015. [DOI] [PMC free article] [PubMed] [Google Scholar]
- 5.Zufferey F, et al. A 600 kb deletion syndrome at 16p11.2 leads to energy imbalance and neuropsychiatric disorders. J Med Genet. 2012;49:660–668. doi: 10.1136/jmedgenet-2012-101203. [DOI] [PMC free article] [PubMed] [Google Scholar]
- 6.Steinberg S, et al. Common variant at 16p11.2 conferring risk of psychosis. Mol Psychiatry. 2014;19:108–114. doi: 10.1038/mp.2012.157. [DOI] [PMC free article] [PubMed] [Google Scholar]
- 7.Marshall CR, et al. Structural variation of chromosomes in autism spectrum disorder. Am J Hum Genet. 2008;82:477–488. doi: 10.1016/j.ajhg.2007.12.009. [DOI] [PMC free article] [PubMed] [Google Scholar]
- 8.Golzio C, et al. KCTD13 is a major driver of mirrored neuroanatomical phenotypes of the 16p11.2 copy number variant. Nature. 2012;485:363–367. doi: 10.1038/nature11091. [DOI] [PMC free article] [PubMed] [Google Scholar]
- 9.Lin GN, et al. Spatiotemporal 16p11.2 protein network implicates cortical late mid-fetal brain development and KCTD13-Cul3-RhoA pathway in psychiatric diseases. Neuron. 2015;85:742–754. doi: 10.1016/j.neuron.2015.01.010. [DOI] [PMC free article] [PubMed] [Google Scholar]
- 10.Kumar RA, et al. Association and mutation analyses of 16p11.2 autism candidate genes. PLoS ONE. 2009;4:e4582. doi: 10.1371/journal.pone.0004582. [DOI] [PMC free article] [PubMed] [Google Scholar]
- 11.Geschwind DH, State MW. Gene hunting in autism spectrum disorder: on the path to precision medicine. Lancet Neurol. 2015;14:1109–1120. doi: 10.1016/S1474-4422(15)00044-7. [DOI] [PMC free article] [PubMed] [Google Scholar]
- 12.Iossifov I, et al. The contribution of de novo coding mutations to autism spectrum disorder. Nature. 2014;515:216–221. doi: 10.1038/nature13908. [DOI] [PMC free article] [PubMed] [Google Scholar]
- 13.Crepel A, et al. Narrowing the critical deletion region for autism spectrum disorders on 16p11.2. Am J Med Genet B. 2011;156:243–245. doi: 10.1002/ajmg.b.31163. [DOI] [PubMed] [Google Scholar]
- 14.Zollman S, Godt D, Privé GG, Couderc JL, Laski FA. The BTB domain, found primarily in zinc finger proteins, defines an evolutionary conserved family that includes several developmentally regulated genes in Drosophila. Proc Natl Acad Sci USA. 1994;91:10717–10721. doi: 10.1073/pnas.91.22.10717. [DOI] [PMC free article] [PubMed] [Google Scholar]
- 15.Chen Y, et al. Cullin mediates degradation of RhoA through evolutionarily conserved BTB adaptors to control actin cytoskeleton structure and cell movement. Mol Cell. 2009;35:841–855. doi: 10.1016/j.molcel.2009.09.004. [DOI] [PubMed] [Google Scholar]
- 16.De Rubeis S, et al. Synaptic, transcriptional and chromatin genes disrupted in autism. Nature. 2014;515:209–215. doi: 10.1038/nature13772. [DOI] [PMC free article] [PubMed] [Google Scholar]
- 17.Ahnert-Hilger G, et al. Differential effects of Rho GTPases on axonal and dendritic development in hippocampal neurones. J Neurochem. 2004;90:9–18. doi: 10.1111/j.1471-4159.2004.02475.x. [DOI] [PubMed] [Google Scholar]
- 18.Van Aelst L, Cline HT. Rho GTPases and activity-dependent dendrite development. Curr Opin Neurobiol. 2004;14:297–304. doi: 10.1016/j.conb.2004.05.012. [DOI] [PubMed] [Google Scholar]
- 19.Govek EE, et al. The X-linked mental retardation protein oligophrenin-1 is required for dendritic spine morphogenesis. Nat Neurosci. 2004;7:364–372. doi: 10.1038/nn1210. [DOI] [PubMed] [Google Scholar]
- 20.Tashiro A, Minden A, Yuste R. Regulation of dendritic spine morphology by the rho family of small GTPases: antagonistic roles of Rac and Rho. Cereb Cortex. 2000;10:927–938. doi: 10.1093/cercor/10.10.927. [DOI] [PubMed] [Google Scholar]
- 21.Nakayama AY, Harms MB, Luo L. Small GTPases Rac and Rho in the maintenance of dendritic spines and branches in hippocampal pyramidal neurons. J Neurosci. 2000;20:5329–5338. doi: 10.1523/JNEUROSCI.20-14-05329.2000. [DOI] [PMC free article] [PubMed] [Google Scholar]
- 22.Lee T, Winter C, Marticke SS, Lee A, Luo L. Essential roles of Drosophila RhoA in the regulation of neuroblast proliferation and dendritic but not axonal morphogenesis. Neuron. 2000;25:307–316. doi: 10.1016/s0896-6273(00)80896-x. [DOI] [PubMed] [Google Scholar]
- 23.Li Z, Van Aelst L, Cline H. T Rho GTPases regulate distinct aspects of dendritic arbor growth in Xenopus central neurons in vivo. Nat Neurosci. 2000;3:217–225. doi: 10.1038/72920. [DOI] [PubMed] [Google Scholar]
- 24.Lein ES, et al. Genome-wide atlas of gene expression in the adult mouse brain. Nature. 2007;445:168–176. doi: 10.1038/nature05453. [DOI] [PubMed] [Google Scholar]
- 25.Hessler NA, Shirke AM, Malinow R. The probability of transmitter release at a mammalian central synapse. Nature. 1993;366:569–572. doi: 10.1038/366569a0. [DOI] [PubMed] [Google Scholar]
- 26.Shang X, et al. Rational design of small molecule inhibitors targeting RhoA subfamily Rho GTPases. Chem Biol. 2012;19:699–710. doi: 10.1016/j.chembiol.2012.05.009. [DOI] [PMC free article] [PubMed] [Google Scholar]
- 27.Shang X, et al. Small-molecule inhibitors targeting G-protein-coupled Rho guanine nucleotide exchange factors. Proc Natl Acad Sci USA. 2013;110:3155–3160. doi: 10.1073/pnas.1212324110. [DOI] [PMC free article] [PubMed] [Google Scholar]
- 28.Aktories K, Wilde C, Vogelsgesang M. Rho-modifying C3-like ADP-ribosyltransferases. Rev Physiol Biochem Pharmacol. 2004;152:1–22. doi: 10.1007/s10254-004-0034-4. [DOI] [PubMed] [Google Scholar]
- 29.Pelham CJ, et al. Cullin-3 regulates vascular smooth muscle function and arterial blood pressure via PPARγ and RhoA/Rho-kinase. Cell Metab. 2012;16:462–472. doi: 10.1016/j.cmet.2012.08.011. [DOI] [PMC free article] [PubMed] [Google Scholar]
- 30.Gladwyn-Ng I, et al. Bacurd1/Kctd13 and Bacurd2/Tnfaip1 are interacting partners to Rnd proteins which influence the long-term positioning and dendritic maturation of cerebral cortical neurons. Neural Dev. 2016;11:7. doi: 10.1186/s13064-016-0062-1. [DOI] [PMC free article] [PubMed] [Google Scholar]
- 31.Spring S, Lerch JP, Henkelman RM. Sexual dimorphism revealed in the structure of the mouse brain using three-dimensional magnetic resonance imaging. Neuroimage. 2007;35:1424–1433. doi: 10.1016/j.neuroimage.2007.02.023. [DOI] [PubMed] [Google Scholar]
- 32.de Guzman AE, Wong MD, Gleave JA, Nieman BJ. Variations in post-perfusion immersion fixation and storage alter MRI measurements of mouse brain morphometry. Neuroimage. 2016;142:687–695. doi: 10.1016/j.neuroimage.2016.06.028. [DOI] [PubMed] [Google Scholar]
- 33.Bock NA, Nieman BJ, Bishop JB, Mark Henkelman R. In vivo multiple-mouse MRI at 7 Tesla. Magn Reson Med. 2005;54:1311–1316. doi: 10.1002/mrm.20683. [DOI] [PubMed] [Google Scholar]
- 34.Lerch JP, Sled JG, Henkelman RM. MRI phenotyping of genetically altered mice. Methods Mol Biol. 2011;711:349–361. doi: 10.1007/978-1-61737-992-5_17. [DOI] [PubMed] [Google Scholar]
- 35.Noakes TLS, Henkelman RM, Nieman BJ. Partitioning k-space for cylindrical three-dimensional rapid acquisition with relaxation enhancement imaging in the mouse brain. NMR Biomed. 2017;30:1099–1492. doi: 10.1002/nbm.3802. [DOI] [PubMed] [Google Scholar]
- 36.Nieman BJ, Flenniken AM, Adamson SL, Henkelman RM, Sled JG. Anatomical phenotyping in the brain and skull of a mutant mouse by magnetic resonance imaging and computed tomography. Physiol Genomics. 2006;24:154–162. doi: 10.1152/physiolgenomics.00217.2005. [DOI] [PubMed] [Google Scholar]
- 37.Lerch JP, et al. Automated deformation analysis in the YAC128 Huntington disease mouse model. Neuroimage. 2008;39:32–39. doi: 10.1016/j.neuroimage.2007.08.033. [DOI] [PubMed] [Google Scholar]
- 38.Dorr AE, Lerch JP, Spring S, Kabani N, Henkelman RM. High resolution three-dimensional brain atlas using an average magnetic resonance image of 40 adult C57Bl/6J mice. Neuroimage. 2008;42:60–69. doi: 10.1016/j.neuroimage.2008.03.037. [DOI] [PubMed] [Google Scholar]
- 39.Ullmann JF, Watson C, Janke AL, Kurniawan ND, Reutens DC. A segmentation protocol and MRI atlas of the C57BL/6J mouse neocortex. Neuroimage. 2013;78:196–203. doi: 10.1016/j.neuroimage.2013.04.008. [DOI] [PubMed] [Google Scholar]
- 40.Steadman PE, et al. Genetic effects on cerebellar structure across mouse models of autism using a magnetic resonance imaging atlas. Autism Res. 2014;7:124–137. doi: 10.1002/aur.1344. [DOI] [PMC free article] [PubMed] [Google Scholar]
- 41.Genovese CR, Lazar NA, Nichols T. Thresholding of statistical maps in functional neuroimaging using the false discovery rate. Neuroimage. 2002;15:870–878. doi: 10.1006/nimg.2001.1037. [DOI] [PubMed] [Google Scholar]
- 42.Saito T. In vivo electroporation in the embryonic mouse central nervous system. Nat Protocols. 2006;1:1552–1558. doi: 10.1038/nprot.2006.276. [DOI] [PubMed] [Google Scholar]
- 43.Nishiyama J, et al. Selective and regulated gene expression in murine Purkinje cells by in utero electroporation. Eur J Neurosci. 2012;36:2867–2876. doi: 10.1111/j.1460-9568.2012.08203.x. [DOI] [PubMed] [Google Scholar]
- 44.dal Maschio M, et al. High-performance and site-directed in utero electroporation by a triple-electrode probe. Nat Commun. 2012;3:960. doi: 10.1038/ncomms1961. [DOI] [PMC free article] [PubMed] [Google Scholar]
- 45.Franco SJ, et al. Fate-restricted neural progenitors in the mammalian cerebral cortex. Science. 2012;337:746–749. doi: 10.1126/science.1223616. [DOI] [PMC free article] [PubMed] [Google Scholar]
- 46.Sia GM, Clem RL, Huganir RL. The human language-associated gene SRPX2 regulates synapse formation and vocalization in mice. Science. 2013;342:987–991. doi: 10.1126/science.1245079. [DOI] [PMC free article] [PubMed] [Google Scholar]
- 47.Molyneaux BJ, Arlotta P, Menezes JR, Macklis JD. Neuronal subtype specification in the cerebral cortex. Nat Rev Neurosci. 2007;8:427–437. doi: 10.1038/nrn2151. [DOI] [PubMed] [Google Scholar]
- 48.West MJ, Ostergaard K, Andreassen OA, Finsen B. Estimation of the number of somatostatin neurons in the striatum: an in situ hybridization study using the optical fractionator method. J Comp Neurol. 1996;370:11–22. doi: 10.1002/(SICI)1096-9861(19960617)370:1<11::AID-CNE2>3.0.CO;2-O. [DOI] [PubMed] [Google Scholar]
- 49.Gagnon JA, et al. Efficient mutagenesis by Cas9 protein-mediated oligonucleotide insertion and large-scale assessment of single-guide RNAs. PLoS ONE. 2014;9:e98186. doi: 10.1371/journal.pone.0098186. [DOI] [PMC free article] [PubMed] [Google Scholar]
- 50.Lister JA, Robertson CP, Lepage T, Johnson SL, Raible DW. nacre encodes a zebrafish microphthalmia-related protein that regulates neural-crest-derived pigment cell fate. Development. 1999;126:3757–3767. doi: 10.1242/dev.126.17.3757. [DOI] [PubMed] [Google Scholar]
- 51.Randlett O, et al. Whole-brain activity mapping onto a zebrafish brain atlas. Nat Methods. 2015;12:1039–1046. doi: 10.1038/nmeth.3581. [DOI] [PMC free article] [PubMed] [Google Scholar]
- 52.Truett GE, et al. Preparation of PCR-quality mouse genomic DNA with hot sodium hydroxide and tris (HotSHOT) Biotechniques. 2000;29:52, 54. doi: 10.2144/00291bm09. [DOI] [PubMed] [Google Scholar]
- 53.Save E, Poucet B, Foreman N, Buhot MC. Object exploration and reactions to spatial and nonspatial changes in hooded rats following damage to parietal cortex or hippocampal formation. Behav Neurosci. 1992;106:447–456. [PubMed] [Google Scholar]
- 54.Moy SS, et al. Sociability and preference for social novelty in five inbred strains: an approach to assess autistic-like behavior in mice. Genes Brain Behav. 2004;3:287–302. doi: 10.1111/j.1601-1848.2004.00076.x. [DOI] [PubMed] [Google Scholar]
- 55.Nadler JJ, et al. Automated apparatus for quantitation of social approach behaviors in mice. Genes Brain Behav. 2004;3:303–314. doi: 10.1111/j.1601-183X.2004.00071.x. [DOI] [PubMed] [Google Scholar]
- 56.Powell CM, et al. The presynaptic active zone protein RIM1α is critical for normal learning and memory. Neuron. 2004;42:143–153. doi: 10.1016/s0896-6273(04)00146-1. [DOI] [PMC free article] [PubMed] [Google Scholar]
- 57.Lee I, Hunsaker MR, Kesner RP. The role of hippocampal subregions in detecting spatial novelty. Behav Neurosci. 2005;119:145–153. doi: 10.1037/0735-7044.119.1.145. [DOI] [PubMed] [Google Scholar]
- 58.Tabuchi K, et al. A neuroligin-3 mutation implicated in autism increases inhibitory synaptic transmission in mice. Science. 2007;318:71–76. doi: 10.1126/science.1146221. [DOI] [PMC free article] [PubMed] [Google Scholar]
- 59.Blundell J, et al. Increased anxiety-like behavior in mice lacking the inhibitory synapse cell adhesion molecule neuroligin 2. Genes Brain Behav. 2009;8:114–126. doi: 10.1111/j.1601-183X.2008.00455.x. [DOI] [PMC free article] [PubMed] [Google Scholar]
- 60.Etherton MR, Blaiss CA, Powell CM, Südhof TC. Mouse neurexin-1α deletion causes correlated electrophysiological and behavioral changes consistent with cognitive impairments. Proc Natl Acad Sci USA. 2009;106:17998–18003. doi: 10.1073/pnas.0910297106. [DOI] [PMC free article] [PubMed] [Google Scholar]
- 61.Blundell J, et al. Neuroligin-1 deletion results in impaired spatial memory and increased repetitive behavior. J Neurosci. 2010;30:2115–2129. doi: 10.1523/JNEUROSCI.4517-09.2010. [DOI] [PMC free article] [PubMed] [Google Scholar]
- 62.Blundell J, Kaeser PS, Südhof TC, Powell CM. RIM1α and interacting proteins involved in presynaptic plasticity mediate prepulse inhibition and additional behaviors linked to schizophrenia. J Neurosci. 2010;30:5326–5333. doi: 10.1523/JNEUROSCI.0328-10.2010. [DOI] [PMC free article] [PubMed] [Google Scholar]
- 63.Rohlfing T, Maurer CR., Jr Nonrigid image registration in shared-memory multiprocessor environments with application to brains, breasts, and bees. IEEE Trans Inf Technol Biomed. 2003;7:16–25. doi: 10.1109/titb.2003.808506. [DOI] [PubMed] [Google Scholar]
Associated Data
This section collects any data citations, data availability statements, or supplementary materials included in this article.
Supplementary Materials
Data Availability Statement
The datasets generated or analysed during the current study that support its findings are available from the corresponding author upon reasonable request.