

Abstract
Objective
Caesarean section (C-section) is associated with various immune-mediated diseases in the offspring. We investigated the relationship between mode of delivery and celiac disease (CD) and CD autoimmunity (CDA) in a multinational birth cohort.
Methods
From 2004 to 2010 infants from the general population who tested positive for HLA DR3-DQ2 or DR4-DQ8 were enrolled in The Environmental Determinants for Diabetes in the Young (TEDDY) study. Children were annually screened for transglutaminase autoantibodies, if positive re-tested after 3–6 months and those persistently positive defined as CDA. Associations of C-section with maternal (age, education level, parity, pre-pregnancy weight, diabetes, smoking, weight gain during pregnancy) and child characteristics (gestational age, birth weight) were examined by Fisher’s exact test or Wilcoxon rank-sum test. Hazard ratios (HRs) for CDA or CD were calculated by Cox proportional hazard regression models.
Results
Of 6,087 analyzed singletons 1600 (26%) were born by C-section (Germany 38%, US 37%, Finland 18%, Sweden 16%), the remaining vaginally without instrumental support; 979 (16%) had developed CDA and 343 (6%) CD. C-section was associated with lower risk for CDA (HR=0.85, [95% CI 0.73, 0.99], p=0.032) and CD (HR=0.75, [95% CI 0.58, 0.98], p=0.034). After adjusting for country, sex, HLA-genotype, CD in family, maternal education and breastfeeding duration, significance was lost for CDA (HR= 0.91, [95% CI 0.78, 1.06], p=0.20) and CD (HR=0.85, [95% CI 0.65, 1.11], p=0.24). Pre-surgical ruptured membranes had no influence on CDA or CD development.
Conclusion
C-section is not associated with increased risk for CDA or CD in the offspring.
Keywords: Mode of delivery, vaginal delivery, celiac disease autoimmunity, tissue transglutaminase, screening
INTRODUCTION
The increasing rates of caesarean section (C-section) worldwide have provoked considerable public health interest for the short and long-term effects in infants and children1. Reported short-term negative health effects during the neonatal period include impaired lung function, hypoglycaemia, reduced breast feeding initiation, and altered innate and adaptive immune responses1. Reported long-term effects include an increased risk of immune-mediated conditions such as asthma and other allergic diseases, systemic connective tissue disorders, juvenile arthritis, and type 1 diabetes (T1D)2–4. Results from animal models suggest that the microbiota plays a pivotal role in shaping the innate and adaptive immune response, and is also important in human health and disease5. Mode of delivery is crucial for the acquisition of the microbiota after birth6. Infants born naturally or by C-section after rupture of the membranes are exposed to the maternal vaginal flora during birth, while infants born by planned C-section are not. Other factors such as perinatal antibiotic use by the mother or the child, or the type of feeding (breastfeeding, formula feeding and solid food introduction) will further influence the composition of the microbiome.
Celiac disease (CD) is an immune-mediated systemic autoimmune disease elicited by gluten in genetically susceptible individuals carrying the HLA-DQ2 and/or DQ8 haplotypes. It is characterized by the presence of circulating tissue transglutaminase autoantibodies (tTGA) and an inflammatory enteropathy with villous atrophy7. CD affects about 1–2% of the population in Europe and North-America with increasing incidence over the past two decades8. Although positivity for HLA-DQ2, DQ8 or both haplotypes is a prerequisite for disease, only a minority of individuals at genetic risk is affected in spite of the fact that gluten containing foods are globally consumed. In addition, the overall contribution of known genes to the risk of CD account for less than half of all heritability9. This strongly indicates that other environmental factors are contributing to the increase in prevalence of CD in the general population8;10.
It has been hypothesized that infants born by C-section acquire different bacterial communities compared to vaginally delivered infants6, which may influence the short and long-term immune responses to environmental factors, thereby predisposing to autoimmunity5. However, data from previous studies of C-section on the risk of CD in offspring are conflicting, showing a positive association with CD11–14 or no correlation in epidemiological studies4;15;16. The aim of the present analysis was therefore to evaluate in a large population based cohort whether C-section is associated with an increased risk for tTGA positivity and CD after adjusting for known confounders for the disease17 and for maternal and child characteristics which are possibly related to the risk of having a C-section.
METHODS
Study design and participants
Data were analyzed from the ongoing The Environmental Determinants of Diabetes in the Young (TEDDY) study. TEDDY is a multicentre observational cohort study with the aim of identifying environmental factors associated with T1D and CD in children with an HLA-conferred risk prospectively followed from birth18. Between September 2004 and February 2010, 424,788 newborns were screened for HLA-DR-DQ genotypes, and 21,589 were identified as carriers of one of the HLA genotypes targeted in TEDDY19. Of those, 8,676 infants were enrolled from families with a first degree relative with T1D (n=951) and from families without (n=7,725) in six centers located in Colorado, Georgia, and Washington in the US, and in Finland, Germany, and Sweden. Written informed consent was obtained for all study participants. The study was approved by local Institutional Review Boards and is monitored by an External Advisory Board formed by the National Institutes of Health.
We analyzed the singleton TEDDY children screened for tTGA with information on mode of delivery. Excluded from the current analysis were participants born by instrumental support (vacuum, forceps) due to a higher likelihood of having post-partum complications including infections, need for intensive care or hospitalization, and antibiotics.
Outcome: Celiac disease autoimmunity (CDA) and celiac disease (CD)
Participants were annually screened for tTGA using a radioligand binding assay as previously described20. Annual screening started at 2 years of age. tTGA positive children ≥1.3 Units) were retested after 3 months, or after 6 months if the first positive sample occurred after 48 months21. Children who were tTGA positive in two consecutive samples were defined as having CDA and were referred back to their physician for further evaluation of possible CD. The decision to perform biopsies was unaffected by the study. Multiple biopsies from different parts of the duodenum were recommended, with histologic scoring according to the modified Marsh classification22. A Marsh score 2 or greater was defined as biopsy-proven CD7. For children with tTGA positivity, their serum samples collected prior to the first positive sample were tested for tTGA to find the earliest age of seroconversion21. For those children without a Marsh score, a mean tTGA level of two consecutive samples >100 units was also considered as having CD21. This threshold was selected based on an internal review of all biopsied individuals to achieve ≥ 95% specificity17.
Exposure and potential influencing factors
Information about mode of delivery (vaginal delivery with or without instrumentation or C-section) was collected by questionnaires at enrollment, including information regarding premature rupture of membranes. Potential influencing factors for mode of delivery such as sociodemographic data and maternal and child characteristics were collected by questionnaires and included country of residence, maternal age and education, duration of gestation, birth weight and length, maternal age, maternal pre-pregnancy body mass index (BMI), gestational weight gain, smoking, antibiotic use, T1D or any other diabetes during pregnancy and whether membranes ruptured before labor started. We categorized maternal education into lower (high school or less) and higher (college or university). Feeding variables such as initiation and duration of exclusive breastfeeding, and timing of gluten introduction were assessed since they are known to be influenced by mode of delivery1. Hospitalization, diarrhea during the first 3 months of age and antibiotic use in the infant during the first 3 and 12 months of life respectively were recorded. These post-partum factors and infant feeding patterns were considered as potential mediators through which C-section may have an indirect effect on the development of CDA and CD.
Statistical analysis
Fisher’s exact test or Wilcoxon rank-sum test (as appropriate) was used to examine the associations of maternal and child characteristics with mode of delivery. Birth size was standardized per 40 weeks of gestational age [i.e., {birth weight (or length)/gestational age in weeks}*40 weeks]. A Cox proportional hazard regression model was used to examine the association between CDA or CD and mode of delivery. Time to CDA was defined as age when the first tTGA positive blood sample was drawn, and the right-censored time was age when the last blood sample was collected for testing of tTGA. Time to diagnosis of CD was age at biopsy and the right-censored time was age of the last visit that was confirmed to be CD-free. For maternal and child characteristics, hazard ratios (HR) and 95% confidence intervals (CI) were obtained after adjusting for country, sex, HLA risk group, and first degree relative with CD, as these factors were known to be associated with offspring’s CD risk from previous studies17. For mode of delivery, HRs with 95% CI were investigated in three models: 1) unadjusted, 2) adjusted for the risk factors as listed above, and 3) additionally adjusted for maternal education and duration of total breastfeeding, as these were found to be associated with CDA. Martingale residuals were used for the proportionality testing, and there was no evidence of violating the assumption on mode of delivery. Since this analysis was a post hoc analysis a sample size calculation was not performed. P-values less than 0.05 were considered to be statistically significant. All analyses were performed using SAS 9.4 (SAS Institute, Cary, NC).
RESULTS
Participants and mode of delivery
At the time of analysis, 6,721 children were screened for tTGA in TEDDY (Figure 1). Of those, 203 participants were excluded because they were either twins or triplets. Of the remaining 6,518 singleton deliveries, 1,600 (25%) were born by C-section, 4,487 (69%) by normal vaginal delivery, 427 (6%) with instrumental support (vacuum, forceps), and 4 children were missing the information. We analyzed 6,087 children who were delivered by C-section or normal vaginal delivery without an instrumental support. Of those children, 979 (16%) had developed CDA and 343 (6%) were diagnosed with CD, of which 331 (97%) were biopsy-proven. The median follow-up was 78 months (25th percentile=63 and 75th percentile=97).
Figure 1.
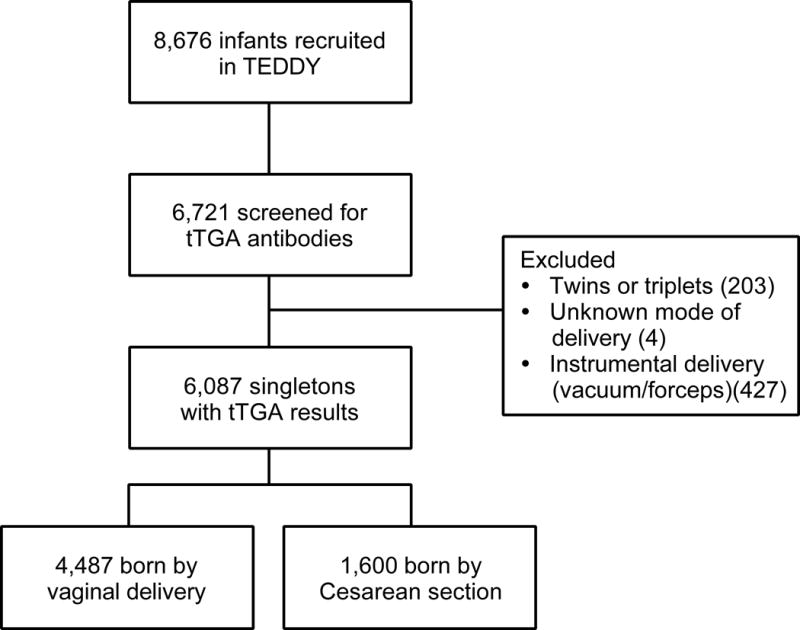
Flow chart of study population.
Maternal and child characteristics in relation to mode of delivery
The C-section rates were highest in Germany (38%), followed by the US (37%), Finland (18%) and Sweden (16%), respectively. Mothers giving birth by C-section had higher levels of education, were older, had a higher pre-pregnancy BMI, were more likely to have taken antibiotics, and were more likely to have a diabetic pregnancy compared to mothers giving birth by vaginal delivery (Table 1). Infants born by C-section had a shorter gestational age than those children born by vaginal delivery. When the birth weight and length per 40 weeks of gestational age were considered, the body length was higher in infants born by C-section, although median birth weight was almost equal in both groups (Table 1). When considering potential post-partum mediators for CDA or CD, infants born by C-section had a lower rate of initiation of breastfeeding, a shorter duration of exclusive and total breast feeding, and a later introduction of gluten when compared to infants born by vaginal delivery (Table 1). Moreover, they showed a higher rate of diarrheal episodes during the first 3 months of life and a higher frequency of hospital admission and antibiotic use during the first year of life (Table 1).
Table 1.
Maternal and child characteristics in relation to mode of delivery. For continuous variables median (25th percentile, 75th percentile) is reported.
| Vaginal delivery (n=4487) |
Cesarean delivery (n=1600) |
p value | |
|---|---|---|---|
| Maternal characteristics | |||
| Age, years | 30(27,34) | 32(28,36) | <0.0001 |
| Education | |||
| <=High school | 838 (19%) | 229 (14%) | <0.0001 |
| >High school | 3551 (79%) | 1331 (83%) | |
| Smoking during pregnancy | 498 (11%) | 157 (10%) | 0.19 |
| Antibiotic use during pregnancy | 839 (19%) | 392 (25%) | <0.0001 |
| Pre-pregnancy BMI | 23 (21,26) | 25 (22.29) | <0.0001 |
| Gestational weight gain, kg | 14 (11,18) | 15 (11,19) | 0.023 |
| Any diabetes during pregnancy | 333 (7%) | 276 (17%) | <0.0001 |
| Child characteristics | |||
| Gestational age (weeks) | 40 (39,40.3) | 40 (38,40) | <0.0001 |
| Birth weight (kg/40 weeks of gestational age) | 3.6 (3.3,3.9) | 3.6 (3.2,3.9) | 0.38 |
| Birth length (cm/40 weeks of gestational age) | 51 (50,53) | 52 (50,54) | <0.0001 |
| Hospitalized by 3 months of age | 590 (13%) | 244 (15%) | 0.038 |
| Diarrhea by 3 months of age | 364 (8%) | 164 (10%) | 0.011 |
| Antibiotic use during 1st year of life | 2025 (45%) | 806 (50%) | 0.0003 |
| Age at the first antibiotic use <=3 months | 81 (4%) | 38 (5%) | 0.567 |
| 3 to 12 months | 1889 (93%) | 749 (93%) | <0.0001 |
| >12 months | 54 (3%) | 18 (2%) | <0.0001 |
| Breastfeeding initiation | 4396 (98%) | 1533 (96%) | <0.0001 |
| Duration of exclusive breastfeeding (days) | 28 (0.5,112) | 7 (0.5,42) | <0.0001 |
| Duration of total breastfeeding (weeks) | 35 (17, 52) | 30 (8,50) | |
| Age at gluten introduction (weeks) | 26 (22,30) | 26 (22,35) | |
| Known risk factors for CDA/CD | |||
| HLA, n (%) | |||
| DQ2/DQ2 | 889 (20%) | 340 (21%) | 0.22 |
| Others | 3598 (80%) | 1260 (79%) | |
| Sex, n (%) | |||
| Girls | 2231 (50%) | 761 (48%) | 0.15 |
| Boys | 2256 (50%) | 839 (52%) | |
| First degree relatives with CD, n (%) | |||
| Yes | 149 (3%) | 43 (3%) | 0.24 |
| No | 4338 (97%) | 1557 (97%) | |
| Country, n (%) | |||
| US | 1561 (35%) | 918 (57%) | <0.0001 |
| Finland | 1118 (25%) | 249 (16%) | |
| Germany | 228 (5%) | 139 (9%) | |
| Sweden | 1580 (35%) | 294 (18%) |
Known risk factors for CDA and CD in relation to mode of delivery
Country of birth was significantly associated with the mode of delivery. In contrast, HLA risk group (being homozygous for DQ2 versus heterozygous for DQ2 or DQ8 positive), female sex, and having a first degree relative with CD (parent, sibling) were not significantly different between infants born by C-section and vaginally delivered children (Table 1).
Maternal and child characteristics as potential risk factors for CDA and CD
Maternal and child characteristics proposed to be associated with the mode of delivery were further examined for association with CDA or CD development after adjustment for country, female sex, HLA-risk genotype and first degree relative status with CD (Table 2). Of those factors, only maternal education and total duration of breast feeding were found to be associated with the risk of developing CDA. None of these factors was associated with the risk of developing CD.
Table 2.
Hazard ratio (HR) with 95% confidence interval (CI) for celiac disease (CD) or celiac disease related autoimmunity (CDA). For each characteristic, a Cox regression model was used after adjusting for country, sex, HLA and first degree relatives with CD.
| CDA | CD | |
|---|---|---|
| HR (95% CI), p-value | HR (95% CI), p-value | |
| Maternal characteristics | ||
| Age, years | 1.002 (0.990,1.015), 0.70 | 1.001 (0.980,1.023), 0.91 |
| Education (>High school vs. <=High school) | 1.345 (1.119,1.615), 0.002 | 1.233 (0.920,1.653), 0.16 |
| Antibiotic use (Yes vs. No) | 0.999 (0.851,1.173), 0.99 | 0.957 (0.726,1.262), 0.76 |
| Pre-pregnancy BMI (kg/m2) | 1.002 (0.990,1.013), 0.79 | 0.995 (0.974,1.016), 0.65 |
| Gestational weight gain (kg) | 0.993 (0.982,1.003), 0.15 | 1.005 (0.988,1.023), 0.56 |
| Any diabetes (Yes vs. No) | 1.032 (0.827,1.288), 0.78 | 0.779 (0.506,1.200), 0.26 |
| Child characteristics | ||
| Gestational age (weeks) | 1.035 (0.992,1.080), 0.11 | 1.040 (0.967,1.119), 0.29 |
| Birth length (cm/40 weeks of gestational age) | 1.010 (0.985,1.036), 0.44 | 1.017 (0.973,1.063), 0.45 |
| Hospitalized by 3 months of age (Yes vs. No) | 0.987 (0.819,1.190), 0.89 | 0.962 (0.697,1.327), 0.81 |
| Diarrhea by 3 months old (Yes vs. No) | 0.820 (0.636,1.058), 0.13 | 0.901 (0.594,1.366), 0.62 |
| Antibiotic use (Yes vs. No) | 1.096 (0.961,1.249), 0.17 | 1.025 (0.820,1.281), 0.83 |
| Breastfeeding initiation (Yes vs. No) | 1.625 (0.972,2.716), 0.06 | 1.027 (0.481,2.190), 0.95 |
| Duration of exclusive breastfeeding (days) | 1.001 (1.000,1.002), 0.05 | 1.002 (1.000,1.003), 0.05 |
| Duration of total breastfeeding (weeks) | 1.003 (1.001,1.004), 0.011 | 1.000 (0.997,1.004), 0.83 |
| Age at gluten introduction (weeks) | 1.006(0.997,1.014), 0.18 | 1.008 (1.009,1.024), 0.24 |
C-section and risk of CDA and CD in offspring
The percentages of children developing CDA was 17% (754/4487) in the vaginally delivered children versus 14% (225/1600) in C-section (p=0.03), the values for CD were 6% (273/4487) versus 4% (70/1600) respectively (p=0.03).
Three models were used in the adjusted analysis of the effect of C-section on the development of CDA and CD (Table 3). First, in the crude model, children born by C-section were less likely to develop CDA (HR=0.849, 95% CI [0.732, 0.986], p=0.03) and CD (HR=0.753, 95% CI [0.579, 0.979], p=0.03), compared with vaginally delivered children (model 1 in Table 3 and supplementary Figure S1). After adjusting for country, HLA-risk genotype, female sex and first degree relative status with CD, the association of the mode of delivery with CDA or CD was no longer significant (model 2 in Table 3 and in Figure S1). Furthermore, after adjustment for maternal education and total duration of breastfeeding (model 3 in Table 3 and in Figure S1), C-section delivery was not significantly associated with either CDA (HR=0.905 (95% CI [0.775, 1.056], p=0.20)) or CD (HR=0.850 (95% CI [0.649, 1.113], p=0.24)).
Table 3.
Hazard ratios (HRs) with 95% confidence intervals (CIs) for celiac disease (CD) or celiac disease autoimmunity (CDA) by mode of delivery (caesarean section), unadjusted (model 1) and adjusted for country, sex, HLA risk group and first degree relative with CD (model 2), and additionally for maternal education and breastfeeding duration (model 3)
| CDA | CD | |
|---|---|---|
| HR (95%CI), p-value | HR (95%CI), p-value | |
| Model 1 | ||
| c-section vs. normal vaginal delivery | 0.849 (0.732,0.986), 0.032 | 0.753 (0.579,0.979), 0.034 |
| Model 2 | ||
| Country Finland vs. US | 1.152 (0.966,1.373), 0.12 | 1.026 (0.742,1.420), 0.88 |
| Country Germany vs. US | 1.199 (0.899, 1.598), 0.22 | 1.156 (0.672,1.991), 0.60 |
| Country Sweden vs. US | 1.459 (1.255,1.695), <0.0001 | 1.893 (1.468,2.440), <0.0001 |
| Girl vs. Boy | 1.538 (1.354,1.746), <0.0001 | 1.874 (1.506,2.333), <0.0001 |
| HLA DR3/3 vs. others | 3.398 (2.986,3.866), <0.0001 | 3.784 (3.048,4.697), <0.0001 |
| Family history with CD vs. Not | 2.420 (1.924,3.045), <0.0001 | 3.935 (2.901,5.336), <0.0001 |
| C-section vs. normal vaginal delivery | 0.901 (0.774,1.050), 0.18 | 0.837 (0.640,1.095), 0.19 |
| Model 3 | ||
| Country Finland vs. US | 1.132 (0.947,1.352), 0.17 | 0.989 (0.712,1.373), 0.95 |
| Country Germany vs. US | 1.178 (0.873, 1.591), 0.28 | 1.151 (0.657,2.015), 0.62 |
| Country Sweden vs. US | 1.553 (1.329,1.814), <0.0001 | 1.932 (1.487,2.509), <0.0001 |
| Girl vs. Boy | 1.584 (1.393,1.801), <0.0001 | 1.923 (1.542,2.399), <0.0001 |
| HLA DR3/3 vs. others | 3.403 (2.986,3.878), <0.0001 | 3.749 (3.015,4.661), <0.0001 |
| Family history with CD vs. Not | 2.381 (1.889,3.001), <0.0001 | 3.826 (2.810,5.209), <0.0001 |
| Mother education >High school vs <=High school | 1.332 (1.106,1.604), 0.003 | 1.263 (0.937,1.702), 0.12 |
| Duration of total breastfeeding (weeks) | 1.002 (1.000,1.004), 0.030 | 1.000 (0.996,1.004), 0.94 |
| C-section vs. normal vaginal delivery | 0.905 (0.775,1.056), 0.20 | 0.850 (0.649,1.113), 0.24 |
Of 1600 mothers with C-section, 149 (9.3%) reported ruptured membranes before labor started. When we analyzed the development of CDA in children born by C-section separately by premature rupture of membranes (n=27), we did not find significant differences in the HRs compared to vaginally delivered infants before (crude HR 1.112 (95% CI [0.757, 1.632], p=0.59) and after adjustment using model 2 (adj.HR 1.197 (95% CI [0.813, 1.762], p=0.36) and model 3 (adj. HR 1.126 (95% CI [0.760, 1.670], p=0.55).
DISCUSSION
In TEDDY, one of the largest prospective screening studies for T1D and CD to date, mode of delivery was not an independent risk factor for the development of CDA or CD in children. We feel that this is the most definitive study to date on the role of C-section in development of CD. This finding disputes previous studies claiming that the mode of delivery might contribute towards development of CD11–14 and supports others that have not found any association4;15;16;23. These differences may be due to the complex interactions and dependency between maternal/child characteristics, mode of delivery, post-partum feeding and drug use, and microbiome on the development of CDA and CD (Figure 2). The TEDDY study, with its prospective design and multinational participation, allowed adjustment of these confounding factors associated with mode of delivery, as well as known factors associated with CDA and CD, including genetics.
Figure 2.
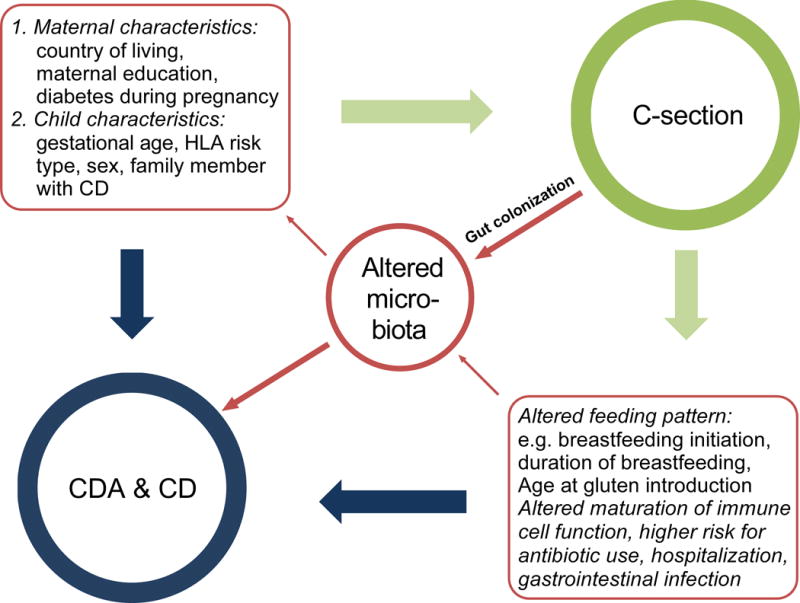
Complex interaction between maternal and child’s characteristics, caesarean section and the possible consequences for post-partum factors and the infant’s microbiome on the risk of the development of celiac disease autoimmunity (CDA) and celiac disease (CD).
Firstly, this analysis included only newborns with known HLA-risk genotypes for CD, which is a pre-requisite for developing CDA and CD. HLA genotype greatly affects risk, and was adjusted for in the analysis17. Other identified risk factors such as female sex, having a first degree relative with CD, and country of residence were adjusted for.
Secondly, almost 90% of children were recruited from the general population and were considered representative (while only 10.9% came from families with a first degree relative with T1D). Only Germany selectively recruited for families with T1D (37 % of the German TEDDY participants), which was reflected in the higher percentage of mothers with T1D as compared with the other three countries (18.6% versus 2.2 – 3.7%, respectively), and may explain in part the high C-section rate in Germany. When excluding mothers with T1D the C-section rate in Germany decreased only marginally from 38 to 34% (data not shown) suggesting that the indication for C-section in Germany is mainly due to other reasons than maternal T1D. Moreover, we excluded twins, triplets and infants born with instrumental intervention (vacuum, forceps), because they are more likely to have post-partum complications. We therefore feel confident that the TEDDY cohort can uniquely investigate this complex relationship between the C-section and the risk for CD in the offspring18.
Further strength of our study is the frequent longitudinal, active screening for CDA and CD, allowing for timely determination of asymptomatic and subclinical cases of CD, which represent the majority of children with CD, even below 4 years of age21. Most previous studies used national birth and/or disease registries in which CD cases were identified by pathology reporting or by their respective International Classification of Diseases (ICD) codes4;11;15. Another study used children with CD or inflammatory bowel disease from Pediatric tertiary centers, with controls suffering from other diseases12. Both study designs may be prone to selection bias because clinically detected CD patients represent only a small part of all true CD cases in the community24;25. In addition, mothers with TID or other autoimmune diseases are more likely to deliver by elective C-section. T1D share the same HLA risk alleles with CD, and children from diabetic mothers have a much higher risk to carry these HLA risk alleles compared to the general population. Lack of adjustment for the celiac risk alleles will result in a higher proportion of CD cases in the C-section group as a result of genetic predisposition, but not environmental factors. In our analysis we did not only adjust for maternal TID but also for the different HLA risk alleles in cases and controls.
In concordance with others, we identified several maternal and child characteristics associated with delivery by C-section26. Contrary to our hypothesis, C-section was initially inversely associated with CDA and CD in the crude analysis. After adjusting for four previously identified risk factors for CD in the TEDDY cohort17, no association was found. Only two other factors remained significantly related to persistent autoimmunity in the Cox regression model: total duration of breastfeeding, as reported before27 and a maternal education level above high school. Higher education level may be a proxy for a higher socioeconomic status and unmeasured environmental confounding factors. In previous studies using clinically detected CD cases, different health care-seeking behavior of educated mothers and therefore a higher detection rate could introduce a bias. In this study, active screening independent of symptoms made that type of bias unlikely.
A limitation of our study is the lack of information regarding the type of C-section: emergency versus elective. Differences in total C-section rates between countries are more likely due to planned than to intrapartum (emergency) C-section. Marild et al reported on pregnancy data from the Swedish Medical Birth Register between 1973 and 2008 and compared cases with villous atrophy with age and sex matched controls from the general population14. They found a weak association between an elective caesarean delivery and CD in offspring (adjusted OR=1.15), but no increased risk for CD after an emergency (adjusted OR=1.02) or any C-section (adjusted OR=1.06). Kristensen et al. reported the opposite from a population and national register based cohort including all children born in Denmark from January 1997 through December 2012. Children delivered by emergency C-section were at an increased risk for CD (adjusted OR=1.22), whereas children delivered by elective C-section were not (adjusted OR=0.69). Several explanations have been proposed for the different outcomes in relation to type of C-section. Thyssen et al. showed that the natural maturation of immune cells and the cord blood immune cell phenotypes are influenced by stress during vaginal delivery. This process is bypassed by elective C-section, but not in-labor C-section28. In emergency C-sections, the membranes are likely to be ruptured exposing the infant to the vaginal microbiome, while in elective C-section this is not the case14. A recent Danish study compared fecal microbiota pattern of infants born by emergency C-section, by elective C-section and by vaginal delivery at three time points28. All infants in the two C-section groups were exposed to intrapartum antibiotics but only 13% of naturally born infants. For most cultured bacterial strains the difference at one week of age was less pronounced between the two C-section groups compared to vaginally delivered neonates. The differences between the three groups were less pronounced at 1 month and had disappeared by 1 year of age. In our 149 cases reporting prematurely ruptured membranes, an emergency C-section can be assumed with perinatal contact of the newborn with the maternal vaginal microbiota. We found no significantly different risk for later development of CD or CDA in subgroup analysis in those with prematurely ruptured membranes. A further limitation is that for ethical reasons we were not allowed to collect data on ethnicity in the European countries.
In conclusion, children do not have an increased risk for CDA or CD during childhood if they are born by C-section compared to vaginal delivery. Our cohort was prospectively screened for CDA and includes only children carrying the genetic risk alleles, which is a precondition to develop CD. A quarter of the analyzed cohort was delivered by C-section. After adjustment for potential confounders we did not see even a trend for an increased risk of CD after C-section. We suggest that environmental factors other than mode of delivery are more likely to be responsible for the increasing incidence of CD.
Supplementary Material
Supplementary Figure S1. Hazard ratios (HRs) with respective 95% confidence intervals (CIs) for celiac disease (CD) or celiac disease autoimmunity (CDA) by caesarean section, unadjusted (model 1) and adjusted for country, sex, HLA risk group and first degree relative with CD (model 2), and additionally for maternal education and breastfeeding duration (model 3)
What is Known/What is New.
What is known?
Caesarean sections (C-section) and coeliac disease are both increasing worldwide.
Meta-analyses on mode of delivery have reported C-section to be associated with an increased risk of chronic inflammatory disorders in the offspring.
Results are conflicting with respect to risk of later celiac disease if born by C-section compared to vaginal delivery, but also controversial regarding the later diagnosis of celiac disease after planned versus emergency C-section.
What is new?
Results of this multinational prospective screening study including more than 6000 infants recruited from the general population with known HLA risk genotypes for celiac disease show that C-section is not associated with an increased risk for celiac disease autoimmunity or celiac disease.
Our analysis emphasizes the importance of considering confounders known to be associated with mode of delivery.
Environmental factors during later infancy or early childhood are more likely responsible for the increasing incidence of CD.
Acknowledgments
The authors express their gratitude to the children and parents who participated in the study, and the TEDDY staff in all centers for their excellent work over the
Financial support: The TEDDY study is supported by the following grants: U01 DK63829, U01 DK63861, U01 DK63821, U01 DK63865, U01 DK63863, U01 DK63836, U01 DK63790, UC4 DK63829, UC4 DK63861, UC4 DK63821, UC4 DK63865, UC4 DK63863, UC4 DK63836, UC4 DK95300, UC4 DK100238, UC4 DK106955, and Contract No. HHSN267200700014C from the National Institute of Diabetes and Digestive and Kidney Diseases (NIDDK), National Institute of Allergy and Infectious Diseases (NIAID), National Institute of Child Health and Human Development (NICHD), National Institute of Environmental Health Sciences (NIEHS), Juvenile Diabetes Research Foundation (JDRF), and Centers for Disease Control and Prevention (CDC). This work supported in part by the NIH/NCATS Clinical and Translational Science Awards to the University of Florida (UL1 TR000064) and the University of Colorado (UL1 TR001082).
Abbreviations
- CD
Coeliac Disease
- CDA
Coeliac Disease Autoimmunity
- CI
confidence interval
- FDR
first degree relative
- HLA
Human leukocyte antigen
- HR
hazard ratio
- T1D
type 1 diabetes
- tTGA
transglutaminase autoantibodies
- TEDDY
The Environmental Determinants of Diabetes in the Young.
Footnotes
Financial Disclosure: None of the authors listed has any financial disclosures relevant to this article to disclose.
Conflict of Interest: None of the authors listed has any conflicts of interest relevant to this article to disclose
Authors Contribution
Study concept and design: Koletzko, Agardh, Krischer, Lenmark, Rewers, She, O. Simell, Ziegler, Acquisition, analysis and interpretation of data: Koletzko, Agardh, Lee, Beyerlein, Hummel, Landmark, Rewers, She, Ziegler, Krischer
Drafting of the manuscript: Koletzko, Agardh
Critical revision of the manuscript for important intellectual content: Koletzko, Anronsson, Beyerlein, Hummel, Lee, Liu, V. Simell, Lenmark, Hagopian, Rewers, She, O. Simell, Toppari, Ziegler, Krischer
Statistical analysis: Lee, Beyerlein
Obtained funding: Hagopian, Krischer, Lenmark, Rewers, She, O. Simell, Ziegler, Administrative, technical, or material support: Agardh, Krischer, Lenmark, Rewers, Ziegler
Study supervision: Krischer, Lenmark, Rewers, She, O. Simell, Ziegler
The Teddy Study Group information
Colorado Clinical Center: Marian Rewers, M.D., Ph.D., PI1,4,5,6,10,11, Kimberly Bautista12, Judith Baxter9,10,12,15, Ruth Bedoy2, Daniel Felipe-Morales, Brigitte I. Frohnert, M.D.2,14, Patricia Gesualdo2,6,12,14,15, Michelle Hoffman12,13,14, Rachel Karban12, Edwin Liu, M.D.13, Jill Norris, Ph.D.2,3,12, Adela Samper-Imaz, Andrea Steck, M.D.3,14, Kathleen Waugh6,7,12,15, Hali Wright12. University of Colorado, Anschutz Medical Campus, Barbara Davis Center for Childhood Diabetes.
Georgia/Florida Clinical Center: Jin-Xiong She, Ph.D., PI1,3,4,11, Desmond Schatz, M.D.*4,5,7,8, Diane Hopkins12, Leigh Steed12,13,14,15, Jamie Thomas*6,12, Janey Adams*12, Katherine Silvis2, Michael Haller, M.D.*14, Melissa Gardiner, Richard McIndoe, Ph.D., Ashok Sharma, Joshua Williams, Gabriela Young, Stephen W. Anderson, M.D.ˆ, Laura Jacobsen, M.D.*14 Center for Biotechnology and Genomic Medicine, Augusta University. *University of Florida, ˆPaediatric Endocrine Associates, Atlanta.
Germany Clinical Center: Anette G. Ziegler, M.D., PI1,3,4,11, Andreas Beyerlein, Ph.D.2, Ezio Bonifacio Ph.D.*5, Michael Hummel, M.D.13, Sandra Hummel, Ph.D.2, Kristina Foterek¥2, Nicole Janz, Mathilde Kersting, Ph.D.¥2, Annette Knopff7, Sibylle Koletzko, M.D.¶13, Claudia Peplow12, Roswith Roth, Ph.D.9, Marlon Scholz, Joanna Stock9,12, Elisabeth Strauss12,14, Katharina Warncke, M.D.14, Lorena Wendel, Christiane Winkler, Ph.D.2,12,15. Forschergruppe Diabetes e.V. and Institute of Diabetes Research, Helmholtz Zentrum München, and Klinikum rechts der Isar, Technische Universität München. *Center for Regenerative Therapies, TU Dresden, ¶Dr. von Hauner Children’s Hospital, Department of Gastroenterology, Ludwig Maximillians University Munich, ¥Research Institute for Child Nutrition, Dortmund.
Finland Clinical Center: Jorma Toppari, M.D., Ph.D., PI¥ˆ1,4,11,14, Olli G. Simell, M.D., Ph.D.¥ˆ1,4,11,13, Annika Adamsson, Ph.D.ˆ12, Suvi Ahonen*±§, Heikki Hyöty, M.D., Ph.D.*±6, Jorma Ilonen, M.D., Ph.D.¥ ¶3, Sanna Jokipuuˆ, Tiina Kallioˆ, Leena Karlssonˆ, Miia Kähönenμ¤, Mikael Knip, M.D., Ph.D.*±5, Lea Kovanen*±§, Mirva Koreasalo*±§2, Kalle Kurppa, M.D., Ph.D.*±13, Tiina Latva-ahoμ¤, Maria Lönnrot, M.D., Ph.D.*±6, Elina Mäntymäkiˆ, Katja Multasuoμ¤, Juha Mykkänen, Ph.D.¥ 3, Tiina Niininen±*12, Sari Niinistö±§, Mia Nyblom*±, Petra Rajalaˆ, Jenna Rautanen±§, Anne Riikonen*±§, Mika Riikonenˆ, Jenni Rouhiainenˆ, Minna Romoˆ, Tuula Simell, Ph.D., Ville Simellˆ¥13, Maija Sjöberg¥ˆ12,14, Aino Steniusμ¤12, Maria Leppänenˆ, Sini Vainionpääˆ, Eeva Varjonen¥ˆ12, Riitta Veijola, M.D., Ph.D.μ¤14, Suvi M. Virtanen, M.D., Ph.D.*±§2, Mari Vähä-Mäkiläˆ, Mari Åkerlund*±§, Katri Lindfors, Ph.D.*13¥ University of Turku, *University of Tampere, μUniversity of Oulu, ˆTurku University Hospital, Hospital District of Southwest Finland, ±Tampere University Hospital, ¤Oulu University Hospital, §National Institute for Health and Welfare, Finland, ¶University of Kuopio.
Sweden Clinical Center: Åke Lernmark, Ph.D., PI1,3,4,5,6,8,10,11,15, Daniel Agardh, M.D., Ph.D.13, Carin Andrén Aronsson2,13, Maria Ask, Jenny Bremer, Ulla-Marie Carlsson, Corrado Cilio, Ph.D., M.D.5, Emelie Ericson-Hallström, Lina Fransson, Thomas Gard, Joanna Gerardsson, Rasmus Bennet, Monica Hansen, Gertie Hansson12, Cecilia Harmby, Susanne Hyberg, Fredrik Johansen, Berglind Jonsdottir M.D., Helena Elding Larsson M.D., Ph.D. 6,14, Sigrid Lenrick Forss, Markus Lundgren14, Maria Månsson-Martinez, Maria Markan, Jessica Melin12, Zeliha Mestan, Kobra Rahmati, Anita Ramelius, Anna Rosenquist, Falastin Salami, Sara Sibthorpe, Birgitta Sjöberg, Ulrica Swartling, Ph.D.9,12, Evelyn Tekum Amboh, Carina Törn, Ph.D. 3,15, Anne Wallin, Åsa Wimar12,14, Sofie Åberg. Lund University.
Washington Clinical Center: William A. Hagopian, M.D., Ph.D., PI1,3,4, 5, 6,7,11,13, 14, Michael Killian6,7,12,13, Claire Cowen Crouch12,14,15, Jennifer Skidmore2, Josephine Carson, Kayleen Dunson, Rachel Hervey, Corbin Johnson, Rachel Lyons, Arlene Meyer, Denise Mulenga, Allison Schwartz, Joshua Stabbert, Alexander Tarr, Morgan Uland, John Willis. Pacific Northwest Diabetes Research Institute.
Pennsylvania Satellite Center: Dorothy Becker, M.D., Margaret Franciscus, MaryEllen Dalmagro-Elias Smith2, Ashi Daftary, M.D., Mary Beth Klein, Chrystal Yates. Children’s Hospital of Pittsburgh of UPMC.
Data Coordinating Center: Jeffrey P. Krischer, Ph.D.,PI1,4,5,10,11, Michael Abbondondolo, Sarah Austin-Gonzalez, Maryouri Avendano, Sandra Baethke, Rasheedah Brown12,15, Brant Burkhardt, Ph.D.5,6, Martha Butterworth2, Joanna Clasen, David Cuthbertson, Christopher Eberhard, Steven Fiske9, Dena Garcia, Jennifer Garmeson, Veena Gowda, Kathleen Heyman, Francisco Perez Laras, Hye-Seung Lee, Ph.D.1,2,13,15, Shu Liu, Xiang Liu, Ph.D.2,3,9,14, Kristian Lynch, Ph.D. 5,6,9,15, Jamie Malloy, Cristina McCarthy12,15, Steven Meulemans, Hemang Parikh, Ph.D.3, Chris Shaffer, Laura Smith, Ph.D.9,12, Susan Smith12,15, Noah Sulman, Ph.D., Roy Tamura, Ph.D.1,2,13, Ulla Uusitalo, Ph.D.2,15, Kendra Vehik, Ph.D.4,5,6,14,15, Ponni Vijayakandipan, Keith Wood, Jimin Yang, Ph.D., R.D.2,15. Past staff: Lori Ballard, David Hadley, Ph.D., Wendy McLeod. University of South Florida.
Project scientist: Beena Akolkar, Ph.D.1,3,4,5,6,7,10,11. National Institutes of Diabetes and Digestive and Kidney Diseases.
Other contributors: Kasia Bourcier, Ph.D.5, National Institutes of Allergy and Infectious Diseases. Thomas Briese, Ph.D.6,15, Columbia University. Suzanne Bennett Johnson, Ph.D.9,12, Florida State University. Eric Triplett, Ph.D.6, University of Florida.
Committees:
1Ancillary Studies, 2Diet, 3Genetics, 4Human Subjects/Publicity/Publications, 5Immune Markers, 6Infectious Agents, 7Laboratory Implementation, 8Maternal Studies, 9Psychosocial, 10Quality Assurance, 11Steering, 12Study Coordinators, 13Celiac Disease, 14Clinical Implementation, 15Quality Assurance Subcommittee on Data Quality.
Literature
- 1.Hyde MJ, Mostyn A, Modi N, Kemp PR. The health implications of birth by Caesarean section. Biol Rev Camb Philos Soc. 2012;87:229–243. doi: 10.1111/j.1469-185X.2011.00195.x. [DOI] [PubMed] [Google Scholar]
- 2.Thavagnanam S, Fleming J, Bromley A, Shields MD, Cardwell CR. A meta-analysis of the association between Caesarean section and childhood asthma. Clin Exp Allergy. 2008;38:629–633. doi: 10.1111/j.1365-2222.2007.02780.x. [DOI] [PubMed] [Google Scholar]
- 3.Cardwell CR, Stene LC, Joner G, et al. Caesarean section is associated with an increased risk of childhood-onset type 1 diabetes mellitus: a meta-analysis of observational studies. Diabetologia. 2008;51:726–735. doi: 10.1007/s00125-008-0941-z. [DOI] [PubMed] [Google Scholar]
- 4.Sevelsted A, Stokholm J, Bonnelykke K, Bisgaard H. Cesarean section and chronic immune disorders. Pediatrics. 2015;135:e92–e98. doi: 10.1542/peds.2014-0596. [DOI] [PubMed] [Google Scholar]
- 5.McLean MH, Dieguez D, Jr, Miller LM, Young HA. Does the microbiota play a role in the pathogenesis of autoimmune diseases? Gut. 2015;64:332–341. doi: 10.1136/gutjnl-2014-308514. [DOI] [PMC free article] [PubMed] [Google Scholar]
- 6.Dominguez-Bello MG, Costello EK, Contreras M, et al. Delivery mode shapes the acquisition and structure of the initial microbiota across multiple body habitats in newborns. Proc Natl Acad Sci U S A. 2010;107:11971–11975. doi: 10.1073/pnas.1002601107. [DOI] [PMC free article] [PubMed] [Google Scholar]
- 7.Husby S, Koletzko S, Korponay-Szabo IR, et al. European Society for Pediatric Gastroenterology, Hepatology, and Nutrition guidelines for the diagnosis of coeliac disease. J Pediatr Gastroenterol Nutr. 2012;54:136–160. doi: 10.1097/MPG.0b013e31821a23d0. [DOI] [PubMed] [Google Scholar]
- 8.Lohi S, Mustalahti K, Kaukinen K, et al. Increasing prevalence of coeliac disease over time. Aliment Pharmacol Ther. 2007;26:1217–1225. doi: 10.1111/j.1365-2036.2007.03502.x. [DOI] [PubMed] [Google Scholar]
- 9.Gutierrez-Achury J, Zhernakova A, Pulit SL, et al. Fine mapping in the MHC region accounts for 18% additional genetic risk for celiac disease. Nat Genet. 2015;47:577–578. doi: 10.1038/ng.3268. [DOI] [PMC free article] [PubMed] [Google Scholar]
- 10.Rubio-Tapia A, Kyle RA, Kaplan EL, et al. Increased prevalence and mortality in undiagnosed celiac disease. Gastroenterology. 2009;137:88–93. doi: 10.1053/j.gastro.2009.03.059. [DOI] [PMC free article] [PubMed] [Google Scholar]
- 11.Kristensen K, Henriksen L. Cesarean section and disease associated with immune function. J Allergy Clin Immunol. 2016;137:587–90. doi: 10.1016/j.jaci.2015.07.040. [DOI] [PubMed] [Google Scholar]
- 12.Decker E, Engelmann G, Findeisen A, et al. Cesarean delivery is associated with celiac disease but not inflammatory bowel disease in children. Pediatrics. 2010;125:e1433–e1440. doi: 10.1542/peds.2009-2260. [DOI] [PubMed] [Google Scholar]
- 13.Adlercreutz EH, Wingren CJ, Vincente RP, Merlo J, Agardh D. Perinatal risk factors increase the risk of being affected by both type 1 diabetes and coeliac disease. Acta Paediatr. 2015;104:178–184. doi: 10.1111/apa.12836. [DOI] [PubMed] [Google Scholar]
- 14.Marild K, Stephansson O, Montgomery S, Murray JA, Ludvigsson JF. Pregnancy outcome and risk of celiac disease in offspring: a nationwide case-control study. Gastroenterology. 2012;142:39–45. doi: 10.1053/j.gastro.2011.09.047. [DOI] [PMC free article] [PubMed] [Google Scholar]
- 15.Roberts SE, Williams JG, Meddings D, Davidson R, Goldacre MJ. Perinatal risk factors and coeliac disease in children and young adults: a record linkage study. Aliment Pharmacol Ther. 2009;29:222–231. doi: 10.1111/j.1365-2036.2008.03871.x. [DOI] [PubMed] [Google Scholar]
- 16.Emilsson L, Magnus MC, Stordal K. Perinatal risk factors for development of celiac disease in children, based on the prospective norwegian mother and child cohort study. Clin Gastroenterol Hepatol. 2015;13:921–927. doi: 10.1016/j.cgh.2014.10.012. [DOI] [PMC free article] [PubMed] [Google Scholar]
- 17.Liu E, Lee HS, Aronsson CA, et al. Risk of pediatric celiac disease according to HLA haplotype and country. N Engl J Med. 2014;371:42–49. doi: 10.1056/NEJMoa1313977. [DOI] [PMC free article] [PubMed] [Google Scholar]
- 18.The Environmental Determinants of Diabetes in the Young (TEDDY) study: study design. Pediatr Diabetes. 2007;8:286–298. doi: 10.1111/j.1399-5448.2007.00269.x. [DOI] [PubMed] [Google Scholar]
- 19.Hagopian WA, Erlich H, Lernmark A, et al. The Environmental Determinants of Diabetes in the Young (TEDDY): genetic criteria and international diabetes risk screening of 421 000 infants. Pediatr Diabetes. 2011;12:733–743. doi: 10.1111/j.1399-5448.2011.00774.x. [DOI] [PMC free article] [PubMed] [Google Scholar]
- 20.Vehik K, Fiske SW, Logan CA, et al. Methods, quality control and specimen management in an international multicentre investigation of type 1 diabetes: TEDDY. Diabetes Metab Res Rev. 2013;29:557–567. doi: 10.1002/dmrr.2427. [DOI] [PMC free article] [PubMed] [Google Scholar]
- 21.Agardh D, Lee HS, Kurppa K, et al. Clinical Features of Celiac Disease: A Prospective Birth Cohort. Pediatrics. 2015;135:627–634. doi: 10.1542/peds.2014-3675. [DOI] [PMC free article] [PubMed] [Google Scholar]
- 22.Oberhuber G, Granditsch G, Vogelsang H. The histopathology of coeliac disease: time for a standardized report scheme for pathologists. Eur J Gastroenterol Hepatol. 1999;11:1185–1194. doi: 10.1097/00042737-199910000-00019. [DOI] [PubMed] [Google Scholar]
- 23.Lionetti E, Castellaneta S, Francavilla R, Pulvirenti A, Catassi C. Mode of Delivery and Risk of Celiac Disease: Risk of Celiac Disease and Age at Gluten Introduction Cohort Study. J Pediatr. 2017 doi: 10.1016/j.jpeds.2017.01.023. online. [DOI] [PubMed] [Google Scholar]
- 24.Laass MW, Schmitz R, Uhlig HH, Zimmer KP, Thamm M, Koletzko S. The Prevalence of Celiac Disease in Children and Adolescents in Germany. Dtsch Arztebl Int. 2015;112:553–560. doi: 10.3238/arztebl.2015.0553. [DOI] [PMC free article] [PubMed] [Google Scholar]
- 25.Myleus A, Ivarsson A, Webb C, et al. Celiac disease revealed in 3% of Swedish 12-year-olds born during an epidemic. J Pediatr Gastroenterol Nutr. 2009;49:170–176. doi: 10.1097/MPG.0b013e31818c52cc. [DOI] [PubMed] [Google Scholar]
- 26.Laubereau B, Filipiak-Pittroff B, von Berg A, et al. Caesarean section and gastrointestinal symptoms, atopic dermatitis, and sensitisation during the first year of life. Arch Dis Child. 2004;89:993–997. doi: 10.1136/adc.2003.043265. [DOI] [PMC free article] [PubMed] [Google Scholar]
- 27.Aronsson CA, Lee HS, Liu E, et al. Age at gluten introduction and risk of celiac disease. Pediatrics. 2015;135:239–245. doi: 10.1542/peds.2014-1787. [DOI] [PMC free article] [PubMed] [Google Scholar]
- 28.Thysen AH, Larsen JM, Rasmussen MA, et al. Prelabor cesarean section bypasses natural immune cell maturation. J Allergy Clin Immunol. 2015;136:1123–25. doi: 10.1016/j.jaci.2015.04.044. [DOI] [PubMed] [Google Scholar]
Associated Data
This section collects any data citations, data availability statements, or supplementary materials included in this article.
Supplementary Materials
Supplementary Figure S1. Hazard ratios (HRs) with respective 95% confidence intervals (CIs) for celiac disease (CD) or celiac disease autoimmunity (CDA) by caesarean section, unadjusted (model 1) and adjusted for country, sex, HLA risk group and first degree relative with CD (model 2), and additionally for maternal education and breastfeeding duration (model 3)