

Abstract
Background
Heat‐treatment of colostrum is a method developed to reduce calf exposure to pathogens. Infrared (IR) spectroscopy and Brix refractometers can be used for measuring colostral IgG concentration and assessing colostrum quality.
Objectives
To determine the impact of heat‐treatment on accuracy of IR spectroscopy and Brix refractometers for measuring colostral IgG concentration and assessing colostrum quality before and after heat‐treatment.
Animals
A total of 60 Holstein dairy cows on 8 commercial dairy farms.
Methods
A cross‐sectional study was designed to determine the effect of heat‐treatment at 60°C and 63°C each for 30 and 60 minutes duration on colostral IgG concentration measured by the reference radial immunodiffusion (RID) assay, IR spectroscopy, and digital and optical refractometers.
Results
Colostrum IgG concentration significantly decreased after heat‐treatment at 63°C for 30 or 60 minutes as measured by RID, but the IgG values remained unchanged when measured by IR spectroscopy and refractometers. The lowest correlation coefficient found between IR spectroscopy (r = 0.70) and RID results was in colostrum heat‐treated at 63°C for 60 minutes. For digital (r = 0.48) and optical (r = 0.50) refractometers, the lowest correlation coefficient was at 63°C for 30 minutes when compared to RID. The accuracy of the IR spectroscopy, digital and optical Brix refractometers was decreased from 91.7 to 80%, 81.7 to 45%, and 80 to 45%, respectively, when colostrum heat‐treated at 63°C for 60 minutes.
Conclusions and Clinical Importance
Radial immunodiffusion, IR spectroscopy, and Brix refractometers exhibit utility for measuring IgG concentration when colostrum heat‐treated at 60°C but does not detect decrease IgG concentrations when heat‐treated at 63°C.
Keywords: Colostrum quality, Dairy, Pasteurization, Radial immunodiffusion assay
Abbreviations
- HT
heat‐treatment
- IgG
immunoglobulin G
- IR
infrared
- RID
radial immunodiffusion
- Se
sensitivity
- Sp
specificity
- UPEI
University of Prince Edward Island
Colostrum management is critical in a successful calf rearing program1 and is the main source of nutrients and immunoglobulins, for the newborn calf.2 Failure of transfer of passive colostral immunoglobulin G (IgG) to newborn calves is associated with increased morbidity and mortality.3, 4, 5, 6 Concentration of colostral IgG affects acquisition of passive immunity, thus an accurate assessment of colostrum IgG is essential to achieve adequate transfer of passive immunity to calves.
Historically, radial immunodiffusion (RID) assay has been the gold standard, direct, quantitative method for measuring colostral IgG concentration and assessing colostrum quality.7, 8 Recent studies have reported measuring colostral IgG concentration by ELISA9, 10; midinfrared spectroscopy11, 12; and near‐infrared spectroscopy13 techniques. Other indirect methods have been developed through correlating IgG concentration to specific gravity14, 15 and refractive index.16, 17
Heat‐treatment of colostrum is a method developed to reduce calf exposure to pathogens.18, 19 The optimal temperature and timing for heat‐treatment of bovine colostrum that could be used with no important changes in viscosity, IgG concentration, and relevant reduction in bacterial count are 60°C for 30 or 60 minutes.20 Several studies have reported the effect of heat‐treatment on accuracy of the reference RID assay for measuring colostral IgG concentration.10, 21, 22 Pasteurization of colostrum at 60°C for 60 minutes23, 24 or 120 minutes22, 25 had no effect on colostral IgG. However, when colostrum was heat‐treated at 63°C for 30 minutes18, 20 or at 72°C for 15 seconds,23 there was a relevant decline in colostral IgG level. Only one study has reported the effect of heat‐treatment on accuracy of colostral IgG concentration measured by ELISA.10 To the authors’ knowledge, the effect of heat‐treatment on accuracy of colostral IgG concentration measured by infrared (IR) spectroscopy and Brix refractometers has not been assessed.
We hypothesized that heat‐treatment of bovine colostrum at improper temperature and timing will affect accuracy of IR spectroscopy and Brix refractometers for measuring IgG content. Therefore, the primary aim of this study was to evaluate if heat‐treatment of bovine colostrum affects the diagnostic performance of IR spectroscopy and digital and optical Brix refractometers methods for assessing colostral IgG. There were 3 objectives for this aim: (1) determine the IgG concentration of untreated and heat‐treated colostrum samples by the RID assay, IR spectroscopy, and digital and optical Brix refractometers; (2) determine the baseline diagnostic performance of IR spectroscopy and digital and optical Brix refractometers in predicting unheated and heat‐treated colostral IgG concentrations when compared to the RID‐IgG reference method; and (3) evaluate the agreement between the reference RID assay, IR spectroscopy, and digital and optical Brix refractometers for the assessment of unheated and heat‐treated colostrum quality.
Materials and Methods
Colostrum Samples
This study was conducted in accordance with the Canadian Council on Animal Care (CCAC) guidelines26 under a protocol approved by the Animal Care Committee at University of Prince Edward Island (UPEI). First milk colostrum from 60 Holstein dairy cows on 8 commercial dairy farms in New Brunswick, Canada was collected between April and September 2015. It was requested that farm personnel collect colostrum within 1 hour after calving in a vial labeled with the farm name, cow identification number, and date of collection. Samples were stored at −20°C until transportation to the Maritime Quality Milk Laboratory, UPEI. All samples arrived frozen and were placed at −20°C for later analysis.
Heat‐treatment of Colostrum
Colostrum samples were kept at room temperature (20–24°C) for 2 hours to thaw and then mixed thoroughly by inverting the tubes by hand. Five 10‐mL aliquots were prepared from thoroughly mixed colostrum from each sample. One aliquot was kept at room temperature as an unheated control for baseline IgG analysis. The other 4 aliquots were subjected to 1 of 4 heat‐treatment methods. The heat‐treatments were performed in a water bath with agitation at the following 4 temperature‐time conditions: 60°C for 30 minutes (HT1), 60°C for 60 minutes (HT2), 63°C for 30 minutes (HT3), and 63°C for 60 minutes (HT4). Water bath temperature and temperature of colostrum samples were monitored continuously during the heat‐treatment. At the end of the pasteurization time, all samples were immediately cooled in an ice bath until the sample temperature was 20°C.
RID Analysis
Unheated and heat‐treated colostrum aliquots were mixed by vortex before RID analysis. Samples were diluted (1:3) with deionized sterile water and mixed by vortexing for 10 seconds. After dilution, a commercial bovine IgG RID kit1 was used as the reference method for measuring colostral IgG concentrations. Five μL of diluted colostrum was added in each well on the RID plate and tested alongside the manufacturer's standards. The RID plates were incubated at room temperature for 24 hours, and the diameter of the precipitating ring was measured with a handheld caliper. The assay standards were used to build a linear calibration curve that was used to determine the IgG concentration for each colostrum samples. Samples with IgG concentration greater than that of the highest standard (27.48 g/L) were further diluted and reanalyzed. Samples with IgG concentration smaller than that of the lowest standard (1.96 g/L) were retested in an undiluted form. Each of the assay standards and colostrum samples were tested in duplicate. The final IgG concentration for each aliquot sample was determined by calculating the average of the 2 replicates. Coefficient of determination of the standards calibration curve was ≥0.97.
IR Analysis
Infrared spectra were collected from the unheated and heat‐treated colostrum aliquot samples with Tensor 37 Fourier transform infrared (FTIR) spectrometer2 equipped with a deuterium tryglycine sulfate detector and controlled by proprietary software.3 Aliquot samples were diluted (1:3) with deionized sterile water and vortexed for 10 seconds. Each diluted aliquot was analyzed by evenly spreading 5 μL of it onto a 5 mm diameter well within an adhesive‐masked, 96‐well silicon microplate.27 All samples were tested in a replicate of 6. The loaded microplates were allowed to dry at room temperature (20–24°C) for 2 hours and then inserted into HTS‐XT autosampler.2 All spectra were averaged over 512 scans at a resolution of 4 cm−1 and corrected for background absorbance by subtraction of the spectrum of the empty well. Collected spectra were converted into a printable format (PRN) in GRAMS software.4 A previously developed PLS model built for the prediction of bovine colostral IgG concentrations by IR spectra11 was used to predict colostral IgG concentrations by MATLAB software.5 The IgG concentration was predicted from each spectrum, and subsequently, the IgG concentration for each colostrum sample was calculated as the average of the 6 replicate values.
Refractometers Readings
Approximately, 100 μL of unheated and heat‐treated colostrum aliquots was tested with digital6 and optical7 Brix refractometers. Before each analysis, the digital and optical refractometers were cleaned and calibrated with distilled water at room temperature then the Brix scores for each sample were recorded. The Brix scores were determined first by the optical refractometer to avoid any bias in the results by the technician. Each sample was read once.
Statistical Analysis
The statistical analysis was carried out by Stata software8 and statistical significance was at a P‐value ≤0.05. Descriptive statistics for RID, IR spectroscopy, digital and optical Brix refractometers were calculated for untreated and heat‐treated colostrum. The effect of heat‐treatment on colostrum IgG concentration measured by RID, IR spectroscopy, and digital and optical refractometers was analyzed by Kruskal‐Wallis one‐way ANOVA tests. Spearman correlation coefficients were calculated to determine the relationship between IgG concentration measured by the reference RID assay and IgG predicated by the IR spectroscopy or the Brix scores measured by the digital and optical refractometers across the unheated and heat‐treated samples.
Epidemiological diagnostic test characteristics (sensitivity, specificity, and accuracy) were calculated using recommended cut‐points 50 g/L for IR spectroscopy11 and 22%Brix for digital and optical refractometers.28, 29 Sensitivity (Se) was defined as the proportion of good quality samples that are correctly identified, and specificity (Sp) was defined as the proportion of poor quality samples that are correctly identified. Accuracy was defined as the proportion of colostrum samples that were correctly classified. Cohen's kappa statistic was calculated for the IR spectroscopy and digital and optical refractometers compared with the reference RID assay for assessing the quality of unheated and heat‐treated colostrum.
Results
Effect of Heat‐treatment on Colostral IgG
The mean RID‐IgG concentration of unheated colostrum was 45.6 g/L. The mean RID‐IgG concentrations of heat‐treated colostrum ranged from 30 to 48 g/L. The mean RID‐IgG concentration was not different between the unheated and colostrum heated at 60°C, regardless of the time. However, when colostrum was heated at 63°C for 30 or 60 minutes, the RID‐IgG concentration decline to 31.1 and 30 g/L, respectively. The mean IR‐IgG concentration of unheated colostrum was 44.7 g/L. However, the average IR‐IgG concentration of heat‐treated colostrum ranged from 37.7 to 42.5 g/L. There were no differences in mean IgG concentrations measured by IR spectroscopy between unheated and heat‐treated colostrum regardless of temperature and time. Mean Brix scores of unheated colostrum measured by digital and optical Brix refractometers were 24 and 23.5% Brix, respectively. The Brix scores of the heat‐treated colostrum measured by digital refractometer were ranged from 21.7 to 23.9% Brix, while for optical refractometer was ranged from 21.3 to 23.7% Brix. There were no differences in Brix scores measured by the digital and optical refractometers between unheated and heat‐treated colostrum regardless of temperature and timing.
Correlation Coefficients
Correlation plots for IgG concentration measured by the IR spectroscopy and RID assay are shown for colostrum samples before and after heat‐treatments in Figure 1. The IgG values for the same samples measured by IR spectroscopy and RID assay were more closely correlated (r = 0.88) in unheated colostrum and decline from 0.85 to 0.70 with increase in heating temperature of colostrum from 60 to 63°C. Correlation plots for the Brix scores determined by both the digital and optical refractometers and the IgG values measured by RID assay are shown for colostrum before and after heat‐treatments in Figure 2. Brix scores from digital and optical refractometers were most closely correlated to the RID‐IgG concentration in unheated colostrum (r = 0.74 and 0.73, respectively) and heat‐treated colostrum at 60°C for 30 minutes (r = 0.75 and 0.73, respectively) and 60 minutes (r = 0.71 and 0.70, respectively). However, when colostrum heat‐treated at 63°C for 30 or 60 minutes, the correlation coefficients of digital (r = 0.48 and 0.58, respectively) and optical (r = 0.50 and 0.57, respectively) refractometers substantially decline (Fig 2).
Figure 1.
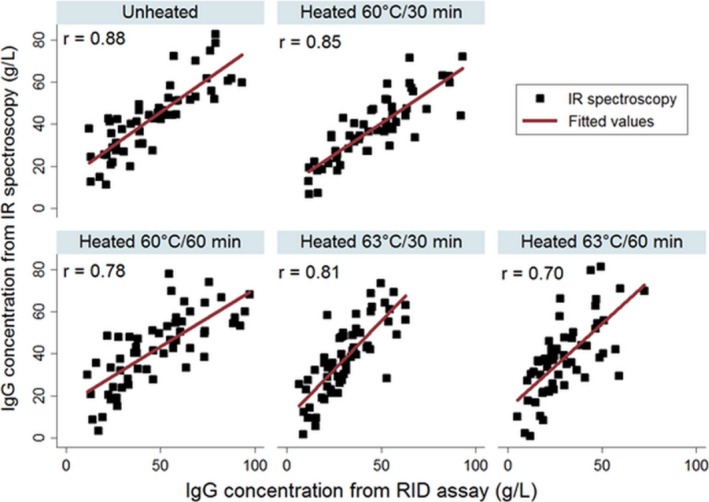
Correlation plots of IgG concentration measured by radial immunodiffusion (RID) assay and infrared (IR) spectroscopy in colostrum samples (n = 60) before and after heat‐treatment.
Figure 2.
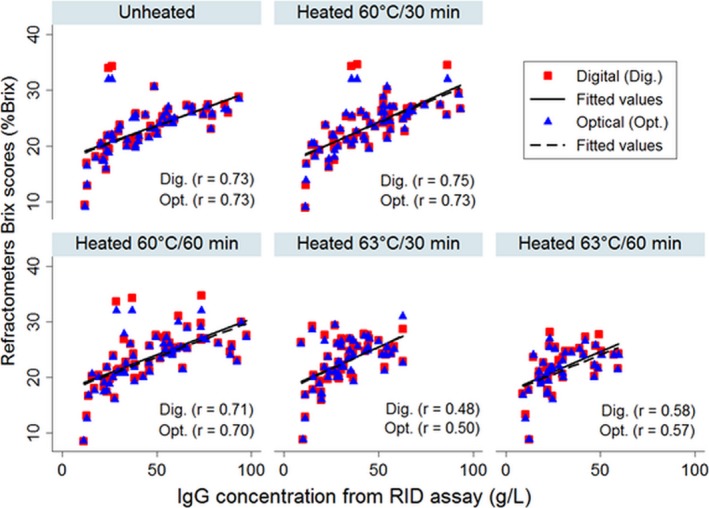
Correlation plots of IgG concentration measured by radial immunodiffusion (RID) assay and Brix scores obtained by both digital and optical refractometers in unheated and heat‐treated colostrum (n = 60).
Diagnostic Test Characteristics
The test characteristics of the IR spectroscopy and Brix refractometers for assessing the quality of unheated and heat‐treated colostrum using previously recommended cut‐off values (50 g/L and 22% Brix, respectively) are presented in Table 1.
Table 1.
Diagnostic accuracy of the infrared (IR) spectroscopy, digital and optical Brix refractometers using previously recommended cut‐points for assessing of colostrum quality compared with IgG measured by radial immunodiffusion (RID) assay
| Method | Test Characteristics (%)a | RID High/Lowb | Test High/Lowc | |||
|---|---|---|---|---|---|---|
| Se | Sp | Accuracy | κ | |||
| Infrared spectroscopy (cut‐point = 50 g/L) | ||||||
| Unheated | 82.1 | 100 | 91.7 | 0.82 | 28/32 | 23/37 |
| HT1 | 51.7 | 100 | 76.7 | 0.50 | 29/31 | 15/45 |
| HT2 | 72.4 | 96.8 | 85 | 0.68 | 29/31 | 22/38 |
| HT3 | 80 | 84 | 83.3 | 0.45 | 10/50 | 16/44 |
| HT4 | 62.5 | 82.7 | 80 | 0.23 | 8/52 | 14/46 |
| Digital refractometer (cut‐point = 22% Brix) | ||||||
| Unheated | 100 | 65.6 | 81.7 | 0.63 | 28/32 | 39/21 |
| HT1 | 96.6 | 61.3 | 78.3 | 0.56 | 29/31 | 40/20 |
| HT2 | 96.6 | 64.5 | 80 | 0.59 | 29/31 | 39/21 |
| HT3 | 90 | 38 | 46.7 | 0.09 | 10/50 | 40/20 |
| HT4 | 87.5 | 38.5 | 45 | 0.07 | 8/52 | 39/21 |
| Optical refractometer (cut‐point = 22% Brix) | ||||||
| Unheated | 100 | 62.5 | 80 | 0.60 | 28/32 | 40/20 |
| HT1 | 96.6 | 64.5 | 80 | 0.59 | 29/31 | 39/21 |
| HT2 | 96.6 | 67.7 | 81.7 | 0.63 | 29/31 | 38/22 |
| HT3 | 90 | 38 | 46.7 | 0.09 | 10/50 | 40/20 |
| HT4 | 87.5 | 38.5 | 45 | 0.07 | 8/52 | 39/21 |
HT1, heat‐treatment at 60°C/30 minutes; HT2, heat‐treatment at 60°C/60 minutes; HT3, heat‐treatment at 63°C/30 minutes; HT4, heat‐treatment at 63°C/60 minutes.
Se = sensitivity; Sp = specificity; Accuracy = percentage of correctly classified samples; κ = Cohen's kappa values.
RID high/low = number of samples declared high (IgG ≥50g/L) or low (IgG <50 g/L) by RID assay.
Test high/low = number of samples declared high (IgG ≥50g/L) or low (IgG <50 g/L) by each assay.
Discussion
In our study, optimal heat‐treatment of colostrum at 60°C for 30 or 60 minutes resulted in no differences in IgG concentrations measured by RID, and predicted by IR spectroscopy, digital and optical refractometers compared to unheated colostrum. Similar results were previously reported when colostrum heat‐treated at 60°C for 30 or 60 minutes and IgG concentration measured by RID,23 ELISA,10, 20 and turbidimetric immunoassay.25 However, increasing heating temperature in this study to 63°C for 30 or 60 minutes, resulted in reduction in RID‐IgG concentration by 27 and 29%, respectively, compared to the unheated colostrum. Previous studies showed that heat‐treatment of 5‐mL colostrum to 63°C for 30 minutes reduced RID‐IgG concentration by 12.3%.21 Further, on‐farm commercial batch pasteurization (63°C for 30 minutes) reduced RID‐IgG concentration by 58.5 and 23.6% for 95‐L and 57‐L batches, respectively.18 In another study, colostrum was heat‐treated at 63°C for 120 minutes and a reduction of 34% in IgG concentration measured by turbidimetric immunoassay was reported.25 The reduction in IgG concentration measured by immunoassays in colostrum heat‐treated at 63°C could be attributed to denaturation of colostral immunoglobulins by heat‐treatment, which results in an initial reversible unfolding of native structure with loss of globular configuration which then proceeds further to irreversible denaturation because of hydrophobic and disulfide interactions.30 At 60°C, some unfolding of structure might occur, but this unfolding is reversible and native structure can be regained.31, 32
Our results did not detect differences in IgG concentrations predicted by IR spectroscopy and Brix refractometers in unheated and heat‐treated colostrum. These methods predict total IgG concentrations regardless of heat damage to IgG versus functional IgG concentration, as detected by the RID method.10 This is consistent with other research that showed that IR spectroscopy is insensitive to denaturation of total protein.33, 34
The correlation between unheated colostral IgG concentrations (r = 0.88) measured by RID and predicted by IR spectroscopy was similar to the 0.85 previously reported12 and was lower than the 0.97 reported in another study.13 The correlation coefficients of 0.74 and 0.73 between RID‐IgG concentration and Brix scores measured by the digital and optical refractometers, respectively, for unheated colostrum were similar as reported by several studies28, 29, 35 and higher than some previous studies.17, 36 In heat‐treated colostrum, the correlation between results from IR spectroscopy and RID was relatively lower than that in unheated colostrum. However, the Brix scores from both digital and optical refractometers were more highly correlated in colostrum heated at 60°C than that heated at 63°C, regardless of time. Although the correlation between results derived from IR spectroscopy, Brix refractometers, and RID assay for heat‐treated colostrum was relatively lower than that of unheated colostrum, it was stronger than the correlation coefficient (0.12) reported previously between RID and ELISA for heat‐treated (60°C for 30 minutes) colostrum.10
Measurement of colostral IgG concentration can be very useful in assessing colostrum quality.1 In dairy cows, high‐quality colostrum is widely considered to contain IgG concentration ≥50 g/L as measured by RID.1 Diagnostic test characteristics of the IR spectroscopy and Brix refractometers were calculated across all the unheated and heat‐treated colostrum using the recommended cut‐point of 50 g/L11 and 22%Brix,28, 29 respectively.
For the IR spectroscopy, the cut‐point of 50 g/L provided strong specificity and moderate sensitivity values across the unheated and heat‐treated colostrum (Table 1). The accuracy of the IR spectroscopy (91.7%) to differentiate between unheated poor and good quality colostrum was higher than that reported in previous studies.11, 12, 37 However, the accuracy of the IR instrument to correctly determine quality of heat‐treated colostrum was lower with more samples with poor IgG levels categorized as adequate. For Brix refractometers, the cut‐point 22% Brix showed strong sensitivity and moderate specificity values across the unheated and heat‐treated colostrum. However, both refractometers showed the lowest diagnostic characteristics with more samples with high IgG levels categorized as poor quality when colostrum improper heated at 63°C for 30 or 60 minutes (Table 1).
The IR spectroscopy and digital and optical Brix refractometers had a high‐to‐moderate agreement with the reference RID assay for assessing the quality of unheated colostrum and colostrum heat‐treated at 60°C, which is similar to a previously report by the authors for unheated colostrum.37 However, when colostrum heat‐treated at 63°C, there was a poor agreement between the 3 methods and RID assay (Table 1).
In conclusion, data from our study confirm that heat‐treatment of colostrum at 60°C for 30 or 60 minutes did not affect the IgG concentration measured by RID, IR spectroscopy, and Brix refractometers. Improper heat‐treatment of colostrum at 63°C for 30 or 60 minutes results in inaccurate functional IgG concentration values by IR spectroscopy and Brix refractometers analysis. Studying the effect of on‐farm batch pasteurization on diagnostic accuracy of IR spectroscopy and Brix refractometers compared to RID‐IgG values is warranted.
Acknowledgments
The authors thank participating dairy farmers and veterinarians, as well as Natasha Robinson and Cynthia Mitchell for their technical assistance and data collection. The authors also thank William Chalmers (Department of Health Management, Atlantic Veterinary College) for editorial assistance in preparation of the manuscript. This research was funded by Milk 2020 and the Atlantic Canada Opportunities Agency.
Conflict of Interest Declaration
Authors declare no conflict of interest.
Off‐label Antimicrobial Declaration
Authors declare no off‐label use of antimicrobials.
This study was performed at Maritime Quality Milk Laboratory, Atlantic Veterinary College, University of Prince Edward Island, Charlottetown, Canada.
Footnotes
Bovine IgG RID Kit, Triple J Farms; Bellingham, WA, USA
Bruker Optics, Milton, ON, Canada
OPUS ver. 6.5, Bruker Optics, Milton, ON, Canada
Thermo Fisher Scientific Inc, Waltham, MA, USA
MathWorks R2016a, Natick, MA, USA
PAL‐1 digital Brix refractometer, Atago Co. Ltd; WA, USA
Westover RHC‐200ATC handheld refractometer, Woodinville, WA, USA
Stata, version 14; StataCorp, LP, College Station, TX
References
- 1. Godden S. Colostrum management for dairy calves. Vet Clin North Am Food Anim Pract 2008;24:19–39. [DOI] [PMC free article] [PubMed] [Google Scholar]
- 2. Davis CL, Drackley JK. The Development, Nutrition, and Management of the Young Calf. Ames, IA: Iowa State University Press; 1998: 179–206. [Google Scholar]
- 3. Boyd J. The relationship between serum immune globulin deficiency and disease in calves: A farm survey. Vet Rec 1972;90:645–649. [DOI] [PubMed] [Google Scholar]
- 4. McEwan A, Fisher E, Selman I. Observations on the immune globulin levels of neonatal calves and their relationship to disease. J Comp Pathol 1970;80:259–265. [DOI] [PubMed] [Google Scholar]
- 5. McGuire TC, Pfeiffer NE, Weikel JM, Bartsch RC. Failure of colostral immunoglobulin transfer in calves dying from infectious disease. J Am Vet Med Assoc 1976;169:713–718. [PubMed] [Google Scholar]
- 6. Tyler JW, Steevens BJ, Hostetler DE, et al. Colostral immunoglobulin concentrations in Holstein and Guernsey cows. Am J Vet Res 1999;60:1136–1139. [PubMed] [Google Scholar]
- 7. McBeath DG, Penhale WJ, Logan EF. An examination of the influence of husbandry on the plasma immunoglobulin level of the newborn calf, using a rapid refractometer test for assessing immunoglobulin content. Vet Rec 1971;88:266–270. [DOI] [PubMed] [Google Scholar]
- 8. Oyeniyi O, Hunter A. Colostral constituents including immunoglobulins in the first three milkings postpartum. J Dairy Sci 1978;61:44–48. [DOI] [PubMed] [Google Scholar]
- 9. Baumrucker CR, Stark A, Wellnitz O, et al. Short Communication: Immunoglobulin variation in quarter‐milked colostrum. J Dairy Sci 2014;97:3700–3706. [DOI] [PubMed] [Google Scholar]
- 10. Gelsinger S, Smith A, Jones C, Heinrichs A. Technical Note: Comparison of radial immunodiffusion and ELISA for quantification of bovine immunoglobulin G in colostrum and plasma. J Dairy Sci 2015;98:4084–4089. [DOI] [PubMed] [Google Scholar]
- 11. Elsohaby I, McClure JT, Hou S, et al. A novel method for the quantification of bovine colostral immunoglobulin G using infrared spectroscopy. Int Dairy J 2016;52:35–41. [Google Scholar]
- 12. Løkke MM, Engelbrecht R, Wiking L. Covariance structures of fat and protein influence the estimation of igg in bovine colostrum. J Dairy Res 2016;83:58–66. [DOI] [PubMed] [Google Scholar]
- 13. Rivero MJ, Valderrama X, Haines D, Alomar D. Prediction of immunoglobulin G content in bovine colostrum by near‐infrared spectroscopy. J Dairy Sci 2012;95:1410–1418. [DOI] [PubMed] [Google Scholar]
- 14. Fleenor W, Stott G. Hydrometer test for estimation of immunoglobulin concentration in bovine colostrum. J Dairy Sci 1980;63:973–977. [DOI] [PubMed] [Google Scholar]
- 15. Pritchett LC, Gay CC, Besser TE, Hancock DD. Management and production factors influencing immunoglobulin G1 concentration in colostrum from Holstein cows. J Dairy Sci 1991;74:2336–2341. [DOI] [PubMed] [Google Scholar]
- 16. Bartens M, Drillich M, Rychli K, et al. Assessment of different methods to estimate bovine colostrum quality on farm. N Z Vet J 2016;64:263–267. [DOI] [PubMed] [Google Scholar]
- 17. Bartier AL, Windeyer MC, Doepel L. Evaluation of on‐farm tools for colostrum quality measurement. J Dairy Sci 2015;98:1878–1884. [DOI] [PubMed] [Google Scholar]
- 18. Godden S, Smith S, Feirtag J, et al. Effect of on‐farm commercial batch pasteurization of colostrum on colostrum and serum immunoglobulin concentrations in dairy calves. J Dairy Sci 2003;86:1503–1512. [DOI] [PubMed] [Google Scholar]
- 19. Green L, Godden S, Feirtag J. Effect of batch and high temperature‐short time pasteurization on immunoglobulin G concentrations in colostrum. J Dairy Sci 2003;86:246. [DOI] [PubMed] [Google Scholar]
- 20. Elizondo‐Salazar J, Jayarao B, Heinrichs A. Effect of heat treatment of bovine colostrum on bacterial counts, viscosity, and immunoglobulin G concentration. J Dairy Sci 2010;93:961–967. [DOI] [PubMed] [Google Scholar]
- 21. Meylan M, Rings DM, Shulaw WP, et al. Survival of Mycobacterium Paratuberculosis and preservation of immunoglobulin G in bovine colostrum under experimental conditions simulating pasteurization. Am J Vet Res 1996;57:1580–1585. [PubMed] [Google Scholar]
- 22. Godden S, McMartin S, Feirtag J, et al. Heat‐treatment of bovine colostrum. II: Effects of heating duration on pathogen viability and immunoglobulin G. J Dairy Sci 2006;89:3476–3483. [DOI] [PubMed] [Google Scholar]
- 23. El‐Fattah AMA, Rabo FHRA, El‐Dieb SM, et al. Preservation methods of buffalo and bovine colostrum as a source of bioactive components. Int Dairy J 2014;39:24–27. [Google Scholar]
- 24. Johnson J, Godden S, Molitor T, et al. Effects of feeding heat‐treated colostrum on passive transfer of immune and nutritional parameters in neonatal dairy calves. J Dairy Sci 2007;90:5189–5198. [DOI] [PubMed] [Google Scholar]
- 25. McMartin S, Godden S, Metzger L, et al. Heat treatment of bovine colostrum. I: Effects of temperature on viscosity and immunoglobulin G level. J Dairy Sci 2006;89:2110–2118. [DOI] [PubMed] [Google Scholar]
- 26. Care, Canadian Council on Animal . The Care and use of Farm Animals in Research, Teaching and Testing. Ottawa, ON: CCAC; 2009:12–15. [Google Scholar]
- 27. Riley CB, McClure JT, Low‐Ying S, Shaw RA. Use of Fourier‐transform infrared spectroscopy for the diagnosis of failure of transfer of passive immunity and measurement of immunoglobulin concentrations in horses. J Vet Intern Med 2007;21:828–834. [DOI] [PubMed] [Google Scholar]
- 28. Bielmann V, Gillan J, Perkins NR, et al. An evaluation of Brix refractometry instruments for measurement of colostrum quality in dairy cattle. J Dairy Sci 2010;93:3713–3721. [DOI] [PubMed] [Google Scholar]
- 29. Quigley J, Lago A, Chapman C, et al. Evaluation of the Brix refractometer to estimate immunoglobulin G concentration in bovine colostrum. J Dairy Sci 2013;96:1148–1155. [DOI] [PubMed] [Google Scholar]
- 30. Indyk HE, Williams JW, Patel HA. Analysis of denaturation of bovine IgG by heat and high pressure using an optical biosensor. Int Dairy J 2008;18:359–366. [Google Scholar]
- 31. Goto Y, Hamaguchi K. Unfolding and refolding of the constant fragment of the immunoglobulin light chain. J Mol Biol 1982;156:891–910. [DOI] [PubMed] [Google Scholar]
- 32. Price NC. Conformational issues in the characterization of proteins. Biotechnol Appl Biochem 2000;31:29–40. [DOI] [PubMed] [Google Scholar]
- 33. Rubio‐Diaz DE, Rodriguez‐Saona LE. Application of vibrational spectroscopy for the study of heat‐induced changes in food components. Handbook of Vibrational Spectroscopy. Chichester: John Wiley and Sons Ltd; 2010:213–236. [Google Scholar]
- 34. Sørensen LK, Lund M, Juul B. Accuracy of Fourier transform infrared spectrometry in determination of casein in dairy cows’ milk. J Dairy Res 2003;70:445–452. [DOI] [PubMed] [Google Scholar]
- 35. Morrill K, Conrad E, Polo J, et al. Estimate of colostral immunoglobulin G concentration using refractometry without or with caprylic acid fractionation. J Dairy Sci 2012;95:3987–3996. [DOI] [PubMed] [Google Scholar]
- 36. Chigerwe M, Tyler JW, Middleton JR, et al. Comparison of four methods to assess colostral IgG concentration in dairy cows. J Am Vet Med Assoc 2008;233:761–766. [DOI] [PubMed] [Google Scholar]
- 37. Elsohaby I, McClure JT, Cameron M, et al. Rapid assessment of bovine colostrum quality: How reliable are transmission infrared spectroscopy and digital and optical refractometers? J Dairy Sci 2017;100:1427–1435. [DOI] [PubMed] [Google Scholar]