

Abstract
Background
The downer cow syndrome (DCS) is a challenging health issue in the dairy industry. No cow‐side test is available to provide an accurate prognosis for DCS cases in farm settings.
Hypothesis/Objectives
Local or systemic hypoperfusion and myocardial lesions lead to an increase in blood concentration of biomarkers cardiac troponin I (cTnI) and L‐lactate. The objective was to determine the prognostic values of these biomarkers assessed cow‐sides in addition to clinical examinations in prognostication of a negative outcome (NO: death or euthanasia within 7 days).
Animals
218 client‐owned dairy cows affected by DCS.
Methods
In a prospective study, animals were monitored for 60 days after inclusion of each cow. Blood cTnI and L‐lactate concentrations were measured on the day of inclusion. The prognostic accuracy of both biomarkers and physical examination variables was estimated to predict NO. A mixed multivariable logistic regression model was used for data analysis.
Results
Prevalence of NO in this study was 63% on day 7. Troponin concentrations greater than 0.7 ng/mL had sensitivity and specificity of 54.1% (95% CI: 45.3–62.7%) and 78.4% (95% CI: 67.3–87.1%), respectively, for predicting NO. Blood L‐lactate was not associated with the outcome. The multivariable model revealed that heart rate >100 bpm (OR; 95% CI: 3.7; 1.3–10.2) and cTnI > 0.7 ng/mL (OR; 95% CI: 5.5; 2.1–14.6) were associated with the risk of NO.
Conclusions and Clinical Importance
Hypertroponinemia and tachycardia were associated with reduced survival in DCS cases. The use of cow‐side blood cTnI concentrations and heart rate could help to rapidly identify cows in farm setting that have poor chances of recovery and would benefit from a more aggressive treatment or euthanasia.
Keywords: Biomarker, Point of care
Abbreviations
- CRT
capillary refill time
- cTnI
cardiac troponin I
- d30
day 30
- d60
day 60
- d7
day 7
- DCS
downer cow syndrome
- DIM
days in milk
- HR
heart rate
- LAC
L‐lactatemia
- LSM
least squares means
- MS
musculoskeletal
- NO
negative outcome
- OR
odds ratio
- POC
point of care
- PO
positive outcome
- RR
respiratory rate
- SEM
standard error means
- Se
sensitivity
- SE
standard error
- Sp
specificity
The downer cow syndrome (DCS) is a common problem in North American dairy farms.1 There are many definitions of DCS, but it is commonly accepted as being an alert cow unable or unwilling to stand up for 12 hours or more.2, 3 Other definitions include all nonambulatory cattle (alert or nonalert) unable to stand for any duration of time without assistance.1, 4 The DCS episode frequently occurs within 24 hours of calving in dairy cows.5, 6 Highly productive cows and older cows are at greater risk of DCS.3, 7, 8 Clinical hypocalcemia, stillbirth, and dystocia were all identified as risk factors for DCS in dairy cattle in the first 30 days after parturition.6
Information on DCS occurrence and its prognosis in dairy farms is scant. According to a review by the National Agricultural Statistical Services data, 1.2% of US dairy cattle weighting over 227 kg (500 lbs) were affected by an episode of recumbency of any duration of time in 2004.1 A total of 78.2% of American dairy farms surveyed by the National Animal Health Monitoring System had one or more cases of DCS in 2004.1 In one Israeli on‐farm study of 262 downer dairy cows, 69% of cows died or were already slaughtered by the second day of recumbency. A survey of Minnesota dairy farmers, which defined DCS as a cow in sternal recumbency for more than 24 hours, reported that 33% of the affected cows recovered, 23% were slaughtered, and 44% died.7 In a national US survey, the recovery probability was estimated to be 10.1% in 1st lactating cows, 17.7% in cows in lactation 2 to 4, and 22.2% in cows with 5 or more lactations.1 As the condition appears to have a poor prognosis when managed on farms, concerns about animal welfare9 arise. Clinicians and producers need to take a rapid decision about the future of the animal, which implies being more aggressive in treatment or avoiding any additional suffering or other expenses in compromised animals.2, 9, 10, 11, 12
All recumbent cattle are susceptible to muscular pressure damage regardless of the initial cause of recumbency.13 Experimental studies have suggested that significant pressure damage can occur in the compressed upper limb as early as 6 hours after the initiation of decubitus.13 Muscular and nerve damages might therefore occur.5 Besides specific lesions associated with the primary cause of DCS, heart lesions occur in cows with unresponsive hypocalcemia14 as well as in DCS with various diagnoses.15 Among prognostic indicators, creatinine kinase and aspartate aminotransferase16 activity in blood are useful for predicting chances of recovery.17 However, these laboratory tests cannot be performed cow‐side, and it can take up to 24 hours to obtain the results in private veterinary practice.
Presence of local or systemic hypoperfusion13 and myocardial lesions14, 15 in case of DCS could potentially lead to an increase in blood concentrations of markers of hypoperfusion, such as L‐lactate (LAC) and cardiac biomarkers, such as cardiac troponin I (cTnI). The cTnI was increased in some extracardiac diseases of cattle, and the highest values were obtained with DCS cases.18 Dosage of LAC was already evaluated as a predictor of survival in cattle affected by various diseases19, 20, 21 but has not been studied per se in DCS. Our hypothesis was that increased LAC and cTnI concentrations are associated with a negative outcome in DCS. As cTnI and LAC blood concentrations can be determined using validated cow‐side portative units, the objective of this study was to determine the value of cTnI and LAC added to physical examination when predicting a negative outcome (NO) in dairy cows affected by DCS in farm settings.
Materials and Methods
Population
The study protocol was accepted by the Ethical Committee of the Faculté de Médecine Vétérinaire, Université de Montréal (project number Rech‐1606). A prospective cohort study was conducted between July 2011 and September 2013. Five dairy veterinary practices located in the province of Québec, Canada, participated in data collection. The required sample size was calculated using the negative outcome probability (comparison of proportion between 2 groups). A sample size of 200 cows was estimated considering case fatality rates of 5% vs 25% (for a companion study on acute mastitis) or 95% vs 75% for this specific study, in regards of the normo‐ and hyperlactatemia groups, respectively (alpha level: 5%; beta level: 10%). A 10% loss was also anticipated at follow‐up. The same estimation was used for cTnI and downer cow study as there were no specific data available on the expected negative outcome in Eastern Canada. Therefore, a total of 220 dairy cows affected by DCS were targeted to be enrolled based on the following inclusion criteria: (1) a downer cow on its second veterinary consultation that did not rise after a first intravenous calcium treatment or (2) a cow obviously down for another reason than hypocalcemia (e.g. obvious musculoskeletal injury, acute mastitis, or primiparous). The goal of this particular definition was to exclude any first presentation of noncomplicated milk fever from our final population, as this condition differs from DCS. No distinction was made between alert and nonalert cows. Every included animal was examined by a standard examination protocol which included breed, parity, days in milk (DIM), time spent down before inclusion in the study (hours), mental status, rectal temperature, heart rate (HR), respiratory rate, capillary refill time, clinically estimated dehydration, rumen motility (over a 2 min period) and contraction strength (complete or incomplete), and feces quantity and quality. The clinician involved in the case was also asked to assign each case to one of six categories: acute mastitis, metabolic problem, neurologic or musculoskeletal problem, shock, unknown, or other. There could be multiple diagnoses. Blood samples were obtaineda from coccygeal vessel or jugular vein to perform a complete chemistry panel. However, data from the chemistry panel were not studied as potential prognostic factors as it was out of the scope of this study. Although there could be a slight difference in LAC depending on the site of puncture, this difference has been previously determined as not clinically relevant when used in human emergency department for patients with various clinical conditions.22
Cardiac Troponin I Measurement
A blood sample collected in a lithium‐heparin tubeb was used to quantify blood cTnI.c Use of bovine whole blood with this analyzer has been validated.18, 23, 24 This portable immunoassay analyzer uses a two‐site ELISA monoclonal antibody (caprine, murine) directed toward human cTnI. A silicon chip is partly covered by electrochemical sensors with antibodies specific to cTnI. An antibody/alkaline phosphatase enzyme conjugate specific to a portion of cTnI is also present on the chip. Once whole blood is in contact with the cartridge, the enzyme conjugate dissolves. The cTnI is then labeled by alkaline phosphatase. This new molecular complex is caught on the electrochemical sensors. After an incubation time of 7 minutes, the sample and excess enzyme conjugate are washed off the sensors. A substrate for alkaline phosphatase enzyme is present in the wash fluid. The substrate is cleaved by the bounding of the enzyme to an antibody‐antigen‐antibody sandwich. The resulting current is measured amperometrically and is directly proportional to the cTnI concentration of the sample. The analyzer displays a result within 10 minutes. The range of values displayed varies from 0.00 to >50.0 ng/mL, but the analytical sensitivity of the test is 0.02 ng/mL. Values of 0.00 and 0.01 ng/mL will be displayed but are undistinguishable from 0.02 ng/mL. The cTnI samples were analyzed within 24 hours after blood sampling.25 Whole blood samples were stored at 4°C until analysis. Those samples were either analyzed within 4 hour (151/218, 69%) or analyzed within 24 hours by a private clinical pathology laboratory offering daily pickup services. Only one clinic had access to a cTnI analyzer at its office. This procedure was assumed to have little impact on cTnI recovered values. In a previous study on serum samples in cattle using a different test for cTnI quantification bovine cTnI concentrations decrease by 20% within 48 hours of storage at 4°C when using another assay in serum sample.26 However, when using the I‐Stat test on whole blood refrigerated samples up to 14 days, less than 4% coefficient of variation was noted in a human study.27
l‐Lactate Measurement
l‐lactatemia was measured by a portable analyzerd either cow‐side on whole blood or immediately after return to the clinic on the same stored (4°C) lithium heparin blood collection tube used to measure cTnI. Cow‐side tests were performed by a veterinary student (n = 151, from one clinic). Tests performed on stored blood were performed by a veterinary technician or the involved clinician (n = 69, from 4 clinics) (median, range: 60 minutes, 5–900 minutes). The maximal storage time before analysis was <90 min in 75% of those cases, and only 5 cases had been stored >4 hour before analysis. The median lactatemia of samples analyzed ≤90 and >90 minutes after sampling was 1.2 and 1.4 mmol/L, respectively. For this reason, the impact of storage on L‐lactate values was considered to be unimportant. The same portable testd was used in both situations. Clinicians were both blinded to the result at the moment of the inclusion. This analyzer was accurate and reliable using bovine blood when compared to a reference blood analyzer.28 During the 60‐second sample analysis, the lactate first reacts with potassium ferricyanide and lactate oxidase present on the strip. The resulting molecules are pyruvate and potassium ferrocyanide. Under current voltage, oxidation of the last molecule will release electrons, thus creating a current. The resulting current is then measured amperometrically and is directly proportional to the lactate concentration of the sample.29 Values showed range from 0.8 to 23.3 mmol/L, where “LO’’ represents values under 0.8 mmol/L and “HI’’ represents LAC over 23.3 mmol/L.
Outcome Assessment
Every participating clinician‐treated DCS cases blinded from the research team results (without LAC and cTnI information) but had access to chemistry panel result as it was considered a routine diagnostic procedure in DCS. A phone call follow‐up was performed with the producers 7, 30, and 60 days (d7, d30, and d60) after enrollment (JL) using a standard questionnaire. The main outcome of interest was the risk of dying, being euthanized, or being culled during the follow‐up period. The producers were asked if the cows were still present in the herd or not. If the cow had been culled or died (naturally or after euthanasia), they were asked for the date of the event. The outcome was considered positive (PO) if the animal was still in the herd and negative (NO) if the animal died, was euthanized, or had been culled. There was no additional call after a cow had been culled or had died. As most of the NO happened within 7 days after enrollment and that the research team wanted to minimize the effect of other causes of culling at 30 and 60 days, the analysis focused on the probability of NO 7 days after inclusion.
Statistical Analyses
A commercial software was used to perform the statistical analyses.e Descriptive statistics were performed to describe the enrolled population of cows. Descriptive statistics (median, 25th and 75th percentile) were obtained for each continuous variable (days in milk, lactation, time down before inclusion, heart rate, respiratory rate, temperature, LAC, and cTnI) by PROC MEANS in SAS. Categorical data (mental status, breed, capillary refill time, dehydration, rumen contractions, strength of ruminal contractions, amount and quality of feces, causes of decubitus, repartition of cases by clinics, repartition of outcome by clinics) were described using frequency tables (PROC FREQ in SAS).
Selected continuous variables (cTnI, LAC, and HR) were dichotomized using multiple cut‐off values, and 2 by 2 tables were obtained based on the outcomes of the cows (NO or PO). For each previous predictor, the cut‐off value that offered the highest sum of sensitivity and specificity to predict NO was retained as the best cut‐off value to be included in the multivariable analysis. Other variables from the clinical data form were dichotomized using clinical judgment to perform a Chi‐squared test based on the outcome of the cows 7 days after inclusion (PROC FREQ in SAS). For statistical considerations, a LAC value of 0.7 mmol/L was given for samples with “LO” results, whereas a cTnI value of 51 ng/mL was given for samples with a “>50 ng/mL” results.
All variables with a P‐value of <0.2 in univariable analysis as well as cut‐off blood values previously presented were retained and tested in a multivariable mixed logistic regression model (PROC GLIMMIX in SAS) accounting for farm clustering as a random effect. The multivariable modeling was performed using a backward elimination strategy; modeling was stopped when all the variables left presented a P‐value <0.05. The least squares means were used to compare probability of NO among animals with and without the identified risk factors controlling for other covariates. The area under the receiver operating characteristic (ROC) curve (AUC) was calculated to evaluate the model accuracy (PROC GLIMMIX and PROC FREQ in SAS).30, 31
Results
A total of 220 DCS cases from 152 farms were enrolled in our study. Two cows were eliminated because they were beef cows. The majority of cows were Holstein (n = 199/218; 91%). At enrollment, 59% (n = 123/209, missing data = 9) of cows were between 0 and 7 DIM, 14% (30/209) were between 8 and 60 DIM, 20% (42/209) were >60 DIM, and 7% (15/209) were dry cows. A quarter (53/198, missing data = 20) of the animals were on their fifth lactation or more; 44% (88/198) were on their third or fourth lactation, and 29% (58/198) were on their first or second lactation. Average time spent down before inclusion was 24 hours (median: 15 hours; range: 1–168 hours). Almost 40% of DCS cases were listed as having at least a musculoskeletal problem (n = 84/218); a third were suspected of an underlying metabolic problem (n = 74); 17% of cases were diagnosed with acute mastitis (n = 37); clinical signs of shock were observed in 4% of the cases (n = 9), and unknown or other causes were mentioned in 20% of cases (n = 44). Multiple diagnosis occurred in 16.7% (n = 36) of cows. The proportion of NO after inclusion was 62.4%, 71.6%, and 73.9% on d7, d30, and d60, respectively.
Descriptive statistics of continuous variables are listed in Table 1. Even though tachycardia was commonly observed, specific cardiac auscultation anomalies were uncommon with only 4 cows presenting dysrhythmia compatible with atrial fibrillation. Dichotomized data and their univariable analysis are listed in Table 2. Data retained for the multivariable analysis were as follows: DIM, mental status, CRT, appearance of mucous membranes, presence of dehydration, and presence of a unique musculoskeletal component. A short summary of different cut‐offs for cTnI (median: 0.39 ng/mL; range: 0–>50 ng/mL), lactatemia (median: 1.4 mmol/L; range: <0.8–15.6 mmol/L), and HR (median: 91 BPM; range: 32–160 BPM) is indicated in Table 3. Lactatemia was not associated with the probability of NO. The optimal cut‐off value for cTnI and HR was 0.7 ng/mL and 100 BPM, respectively. A complete list of the different cut‐off values tested for cTnI, LAC, and HR is available as online supporting information.
Table 1.
Descriptive statistics of main variables of interest collected in 218 cases of downer cow syndrome on the day of inclusion in the study
| Variables | NO cows (n = 136) | PO cows (n = 82) | ||
|---|---|---|---|---|
| Median (25th–75th)c | n | Median (25th–75th) | n | |
| Rectal temperature (°C) | 38.5 (38.0–38.9) | 135 | 38.6 (38.3–38.9) | 80 |
| Respiratory rate | 36 (28–44) | 131 | 38 (24–39) | 76 |
| Heart rate (BPM) | 96 (80–112) | 134 | 88 (80–100) | 78 |
| Time downa (h) | 16 (8–27) | 130 | 12 (2–36) | 77 |
| DIMb | 3 (1–21) | 122 | 4 (2–62) | 72 |
| Parity | 3 (2–5) | 124 | 3 (2–4) | 74 |
| cTnI (ng/mL) | 0.80 (0.14–4.87) | 135 | 0.16 (0.03–0.58) | 74 |
| LAC (mmol/L) | 1.4 (1.0–2.8) | 135 | 1.3 (0.9–2.3) | 78 |
DCS, downer cow syndrome; NO, negative outcome; PO, positive outcome; DIM, days in milk (excluding dry cows); cTnI, cardiac troponins I; LAC, L‐lactate; BPM, beats per minute.
Exact time obtained in 207 animals; in 9 cows, decubitus was present for >24 hours without any further precision in the dataset. These animals were not counted in this table but were included in Table 2 (n = 216).
This information does not take into account dry cows (n = 15).
Results listed as median (25th‐75th percentile values).
Table 2.
Univariable analysis on clinical information collected on downer cows on the day of inclusion
| Variables | Class | NO cows (n) | PO cows (n) | P |
|---|---|---|---|---|
| DIM | ||||
| dry‐7 DIM | 94 | 44 | 0.06a | |
| >7 DIM | 39 | 32 | ||
| Parity | ||||
| 0‐1‐2 lactations | 34 | 24 | 0.45 | |
| >2 lactations | 90 | 50 | ||
| Time down | ||||
| ≤24 hours | 96 | 55 | 0.78 | |
| >24 hours | 40 | 25 | ||
| Mental status | ||||
| Alert | 38 | 39 | <0.01a | |
| Lethargic | 89 | 39 | ||
| Temperature | ||||
| ≤39.2°C | 116 | 69 | 0.95 | |
| >39.2°C | 19 | 11 | ||
| Respiratory rate | ||||
| ≤36 RPM | 67 | 37 | 0.70 | |
| >36 RPM | 64 | 39 | ||
| CRT | ||||
| <2 second | 116 | 75 | 0.07a | |
| ≥2 second | 17 | 4 | ||
| Dehydration | ||||
| <5% | 53 | 40 | 0.11a | |
| ≥5% | 83 | 40 | ||
| Rumen motility | ||||
| 0–1 contraction per 2 minute | 91 | 47 | 0.18a | |
| ≥2 contractions per 2 minute | 36 | 28 | ||
| Rumen contraction | ||||
| Complete | 38 | 30 | 0.34 | |
| Incomplete | 41 | 23 | ||
| Mucous membrane | ||||
| Normal | 93 | 65 | 0.05a | |
| Abnormal | 37 | 13 | ||
| Causes | ||||
| Unique MS problem | Yes | 40 | 14 | 0.05a |
| No | 94 | 65 | ||
| Unique acute mastitis problem | Yes | 17 | 15 | 0.21 |
| No | 117 | 64 | ||
| Unique metabolic problem | Yes | 25 | 18 | 0.48 |
| No | 110 | 62 |
NO, negative outcome; PO, positive outcome; DIM, days in milk; CRT, capillary refill time; MS, musculoskeletal.
Normal mucous membranes were defined as pink and moist. Other observations were defined as abnormal.
Variables retained for the multivariable logistic regression where P < 0.2.
Table 3.
Optimal cut‐offs for LAC, cTnI, and HR based on the maximal sum of sensitivity and specificity to predict early elimination of cows affected by downer cow syndrome
| Variables | Cut‐off value | Cows above selected cut‐off (%) | Se (%) | Sp (%) | P‐value |
|---|---|---|---|---|---|
| LAC (mmol/L) | >4 vs ≤4 | 17.6 | 18 | 92 | 0.4 |
| cTnI (ng/mL) | >0.7 vs ≤0.7 | 42.6 | 54 | 78 | <0.01a |
| HR (bpm) | >100 vs ≤100 | 27.7 | 35 | 85 | <0.01a |
LAC, l‐lactatemia; cTnI, cardiac troponin I; HR, heart rate (beats per minute); Se, sensitivity; Sp, specificity.
Variables retained for the multivariable logistic regression with P < 0.2.
The mixed logistic regression model accounting for farm clustering is presented in Figure 1 and Table 4. The final multivariable model includes a positive association of tachycardia (100 BPM threshold) and increased cTnI 0.7 ng/mL threshold) with the probability of NO by d7. The least square means for proportions of NO were 0.64 (±0.05) and 0.86 (±0.06) for HR ≤ 100 BPM and HR > 100 BPM, respectively. The least square means for proportions of NO were 0.59 (±0.06) and 0.89 (±0.05) for cTnI, ≤0.7 ng/mL and >0.7 ng/mL, respectively. The model accuracy was considered good with an area under the curve of 0.88 (95% CI: 0.78–0.98; Fig 2).31
Figure 1.
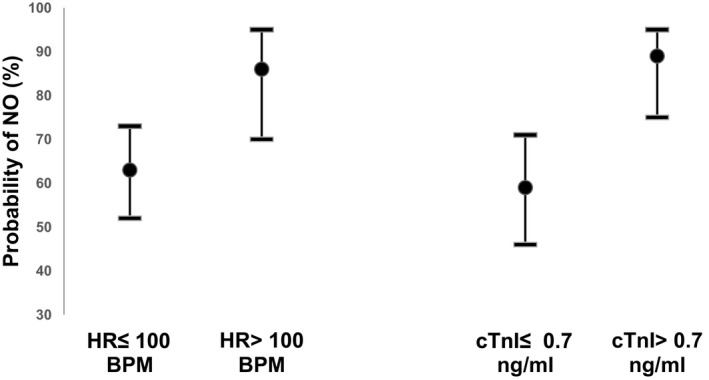
Least squares means probability of negative outcome (NO) on cows affected by DCS, 7 days after the initial diagnosis. The least squares means are represented by dots (95% confidence intervals) and were obtained using the final multivariable regression model. NO, negative outcome; DCS, downer cow syndrome; HR, heart rate; cTnI, cardiac troponin I.
Table 4.
Final model for prediction of probability of negative outcome on d7 after the initial diagnosis of downer cow syndrome
| Variable | Coefficient | SE | OR | 95% CI | P |
|---|---|---|---|---|---|
| Intercept | −0.33 | 0.27 | |||
| cTnI ≤ 0.7 ng/mL | Referent | ||||
| cTnI > 0.7 ng/mL | 1.71 | 0.49 | 5.53 | 2.10–14.60 | <0.001 |
| HR ≤ 100 | Referent | ||||
| HR > 100 | 1.3 | 0.51 | 3.65 | 1.32–10.15 | 0.014 |
d7, 7 days after study inclusion; SE, standard error; OR, odds ratio; 95% CI, 95% confidence interval; LSM, least squares means; SEM, standard error means.
Figure 2.

Receiver operating characteristic (ROC) curve of the final logistic model to predict negative outcome of cows affected by downer cow syndrome. Se, sensitivity; Sp, specificity. The area under the ROC curve was 0.88 (95% CI, 0.78–0.98) indicating that, on average when comparing one randomly pair of downer cow with different prognosis (1 downer with negative outcome (NO) and 1 downer with positive outcome (PO)), the NO cow had 88% (95% CI, 0.78–0.98) chances of having a higher probability of NO (as determined by the model) than the PO cow.
Discussion
Our study evaluates cTnI and LAC as predictors of NO in DCS in dairy cows within farm settings. Our study represents a large panel of different causes of DCS that is representative of that which is commonly seen by North American dairy practitioners. Our results show that the prognosis of DCS is poor when veterinarians deal with such cases in the field. The high incidence of NO is not surprising, considering our case definition of DCS. We included alert and nonalert cases, being cautious to not include early hypocalcemia cases. The proportion of cows with a poor prognosis is still representative of previously published data in regards of NO.7, 17, 32
Cows affected by DCS with high cTnI concentration (>0.7 ng/mL) had 5.5 times the odds of NO the week after inclusion than DCS with lower blood cTnI concentration. A preliminary study on 50 referred cases with common production diseases with the same device for measuring troponinemia found the highest cTnI concentration in DCS (n = 8, median: 1.7 ng/mL; range: 0.15–27.00 ng/mL).18 Their DCS definition included alert and nonalert cows with no response to previous treatment, which is similar to the DCS definition used in our study. A NO happened in 7 of 8 DCS. Cardiac lesions (epicarditis, endocarditis, and myocarditis) were also noted on two of the four DCS cases who underwent complete necropsy. In that previous study, cTnI was associated with the probability of NO regardless of the final diagnosis. The odds of having a NO were over 6 times higher in cows with cTnI >0.5 ng/mL than in cows with cTnI <0.02 ng/mL. The crude cTnI accuracy for NO was not as accurate as in this preliminary investigation as indicated with the low Se and moderate Sp. It would have been of interest to assess more specifically cTnI accuracy according to the suspected causes of decubitus. However, the physical examination used in this study cannot be considered as a gold standard for establishing a definitive diagnosis. Data splitting would also suppose a potential loss of power of our study.
Use of different cut‐off values would be interesting for animals of great genetic value (higher cut‐off, to be more specific) or commercial‐type animals (lower cut‐off, to be more sensitive). Doing so, clinicians would have yet another criterion to support more intensive treatments (increasing quality of the on‐farm nursing or referral for balneotherapy) or recommend euthanasia earlier in the process of DCS. Treatments in flotation tank, when cases are referred early and are carefully selected, have a PO of 37 to 90%.2, 10, 32, 33 This success proportion is most of the time better than the PO reported in this field study (PO = 38%).
Interestingly, cows with a HR over 100 BPM had 3.7 times the odds of NO than did cows with lower HR. Our study shows that assessment of precise HR during the routine examination of DCS is a predictor of NO. The fact that both cTnI concentration and HR are prognosis indicators emphasizes on the importance of objective cardiovascular system assessment in DCS. Increased cTnI concentrations have been observed in human medicine with rhabdomyolysis, sepsis, hypotension/hypovolemia, renal failure, gastrointestinal bleeding, and stress‐induced cardiomyopathy34, 35 and with induced endotoxemia in calves and horses.36, 37 All those conditions might be present at different extent in cows affected by DCS in regards to the primary cause of recumbency (i.e. acute mastitis or metritis), the duration of the condition, the environmental conditions, and the animal itself. Most of these conditions are also associated with tachycardia. Tachycardia is also a nonspecific indicator of pain.
The L‐lactate blood concentration was not associated with NO of DCS in this study. One of the pitfalls of this study is single blood sampling time at the day of inclusion. Even if some studies showed some predictive value of NO21 in diseases where hypoperfusion is well documented, many studies have indicated that repetitive measures over days of LAC are more useful than one measurement.20, 38, 39, 40 However, the objective of the present study was to predict the outcome of DCS in field conditions, where economic factors will limit veterinary visits and where prognosis should be established as early as possible. LAC is a good indicator of hypoperfusion which is associated with various conditions found in DCS.41 In light of our results, assessment of the local/systemic hypoperfusion is not of interest in the general population of DCS. This biomarker might be more useful when dealing with cases where hypoperfusion is well documented.42, 43 The current study design and objectives did not allow us to test this hypothesis.
The DCS definition used in this study can be debated as many different DCS definitions already exist in the current literature, and after all, the research team created its own definition.2, 9, 32, 44 Our goal doing so was to keep it as close as possible of what a private practitioner will see in his daily practice while being sure to exclude simple milk fever in our final study population. Some might point out the absence of definitions given to the practitioners to identify the possible underlying causes of the recumbency. It might explain partly why none of these underlying causes were part of our final statistical model. The identification of precise underlying conditions in DCS was out of the scope of this study. The proportion of NO was not different between involved clinics (data not shown). Unfortunately, it was impossible to calculate individual clinician effect as many clinicians (n = 32) were involved in recruiting DCS cases for this study.
We did not include in the present study the chemistry panel results that were available for the practitioner in every included case. We allowed the veterinary practitioner to have access to this information for case management and discussion with the owner as it could be considered as a standard of method to assess DCS when initial treatment failed. For these reasons, it would not have been useful to see if any blood marker was associated with the prognosis as the practitioners’ knowledge of the results would have potentially biased the results toward markers what has been previously published in the literature.
In conclusion, there was no association between LAC blood value and the outcome in downer cows. High troponinemia and high HR were associated with NO in DCS cases managed in a farm setting. The prognosis for downer cows remains guarded to poor in Québec dairy farms as more than 60% of cows have a negative outcome within the first week after the initial diagnosis. Working on early decision tools is important to provide high‐level care of animals with a chance of recovery and avoiding supplementary pain or treatments in cows with high probability of dying.
Acknowledgment
We acknowledge the participating clinicians and dairy farmers for their participation in this study.
Conflict of Interest Declaration
Sébastien Buczinski serves as Consulting Editor for Experimental Design and Statistics for the Journal of Veterinary Internal Medicine. He was not involved in review of this manuscript.
Off‐label Antimicrobial Declaration
Authors declare no off‐label use of antimicrobials.
The work presented here was performed among dairy herds located in the Province of Québec, Canada.
This study was supported by a grant from the Innov'Action program (810133) offered by the Ministère de l'Agriculture, des Pêcheries et de l'Alimentation du Québec, and by Agriculture and Agri‐food of Canada. Abaxis provided half of the cTnI cartridges used in this study without being involved in the study design or the data analysis.
Results from this study were presented at the 2014 ACVIM Forum, Nashville, TN (by Buczinski), at the Annual convention of the 2014 American Association of Bovine Practitioners, Albuquerque, NM (by Labonté), and at the 2014 Annual Congress of the 2014 Association des Médecins Vétérinaires Praticiens du Québec (AMVPQ), Bromont, Quebec, Canada (by Labonté).
This manuscript was part of the Master's thesis submitted by Dr. Josiane Labonté to the Université de Montréal.
Footnotes
aBD Vacutainer Venous Blood Collection Tube, serum tube BD Diagnostics, Franklin Lakes, NJ
bBD Vacutainer Venous Blood Collection Tube, lithium heparin. BD Diagnostics, Franklin Lakes, NJ
ci‐STAT analyzer, Abaxis, Union City, CA
dLactate‐Pro, Arkray, Kyoto, Japan
eSAS 9.2, SAS Institute inc. Cary, NC
References
- 1. Green AL, Lombard JE, Garber LP, et al. Factors associated with occurrence and recovery of nonambulatory dairy cows in the United States. J Dairy Sci 2008;91:2275–2283. [DOI] [PubMed] [Google Scholar]
- 2. Burton AJ, Nydam DV, Ollivett TL, et al. Prognostic indicators for nonambulatory cattle treated by use of a flotation tank system in a referral hospital: 51 cases (1997–2008). J Am Vet Med Assoc 2009;234:1177–1182. [DOI] [PubMed] [Google Scholar]
- 3. Smith BP, Angelos J, George LW. Down cows (Alert Downers) In: Smith BP, ed. Large Animal Internal Medicine, 3rd ed St. Louis: Mosby; 2002:1017–1018. [Google Scholar]
- 4. Stark DA. A review of the veterinarian's role in the handling of down/disabled cattle. Bovine Pract 1995;29:125–127. [Google Scholar]
- 5. Cox VS. Nonsystemic causes of the downer cow syndrome. Vet Clin N Am‐ Food Anim Pract 1988;4:413–433. [DOI] [PubMed] [Google Scholar]
- 6. Correa MT, Erb HN, Scarlett JM. Risk‐factors for downer cow syndrome. J Dairy Sci 1993;76:3460–3463. [DOI] [PubMed] [Google Scholar]
- 7. Cox VS, Marsh WE, Steuernagel GR, et al. Downer cow occurrence in Minnesota dairy herds. Prev Vet Med 1986;4:249–260. [Google Scholar]
- 8. Fenwick DC. The downer cow. Aust Vet J 1969;45:184–188. [DOI] [PubMed] [Google Scholar]
- 9. Stull CL, Payne MA, Berry SL, et al. A review of the causes, prevention, and welfare of nonambulatory cattle. J Am Vet Med Assoc 2007;231:227–233. [DOI] [PubMed] [Google Scholar]
- 10. Stojkov J, Weary DM, von Keyserlingk MA. Nonambulatory cows: Duration of recumbency and quality of nursing care affect outcome of flotation therapy. J Dairy Sci 2016;99:2076–2085. [DOI] [PubMed] [Google Scholar]
- 11. Reynolds J. Dealing with downers In: AABP, ed. Annual Convention of the American Association of Bovine Practitioners. Fort Worth, TX:Texas, USA; 2006;28–31. [Google Scholar]
- 12. Andrews AH, Blowey RW. Lameness above the foot In: Andrews AH, ed. Bovine Medicine: Diseases and Husbandry of Cattle, 3rd ed Oxford: Blackwell Science; 2004:431–439. [Google Scholar]
- 13. Cox VS, McGrath CJ, Jorgensen SE. The role of pressure damage in pathogenesis of the downer cow syndrome. Am J Vet Res 1982;43:26–31. [PubMed] [Google Scholar]
- 14. Yamagishi N, Okada H, Koiwa M, et al. Peripartum heart disease in cows. J Comp Physiol 1995;113:373–382. [DOI] [PubMed] [Google Scholar]
- 15. Jonsson G, Pehrson B. Studies on the downer syndrome in dairy cows. Zentralbl Veterinarmed A 1969;16:757–784. [DOI] [PubMed] [Google Scholar]
- 16. Wilkins PA, Sheahan BJ, Vander Werf KA, et al. Preliminary investigation of the area under the L‐lactate concentration‐time curve (LAC(AREA)) in critically Ill equine neonates. J Vet Intern Med 2015;29:659–662. [DOI] [PMC free article] [PubMed] [Google Scholar]
- 17. Shpigel NY, Avidar Y, Bogin E. Value of measurements of the serum activities of creatine phosphokinase, aspartate aminotransferase and lactate dehydrogenase for predicting whether recumbent dairy cows will recover. Vet Rec 2003;152:773–776. [DOI] [PubMed] [Google Scholar]
- 18. Varga A, Angelos JA, Graham TW, et al. Preliminary investigation of cardiac troponin I concentration in cows with common production diseases. J Vet Intern Med 2013;27:1613–1621. [DOI] [PubMed] [Google Scholar]
- 19. Figueiredo MD, Nydam DV, Perkins GA, et al. Prognostic value of plasma L‐lactate concentration measured cow‐side with a portable clinical analyzer in Holstein dairy cattle with abomasal disorders. J Vet Intern Med 2006;20:1463–1470. [DOI] [PubMed] [Google Scholar]
- 20. Coghe J, Uystepruyst C, Bureau F, et al. Validation and prognostic value of plasma lactate measurement in bovine respiratory disease. Vet J 2000;160:139–146. [DOI] [PubMed] [Google Scholar]
- 21. Boulay G, Francoz D, Doré E, et al. Preoperative cow‐side lactatemia measurement predicts negative outcome in Holstein dairy cattle with right abomasal disorders. J Dairy Sci 2014;97:212–221. [DOI] [PubMed] [Google Scholar]
- 22. Younger JG, Falk JL, Rothrock SG. Relationship between arterial and peripheral venous lactate levels. Acad Emerg Med 1996;3:730–734. [DOI] [PubMed] [Google Scholar]
- 23. Labonté J, Roy JP, Dubuc J, et al. Measurement of cardiac troponin I in healthy lactating dairy cows using a point of care analyzer (i‐STAT‐1). J Vet Cardiol 2015;17:129–133. [DOI] [PubMed] [Google Scholar]
- 24. Fraser BC, Anderson DE, White BJ, et al. Assessment of a commercially available point‐of‐care assay for the measurement of bovine cardiac troponin I concentration. Am J Vet Res 2013;74:870–873. [DOI] [PubMed] [Google Scholar]
- 25. 715595‐01: Cardiac troponin I (cTnI) . In. IL: Abbott Point of Care Inc. 2013;1–10.
- 26. Varga A, Schober KE, Walker WL, et al. Validation of a commercially available immunoassay for the measurement of bovine cardiac troponin I. J Vet Intern Med 2009;23:359–365. [DOI] [PubMed] [Google Scholar]
- 27. Apple FS, Murakami MM, Christenson RH, et al. Analytical performance of the i‐STAT cardiac troponin I assay. Clin Chim Acta 2004;345:123–127. [DOI] [PubMed] [Google Scholar]
- 28. Buczinski S, Doré E, Boulay G, et al. Validation of the handheld Lactate‐Pro analyzer for measurement of blood L‐lactate concentration in cattle. Vet Clin Pathol 2014;43:567–572. [DOI] [PubMed] [Google Scholar]
- 29. Tanner RK, Fuller KL, Ross ML. Evaluation of three portable blood lactate analysers: Lactate Pro, Lactate Scout and Lactate Plus. Eur J Appl Physiol 2010;109:551–559. [DOI] [PubMed] [Google Scholar]
- 30. Dohoo I, Martin W, Stryhn H. Screening and diagnostic tests In: Dohoo I, Martin W, Stryhn H, ed. Veterinary Epidemiologic Research, 2nd ed. Charlottetown, Prince Edward Island, Canada: VER Inc; 2009:91–134. [Google Scholar]
- 31. Greiner M, Pfeiffer D, Smith RD. Principles and practical application of the receiver‐operating characteristic analysis for diagnostic tests. Prev Vet Med 2000;45:23–41. [DOI] [PubMed] [Google Scholar]
- 32. Andrews T. The ‘downer cow’. In Pract 1986;8:187–189. [Google Scholar]
- 33. Smith BP, Angelos JA, George LW, et al. Down cows: causes and treatments. In: Annual convention of the American Association of Bovine Practitioners, Montreal, Qc, CAN 1997;43–45.
- 34. Wells SM, Sleeper M. Cardiac troponins. J Vet Emerg Crit Care 2008;18:235–245. [Google Scholar]
- 35. Kelley WE, Januzzi JL, Christenson RH. Increases of cardiac troponin in conditions other than acute coronary syndrome and heart failure. Clin Chem Lab Med 2009;55:2098–2112. [DOI] [PubMed] [Google Scholar]
- 36. Peek SF, Apple FS, Murakami MA, et al. Cardiac isoenzymes in healthy Holstein calves and calves with experimentally induced endotoxemia. Can J Vet Res 2008;72:356–361. [PMC free article] [PubMed] [Google Scholar]
- 37. Nostell K, Brojer J, Hoglund K, et al. Cardiac troponin I and the occurrence of cardiac arrhythmias in horses with experimentally induced endotoxaemia. Vet J 2012;192:171–175. [DOI] [PubMed] [Google Scholar]
- 38. Hashimoto‐Hill S, Magdesian KG, Kass PH. Serial measurement of lactate concentration in horses with acute colitis. J Vet Intern Med 2011;25:1414–1419. [DOI] [PubMed] [Google Scholar]
- 39. Holahan ML, Brown AJ, Drobatz KJ. The association of blood lactate concentration with outcome in dogs with idiopathic immune‐mediated hemolytic anemia: 173 cases (2003–2006). J Vet Emerg Crit Care 2010;20:413–420. [DOI] [PubMed] [Google Scholar]
- 40. Radcliffe RM, Divers TJ, Fletcher DJ, et al. Evaluation of L‐lactate and cardiac troponin I in horses undergoing emergency abdominal surgery. J Vet Emerg Crit Care 2012;22:313–319. [DOI] [PubMed] [Google Scholar]
- 41. Pang DS, Boysen S. Lactate in veterinary critical care: Pathophysiology and management. J Am Vet Med Assoc 2007;43:270–279. [DOI] [PubMed] [Google Scholar]
- 42. Green MJ, Cripps PJ, Green LE. Prognostic indicators for toxic mastitis in dairy cows. Vet Rec 1998;143:127–130. [DOI] [PubMed] [Google Scholar]
- 43. Bleul U, Sacher K, Corti S, et al. Clinical findings in 56 cows with toxic mastitis. Vet Rec 2006;159:677–679. [DOI] [PubMed] [Google Scholar]
- 44. Cox VS. An update on the downer cow syndrome. Bovine Pract 1986;21:195–199. [Google Scholar]