Abstract
Background
People with critical illness (CI) commonly develop various forms of immune dysfunction, however, there is limited information concerning immune dysfunction in dogs with CI.
Hypothesis
The immune response in CI dogs differs from that of healthy dogs.
Animals
Immunologic variables were compared between 14 dogs with CI, defined as APPLEfast score of >20 points, admitted to the University of Missouri Veterinary Health Center Small Animal Clinic Intensive Care Unit and healthy controls (n = 15).
Methods
Cohort study evaluating constitutive and lipopolysaccharide (LPS)‐stimulated TNF‐α, IL‐6, and IL‐10 production, phagocytosis of opsonized E. coli and respiratory burst capacity after opsonized E. coli or phorbol 12‐myristate 13‐acetate (PMA) stimulation, peripheral blood lymphocyte phenotype, and monocyte expressions of HLA‐DR and TLR‐4.
Results
Lipopolysaccharide‐stimulated leukocyte TNF‐α (median, Q1, Q3; CI, 49, 49, 120; control, 655, 446, 1174 pg/mL; P = < 0.001), IL‐6 (median, Q1, Q3; CI, 49, 49, 64; control, 100, 49, 166 pg/mL; P = 0.029), and IL‐10 (CI, 49, 49, 56; control, 96, 49, 203 pg/mL; P = 0.014) production and both E. coli (median, Q1, Q3; CI, 60.5, 43, 88.5; control, 86.6, 81, 89.2%; P = 0.047) and PMA (CI, 40, 11.7, 70; control, 93, 83, 97.6%; P = < 0.001)‐stimulated respiratory burst capacity significantly decreased in CI dogs. Percentage of monocytes expressing TLR‐4 greater in the CI dogs (median, Q1, Q3; CI, 46.9, 24.3, 64.2; control, 16.4, 9.4, 26.2%; P = 0.005).
Conclusion
These findings suggest dogs with CI develop immune system alterations that result in reduced respiratory burst function and cytokine production despite upregulation of TLR‐4.
Keywords: Cytokines, Phagocytosis, Respiratory burst, Sepsis
Abbreviations
- APPLEfast
acute patient physiologic and laboratory evaluation score (5‐variable model)
- CD
cluster of differentiation
- CI
critically ill
- EDTA
ethylenediaminetetraacetic acid
- HLA‐DR
human leukocyte antigen – antigen D related
- ICU
intensive care unit
- IL
interleukin
- MFI
mean fluorescent intensity
- NSAID
non‐steroidal anti‐inflammatory drug
- PBS
phosphate‐buffered saline
- PMA
phorbol 12‐myristate 13‐acetate
- SD
standard deviation
- SIRS
systemic inflammatory response syndrome
- TLR
toll‐like receptor
- TNF
tumor necrosis factor
A small number of studies have examined the immune response to critical illness (CI) in experimental settings in dogs. Both phagocytosis and oxidative burst in response to E. coli and plasma or serum cytokine concentrations have been evaluated; however, little about other aspects of the immune response in dogs with naturally developing CI has been characterized.1, 2, 3, 4 In humans with CI, decreased production of TNF‐α and IL‐6, increased production of IL‐10, diminished respiratory burst function despite increased phagocytic function, CD4+/CD8+ T‐cell and B‐cell lymphocytic apoptosis, T‐regulatory cell expansion, and altered expression and function of monocyte HLA‐DR and TLR‐4, respectively, have been identified as common manifestations of CI‐induced immune dysfunction.5, 6, 7, 8, 9, 10 Therefore, we hypothesized that the immune response in CI dogs would differ from that of healthy dogs. To test this hypothesis, we examined several aspects of the immune system in CI dogs, including leukocyte cytokine production capacity, phagocytic function, respiratory burst function, and quantification of lymphoid cell subpopulations and expression of surface markers on monocytic cells.
Materials and Methods
This was a prospective, observational cohort study. All aspects of this study were approved by the Institutional Animal Care and Use Committee of the University of Missouri (protocol # 7334). The control group included dogs owned by students, staff, and faculty of the University of Missouri, College Of Veterinary Medicine. These dogs were selected based on availability and diagnosis of apparent overall health deduced from physical examination, a complete blood count, serum chemistry evaluation, and urinalysis. Each client supplied the dog's signalment and history including vaccination status.
The CI group was selected from dogs admitted into the intensive care unit (ICU) at the University of Missouri Veterinary Health Center Small Animal Clinic between June 2015 and February 2016. Primary inclusion criteria were admission to the ICU within the previous 24 hours, animal owner consent, primary clinician consent, and medical history, physical examination, complete blood count, and serum chemistry analysis recorded as part of their diagnostic work‐up. Dogs were also required to have an APPLEfast score of >20 points.11 Exclusion criteria for the CI population included the following: immune system disorders, endocrine disease, neoplasia, postoperative neurologic, or orthopedic surgery recovery, as well as animals undergoing seizure watch only, radiation or chemotherapy, or immunomodulatory therapies administered in the previous 5 days for short‐acting immunomodulators such as glucocorticoids, NSAIDs, chemotherapeutic agents, immunosuppressants, or 30 days for long‐acting immunomodulators. Blood samples for analysis were obtained within 24 hours of ICU admission for each CI dog enrolled in the study.
Blood was collected into sodium heparin and potassium (K3) EDTA evacuated glass tubes. Blood was maintained at room temperature, and analysis was performed within 1 hour of collection. To identify dynamic changes in immunologic variables, blood was collected again 48 hours after the initial sample for CI dogs.
Leukocyte cytokine production capacity was evaluated using previously described methods.12, 13, 14 Sodium heparinized whole blood was diluted 1 : 2 with RPMI medium with penicillin (200 U/mL) and streptomycin (200 mg/mL) (Gibco, Invitrogen; Life Technologies, Waltham, MA, USA), placed in 96‐well plates, and stimulated with LPS from E. coli O127 : B8 (final concentration, 100 ng/mL; Sigma‐Aldrich), or phosphate‐buffered saline (PBS) control. Plates were gently mixed on a plate rocker for 5 minutes, and then incubated for 24 hours at 37°C in 5% CO2. After incubation, plates were again gently mixed for 5 minutes on a plate rocker before centrifugation (300 g for 7 minutes). The supernatant was collected and stored at −80°C for batch analyses. Concentrations of TNF‐α, IL‐6, and IL‐10 were measured in duplicate from the supernatant with a canine‐specific multiplex bead‐based assay (MilliporeSigma, Billerica, MA, USA) using previously described methods.15 Briefly, an aliquot of 300 μL of each supernatant sample was thawed, and samples were centrifuged to pellet debris, then supernatant was removed. Each aliquot was admixed with anticytokine mono‐or polyclonal antibody‐charged polystyrene microspheres in a 96‐well plate. Samples were incubated at 4°C with agitation, and a biotinylated polyclonal detection antibody was added, followed by streptavidin‐phycoerythrin. Each sample was analyzed in duplicate with appropriate controls and associated data analysis software (MILLPLEX Analyst 5.1, MilliporeSigma, Billerica, MA, USA) to determine the cytokine concentration (pg/mL) and median fluorescence intensity. The limit of detection of this assay was 48.8 pg/mL for each cytokine; intra‐assay coefficient of variation was <5%, and interassay coefficient of variation was <10%.
Phagocytic function of neutrophils and monocytes was determined with the Phagotest commercial test kit (Orpegen Pharma, Heidelberg, Germany) according to manufacturer's instructions as previously described.16 Briefly, 100 μL of heparinized blood from healthy and CI dogs was incubated in a 37°C water bath for 10 min with 20 μL FITC‐labeled, opsonized E. coli bacteria or washing solution (negative control). Phagocytosis was arrested by placing the sample on ice and adding 100 μL of quenching solution to remove the FITC fluorescence of surface bound bacteria. The cells were washed, erythrocytes were lysed, the cells were washed again, and 200 μL of DNA staining solution was added to facilitate the exclusion of aggregation artifacts of bacteria or cells. Samples were analyzed by flow cytometry within 1 hour, and a minimum of 10,000 events were recorded for each sample.
Respiratory burst function in neutrophils and monocytes was determined with a Phagoburst kit according to the manufacturer's instructions (ORPEGEN Pharma) as previously described.17 Briefly, 100 μL of heparinized blood from healthy and CI dogs was incubated with 20 μL of either opsonized E. coli (biological stimulus) or phorbol 12‐myristate 13‐acetate (PMA; chemical stimulus) for 10 min at 37°C in a water bath. Samples were then incubated with 20 μL of dihydrorhodamine‐123 as a fluorogenic substrate for oxygen intermediates for 10 min at 37°C in a water bath. This reaction was then extinguished, erythrocytes were lysed, the cells were washed, and 200 μL of DNA staining solution was added to facilitate the exclusion of aggregation artifacts of bacteria or cells. Samples were analyzed by flow cytometry within 1 hour, and a minimum of 10,000 events were recorded for each sample.
Antibodies used for the lymphocyte phenotype assays included anti‐Canine CD3‐FITC/CD4‐RPE (clone CA17.2A12/YKIX302.9; Bio‐Rad; Hercules, CA, USA), anti‐Canine CD3‐FITC/CD8‐RPE (clone CA17.2A12/YCATE55.9; Bio‐Rad), Mouse anti‐Canine CD21‐RPE (clone CA2.1D6; Bio‐Rad), Mouse anti‐Human HLA‐DR‐FITC (clone G46‐6; BD Pharmingen; San Jose, CA, USA), anti‐Human CD284 (TLR‐4)‐PE (clone HTA125; eBioscience; Waltham, MA, USA), Rat anti‐Canine CD4‐FITC (clone MCA1038F; eBioscience), anti‐Canine CD25‐PE (clone P4A10; eBioscience), and anti‐Mouse/Rat FoxP3‐APC (clone FJK‐16S; eBioscience).
Using previously described methods for identification of CD4+, CD8+, and CD21+ lymphoid cells as well as HLA‐DR+ and TLR‐4+ monocytic cells, 100 μL of EDTA anticoagulated whole blood was added to 96‐well round bottom plate.18, 19 Antibodies were added to identify each of the following subpopulations of cells: CD4 + T‐lymphoid cells (CD3+/CD4+), CD8+ T‐lymphoid cells (CD3+/CD8+), B‐lymphoid cells (CD21+), and HLA‐DR+ and TLR‐4+ monocytic cells. The antibodies were incubated for 30 minutes protected from light. Following incubation, the cells were washed, RBCs were lysed, and the cells were washed again followed by fixation in formalin. Isolation of T‐regulatory cells (CD4+/CD25+/FoxP3+) was achieved using previously described methods.20 RBCs in 700 μL of EDTA whole blood were lysed with sterilized distilled deionized water. The sample was washed then incubated on ice with CD4 and CD25 antibodies for 30 minutes protected from light. The cells were washed with PBS, then FoxP3 fixation/permeabilization solution (eBioscience) was added, and the sample was incubated in 4°C overnight. Following incubation, the cells were washed, then incubated with FoxP3 antibody on ice for 60 minutes protected from light, then washed again. Samples were analyzed by flow cytometry within 1 hour, and a minimum of 10,000 events were recorded for each sample.
A CyAn ADP flow cytometry instrument (Beckman Coulter, Inc.; Brea, CA, USA) and associated data analysis software (Summit V5.2.0.7477, Dako Colorado, Inc.; Ft. Collins, CO, USA) were used for analysis of phagocytosis and respiratory burst capacity in phagocytic cells, including neutrophils and monocytes, quantification of CD3+/CD4+, CD3+/CD8+, and CD21+ lymphoid phenotypes, and quantification of monocytic cells expressing HLA‐DR and TLR‐4 for all the dogs enrolled in this study using previously described methods.14, 17, 18, 19
For phagocytosis and respiratory burst function, aggregation artifacts caused by bacteria or cells were excluded by gating around live cells based on DNA stain uptake (Fig 1). Gating of phagocytic cells, including both neutrophils and monocytes, was performed using forward versus side scatter. Data for assessment of phagocytosis were recorded as percentage of phagocytic cells having consumed the FITC‐labeled E. coli as well as their mean fluorescent intensity (MFI), a method of quantifying the amount of phagocytosed bacteria per cell. Data for assessment of respiratory burst function were recorded as percentage of cells expressing the florescence of rhodamine bound to the reactive oxygen metabolites generated in response to both E. coli and PMA stimulation as well as their MFI, a method of quantifying the burst intensity (amount of oxidative compounds produced per cell).
Figure 1.
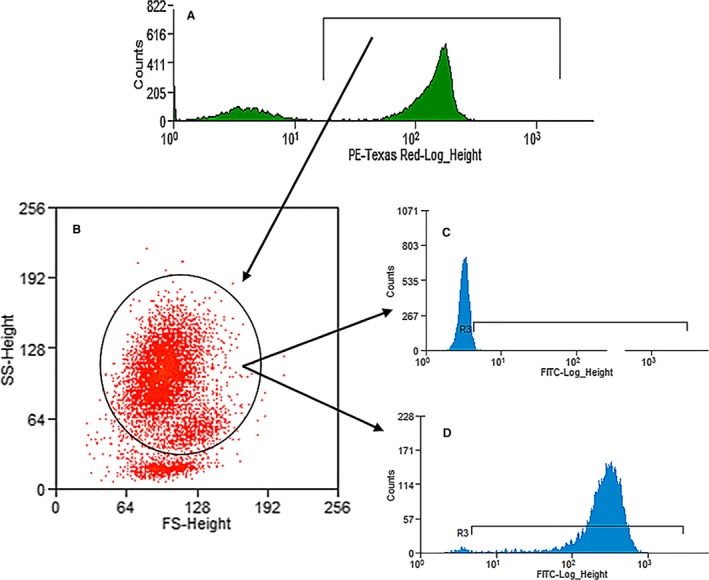
Example of the gating scheme for phagocytosis and respiratory burst function. First, live cells were separated from artifact (A), then applied to a forward scatter versus side scatter plot (B). Phagocytic cells (neutrophils and monocytes combined) were identified and applied to a FITC histogram resulting in identification of negative (C) and positive (D) cells.
Lymphoid and monocytic populations were identified using forward versus side scatter plots. To isolate CD3+/CD4+, CD3+/CD8+, and CD21+ lymphoid cells, and HLA‐DR+ and TLR‐4+ monocytic cells, the appropriately gated populations were applied to a FITC versus PE scatter plot. The number of positive events were recorded. For the CD4+/CD25+/FoxP3+ T‐regulatory cells, lymphocytes were identified using a forward versus side scatter plot and then applied to a FITC versus PE scatter plot to identify a subgroup of CD4+/CD25+ cells. That population was then applied to a PE versus APC scatter plot to identify FoxP3 positive cells.
Statistical analysis was performed by commercially available software (Sigmaplot 13.00; Systat, San Jose, CA). Normality was assessed by histogram plots and a Shapiro–Wilk test. Variance was evaluated by a Brown‐Forsythe test. Data were compared between groups by a t‐test or Mann–Whitney Rank Sum Test for parametric and nonparametric data as indicated. A P‐value <0.05 was considered statistically significant.
Results
Population characteristics: The healthy control group included 6 spayed females and 9 castrated males for a total of 15 dogs with a mean ± SD age of 5 ± 3.2 years (range, 1–11 years). Breeds represented included 11 mixed breed dogs and 1 each of the following: Miniature Bull Terrier, Border Collie, Australian Shepherd, and Cairn Terrier.
Of 692 total dogs admitted to the ICU during the study period, 38 dogs met the study criteria as CI dogs. Of the 38 CI dogs, 24 were excluded for the following reasons: technical limitations (10), no owner consent (9), no clinician consent (4), and severe anemia (1). The remaining 14 dogs were enrolled into the CI group, which included 2 intact females, 1 intact male, 5 spayed females, and 6 castrated males with a mean ± SD age of 6 ± 4.1 years (range, 0.5–13 years). There was no statistical difference between the healthy control and the CI dogs with regard to age (P = 0.45). Breeds represented included 4 mixed breed dogs, 2 American Staffordshire Terriers, and 1 each of the following: Labrador Retriever, St. Bernard, Welsh Corgi, Siberian Husky, Longhaired Dachshund, Yorkshire Terrier, German Shorthaired Pointer, and Miniature Schnauzer. Diagnoses for the CI group included the following: postoperative gastrointestinal foreign body removal (3), hemorrhagic gastroenteritis (2), hepatic abscess (2), necrotic wound (1), parvovirus (1), pancreatitis (1), infectious lymphadenitis (1), aspiration pneumonia (1), traumatic pneumothorax (1), and bile peritonitis (1). The mean ± SD APPLEfast Score was 27 ± 5.6 points (range, 21–37 points) of a total of 50 possible points. The mean ± SD ICU hospitalization duration was 4.1 ± 2.6 days (range, 2–10 days); twelve dogs survived to discharge and 2 were euthanized.
Immunologic evaluation: LPS‐induced leukocyte production of TNF‐α (P = < 0.001), IL‐6 (P = 0.029), and IL‐10 (P = 0.014) was significantly less in the CI group compared to the healthy dogs (Fig 2). Additionally, unstimulated (PBS) leukocyte production of TNF‐α was reduced in the CI group compared to the healthy dogs (P = 0.011); there was no statistically significant difference in the unstimulated IL‐6 or IL‐10 production (P = 0.75 and P = 0.20, respectively).
Figure 2.
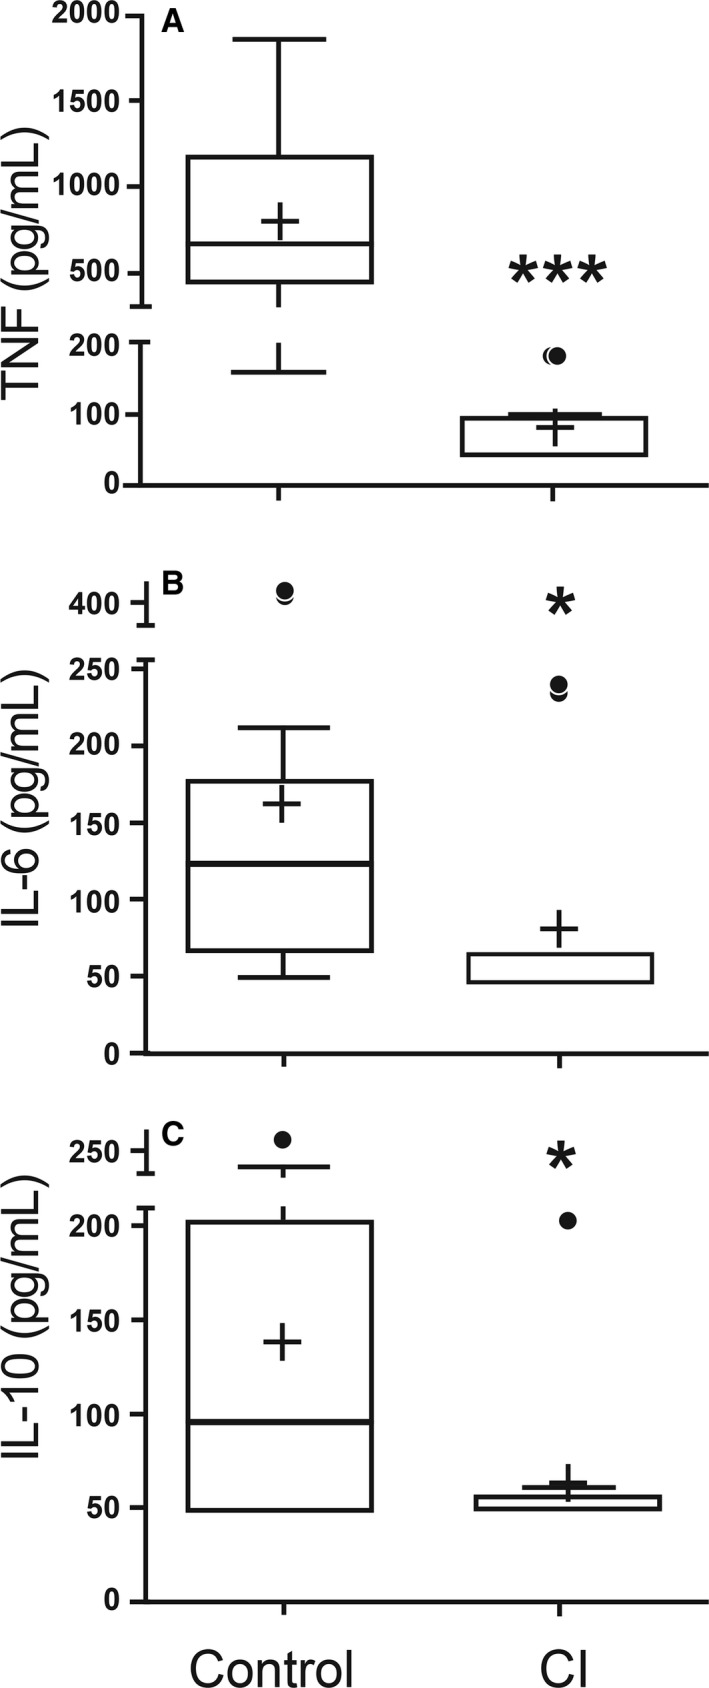
LPS‐stimulated leukocyte production of TNF? (A), IL‐6 (B) and IL‐10 (C) in healthy control dogs and critically ill (CI) dogs. Data are presented as the median (horizontal line) and mean (+), with the 25th and 75th quartiles in each box plot. The whiskers indicate the highest and lowest data points within 1.5× the length of the quartiles. The circles represent outliers; (*) indicates 0.05>P > 0.01; (***) indicates P < 0.001. Mann–Whitney ranked sum test.
There was no statistical difference in either the percentage of cells performing phagocytosis (P = 0.16) or the number of bacteria phagocytized (P = 0.31) between the CI dogs and the healthy dogs (Fig 3). Compared to phagocytic cells from healthy dogs, phagocytic cells from the CI group had a significant decrease in oxidative burst function stimulated both biologically with E. coli (P = 0.047) and chemically with PMA (P = < 0.001) (Fig 4). The MFI value for quantifying the amount of oxidative compounds generated per cell was also significantly decreased in the CI group stimulated both by E. coli (P = < 0.001) and PMA (P = < 0.001) (Fig 5) compared to the healthy dogs.
Figure 3.
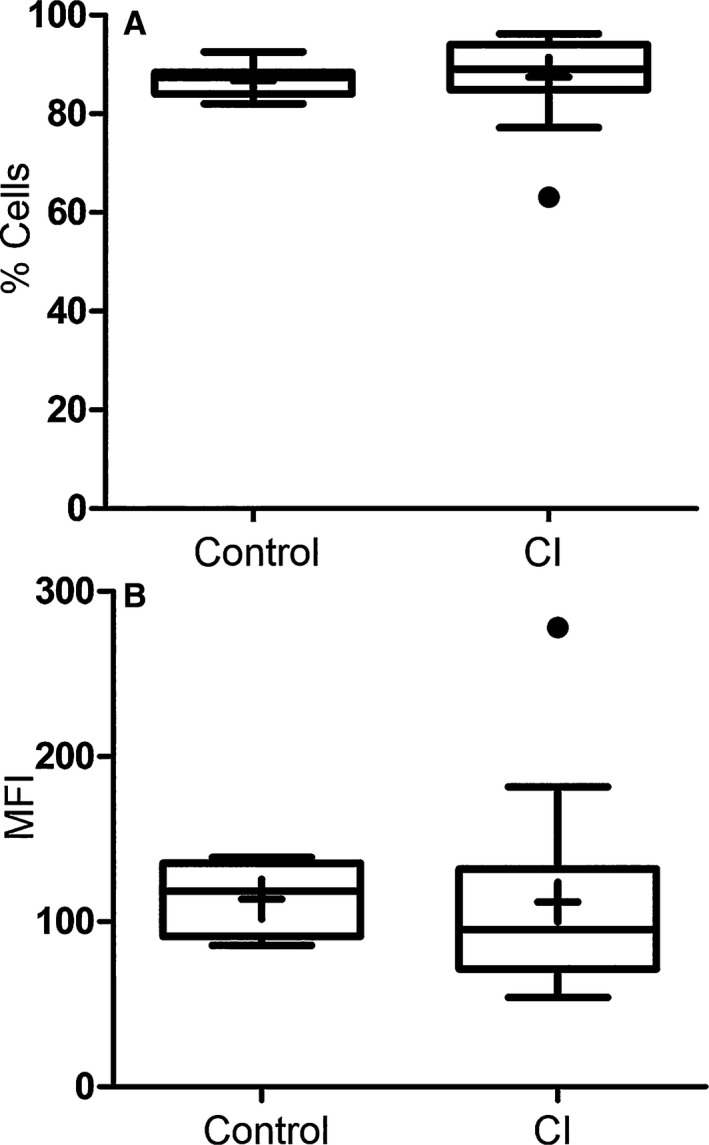
Percentage of phagocytic cells performing phagocytosis (A) and mean fluorescent intensity (MFI) of cells (B) in healthy control versus critically ill (CI) dogs after incubation with FITC‐labeled E. coli. Data are presented as the median (horizontal line) and mean (+), with the 25th and 75th quartiles in each box plot. The whiskers indicate the highest and lowest data points within 1.5× the length of the quartiles. The circles represent outliers. There was no significant difference in either dataset (P = 0.16 and P = 0.31, respectively). Mann–Whitney ranked sum test.
Figure 4.

Percentage of cells performing respiratory burst function in healthy control versus critically ill (CI) dogs after stimulation with E. coli and PMA. Data are presented as the median (horizontal line) and mean (+), with the 25th and 75th quartiles in each box plot. The whiskers indicate the highest and lowest data points within 1.5× the length of the quartiles. The circles represent outliers; (*) indicates 0.05>P > 0.01; (***) indicates P < 0.001. Mann–Whitney ranked sum test.
Figure 5.
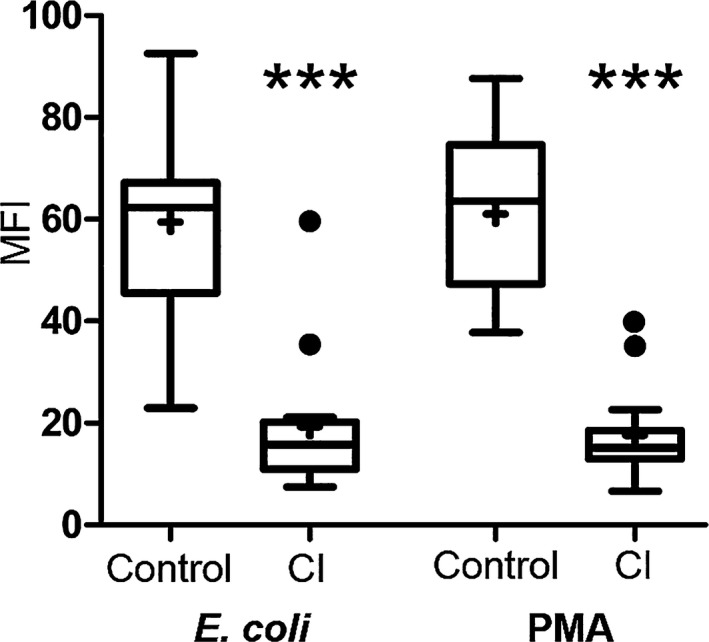
Mean fluorescent intensity (MFI) of cells in healthy control versus critically ill (CI) dogs after stimulation with E. coli and PMA. Data are presented as the median (horizontal line) and mean (+), with the 25th and 75th quartiles in each box plot. The whiskers indicate the highest and lowest data points within 1.5× the length of the quartiles. The circles represent outliers; (***) indicates P < 0.001. Mann–Whitney ranked sum test.
No statistical difference was noted between the healthy controls and the CI dogs in the percentage of cells expressing CD3+/CD4+, CD3+/CD8+, CD21+, or CD4+/CD25+/FoxP3+ (P = 0.24, 0.98, 0.077, 0.79, respectively) (Fig 6). There was a significant increase in the percentage of monocytic cells expressing TLR‐4 alone (P = 0.005) as well as co‐expressing HLA‐DR and TLR‐4 (P = 0.003) in the CI group (Fig 7).
Figure 6.
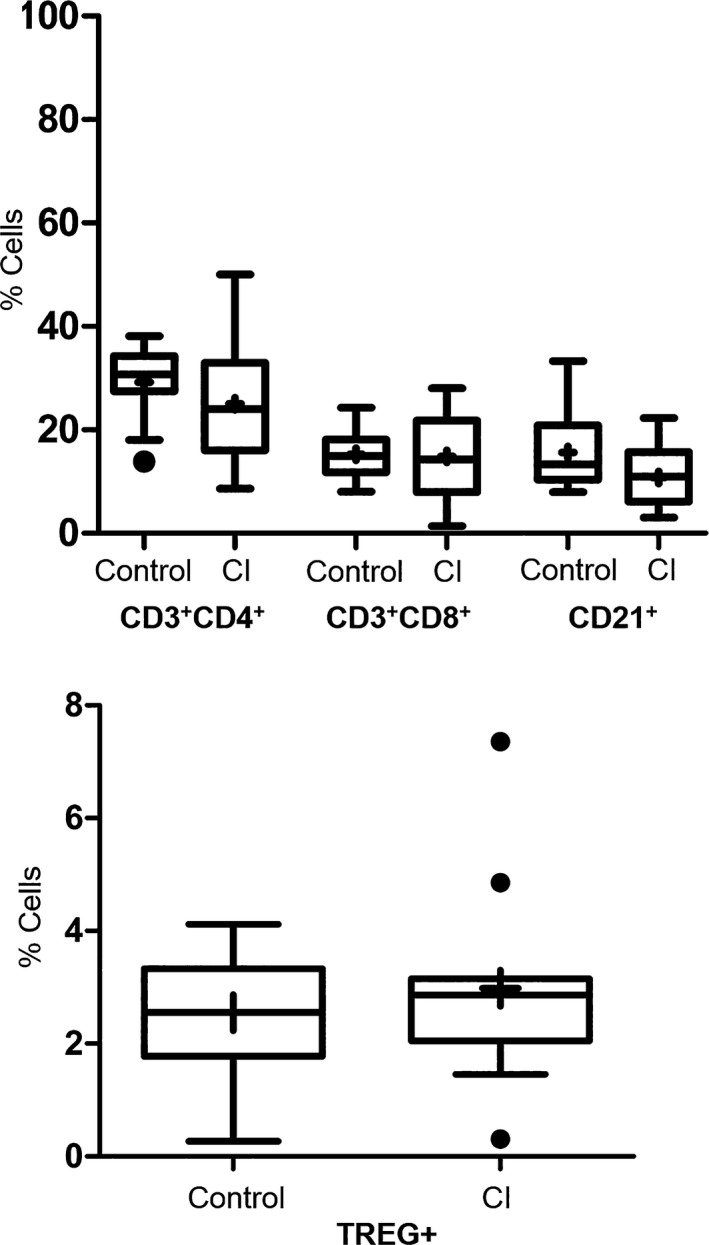
Percentage of lymphoid cells expressing various surface markers (CD4+/CD8+ T cells, CD21+ B cells and CD4+/CD25+/FoxP3+ T regulatory cells [TREG+]) in healthy control versus critically ill (CI) dogs. There were no significant differences in these cell populations (P = 0.24, 0.98, 0.08, 0.79, respectively). Data are presented as the median (horizontal line) and mean (+), with the 25th and 75th quartiles in each box plot. The whiskers indicate the highest and lowest data points within 1.5× the length of the quartiles. The circles represent outliers. Mann–Whitney ranked sum test.
Figure 7.
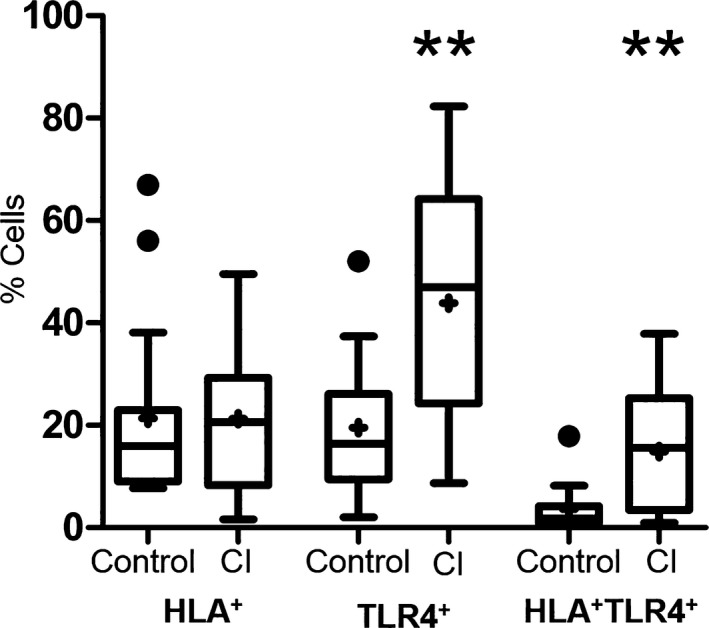
Percentage of cells expressing HLA‐DR and TLR‐4 surface markers on monocytes in healthy control versus critically ill (CI) dogs. There was no significant difference in monocytes expressing HLA‐DR (P = 0.743); however, there was a significant increase in the number of monocytes expressing TLR‐4 as well as co‐expression of HLA and TLR‐4 in the CI dogs. Data are presented as the median (horizontal line) and mean (+), with the 25th and 75th quartiles in each box plot. The whiskers indicate the highest and lowest data points within 1.5× the length of the quartiles. The circles represent outliers. Mann–Whitney ranked sum test; (**) indicates 0.01>P > 0.001.
Serial CI group samples: Evaluation of immune function 48 hours after initial sample to analyze fluctuations in immune response was obtained in 5 out of the 14 total CI dogs. Reasons for failure to acquire this second sample from the remaining 9 CI dogs included as follows: technical difficulties (3), discharged from hospital (2), euthanized (2), and lack of primary clinician consent (2). Due to the low number of repeated samples, no comparative statistical analyses were performed, and instead descriptive statistics were used (Figs 8, 9, 10).
Figure 8.
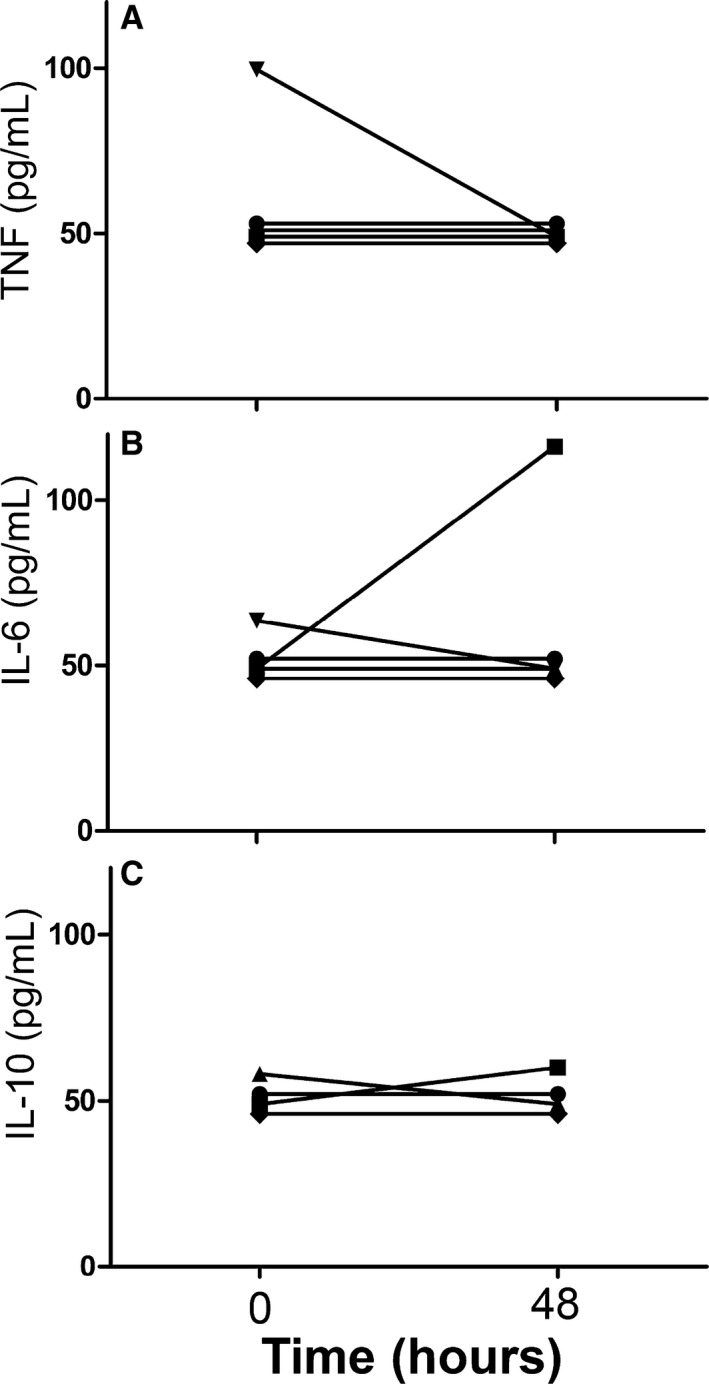
Data from 5 of 14 critically ill dogs demonstrating the changes seen over time (0 = initial sample collection; 48 = second sample collected approximately 48 hours later) in LPS‐stimulated leukocyte production of TNF (A), IL‐6 (B) and IL‐10 (C).
Figure 9.
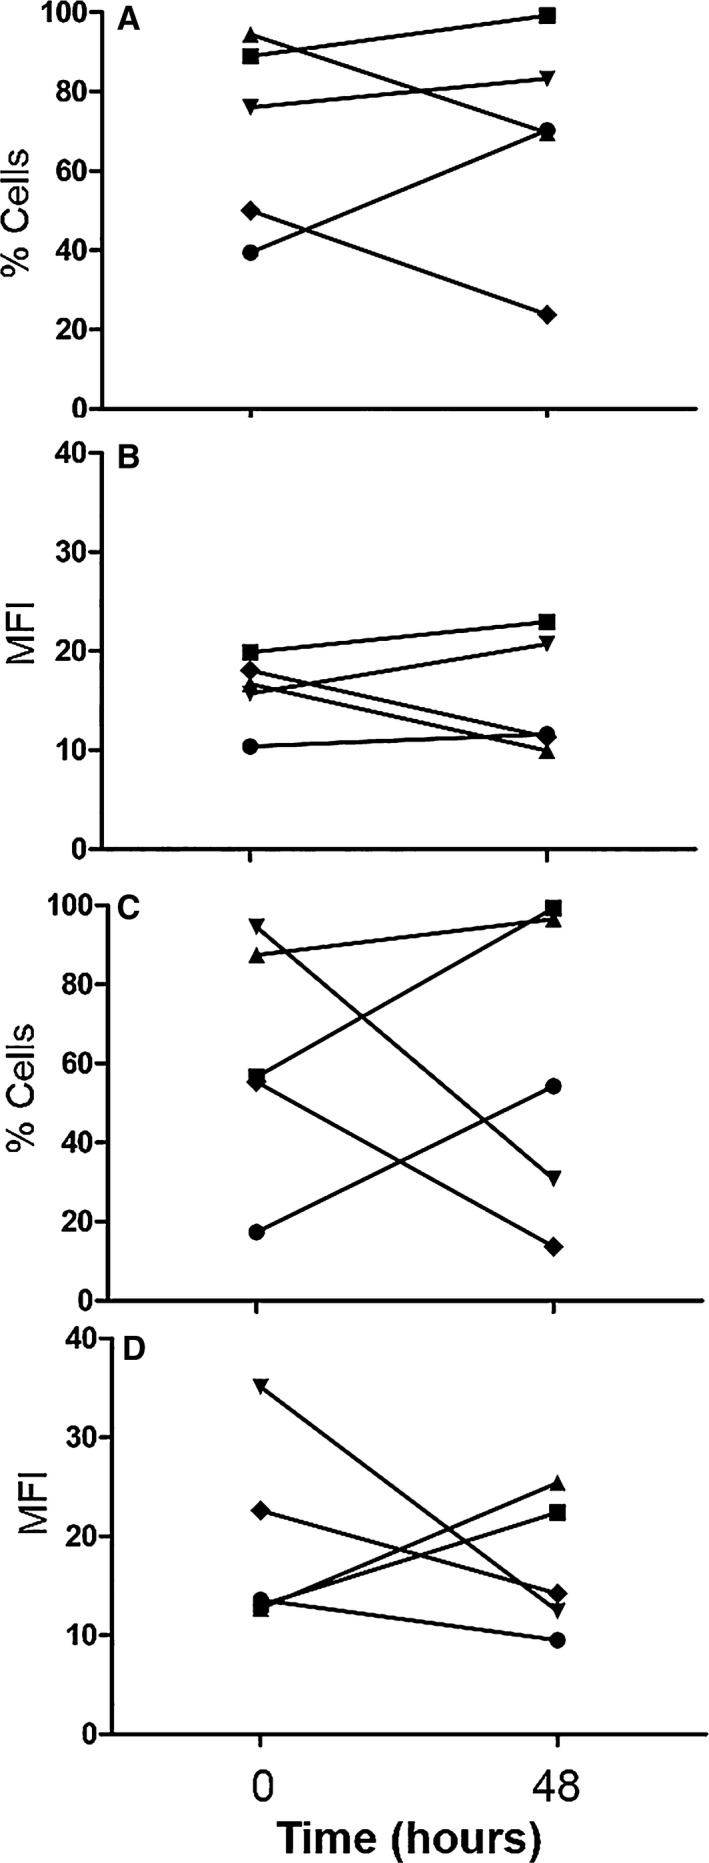
Data from 5 of 14 critically ill dogs demonstrating the changes seen over time (0 = initial sample collection; 48 = second sample collected approximately 48 hours later) in the percentage of phagocytic cells performing respiratory burst function after stimulation with E. coli (A), the mean fluorescent intensity (MFI) of phagocytic cells after stimulation with E. coli (B), the percentage of phagocytic cells performing respiratory burst function after stimulation with PMA (C), and the mean fluorescent intensity (MFI) of phagocytic cells after stimulation with PMA (D).
Figure 10.
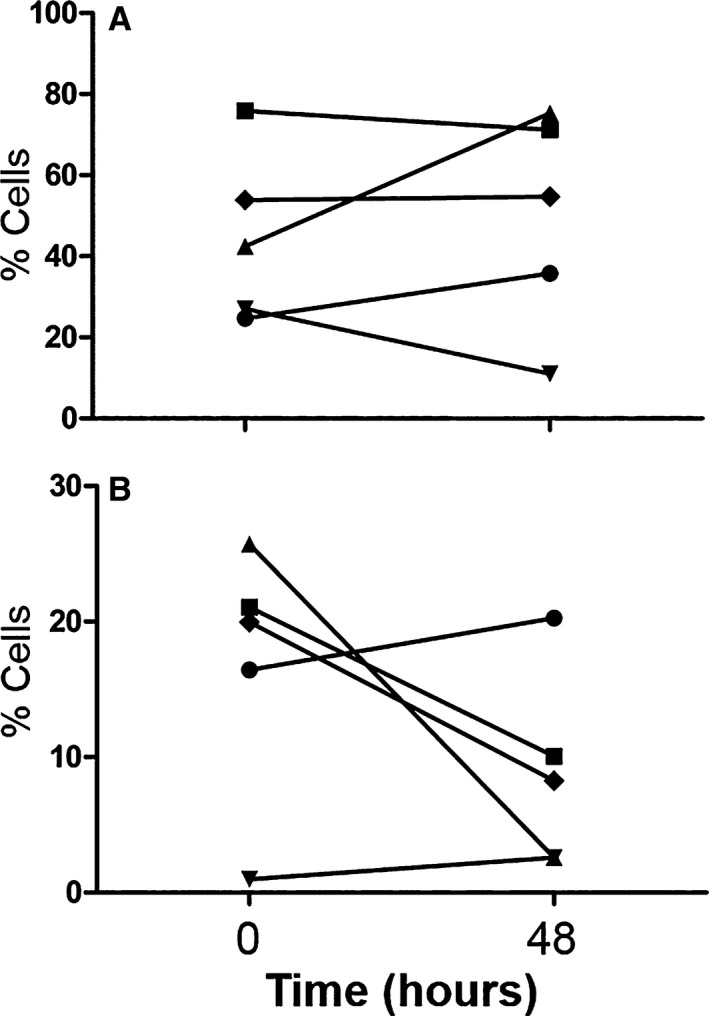
Data from 5 of 14 critically ill dogs demonstrating the changes seen over time (0 = initial sample collection; 48 = second sample collected approximately 48 hours later) in the percentage of cells expressing TLR‐4 (A) and both HLA‐DR and TLR‐4 surface markers (B) on monocytes.
Discussion
Differences in the immune response between dogs with CI and healthy controls were identified in this study. The CI dogs in this study had reduced respiratory burst capacity and reduced LPS‐stimulated leukocyte production of TNF‐α, IL‐6, and IL‐10 compared to healthy dogs, which is similar to the immunologic changes associated with CI‐induced immune dysfunction in humans. The CI group also had an increased percentage of monocytic cells expressing the surface receptor TLR‐4, a pattern recognition receptor (PRR) that recognizes LPS and other molecular patterns.
Typically in dogs, mice and humans, exposure of leukocytes to LPS causes an early, dramatic increase in pro‐inflammatory TNF‐α and IL‐6 production and an almost simultaneous increase in anti‐inflammatory IL‐10 production.12, 21, 22 TNF‐α and IL‐6 production decreases over time unless an additional inflammatory stimulus is provided. IL‐10 production is more variable and could increase or decrease depending on the stimulus and species over time.8 Decreased LPS‐induced production of TNF‐α, IL‐6, and IL‐10 has been identified in people with SIRS/sepsis. One possible explanation for this observation includes the development of endotoxin tolerance.5, 8, 23 Endotoxin tolerance is characterized by the development of immunosuppression as a result of the diminished response of various immune cells that have been primed, then re‐exposed to LPS. Aspects of this response include reductions in cytokine production and oxidative burst function.8 A similar pattern of cytokine and respiratory burst suppression was identified in our study.
Other mechanisms of endotoxin tolerance in humans include disruptions in the signaling pathways of TLR‐4 as well as decreased HLA‐DR expression.8 As a PRR, the primary function of TLR‐4 is to recognize lipid structures from invading organisms, most notably LPS. Upon binding of LPS, TLR‐4 is activated to recruit the myeloid differentiation primary response protein 88 (MYD88) which subsequently induces the production of a variety of cytokines, including TNF‐α, IL‐6, and IL‐10, through various DNA transcription factors.8 Whereas the expression of TLR‐4 on the surface of monocytes increased in the CI dogs, cytokine production after stimulation of TLR‐4 was reduced, suggesting an alteration in downstream signaling cascades as observed with endotoxin tolerance. The exact mechanism for HLA‐DR expression downregulation with endotoxin tolerance in people is incompletely understood; however, it is speculated that IL‐10 likely plays a role. IL‐10 suppresses the expression of HLA‐DR by reducing transport of the receptor to the plasma membrane via several mechanisms.24, 25 In this study, the CI dogs showed downregulation of stimulated production of IL‐10, but no change in the expression of HLA‐DR. Given this finding, it appears that alterations to monocytic cells in CI dogs do not entirely mimic that of humans with endotoxin tolerance.
Oxidative burst function is reduced in mice and humans with SIRS/sepsis.8, 26 Dogs with sepsis also have decreased immune complex‐induced, Fc‐receptor‐mediated oxidative burst compared to healthy dogs.1 Similarly, ROS production in phagocytes from the CI dogs in this study was decreased in both Fc‐receptor‐mediated and protein kinase C pathways. This finding indicates a dysfunction in a later stage of signaling where the pathways intersect, such as in the subunits of the nicotinamide adenine dinucleotide phosphate (NADPH) oxidase complex.27
Depletion of CD4+ and CD8+ T cells and B cells through apoptosis in humans and animal models of CI‐induced immunosuppression has been illustrated in several studies.9, 28, 29 No significant differences were identified in the circulating lymphoid populations in dogs with CI as was expected based on findings in humans. The data generated in this study suggest that lymphoid cells play a minor role in the development of immune dysfunction in dogs with CI. However, the small sample population and heterogeneous etiologies of the CI dogs in this study complicates the interpretation of the data and therefore the possibility of lymphoid apoptosis as a contributing factor in immunosuppression cannot be eliminated. Additionally, circulating lymphoid cell populations might not accurately reflect what is occurring within tissues. Evaluation of various tissues for the presence and subgroup of lymphoid cells and subsequent comparison with circulating lymphoid populations could provide further insight as to the role of adaptive immunity in CI dogs.
Increased numbers of circulating T‐regulatory cells have been noted in humans with SIRS/sepsis.30 An experimental model of endotoxemia in dogs illustrated a transient decrease followed by progressive increase in circulating T‐regulatory cells over a 7 day time span after intravenous injection of LPS.31 No significant difference was noted in the T‐regulatory cell percentages between the CI and healthy control dogs in this study; therefore, the importance and role of T‐regulatory cells in the immune response in CI dogs remain uncertain.
Evaluation of the paired blood samples obtained from 5 of the 14 CI dogs indicated moderate variability in the majority of the variables over time (Figs 8, 9, 10). With regard to surface marker expression, phagocytosis and respiratory burst function, values increased in some dogs and decreased in others over the 48 hours between sample collections. This could be reflective of the various etiologies and stages of disease within the CI group.
There were several limitations in this study. The sample size was small, and dogs in the CI group were heterogeneous in respect to their disease processes. There were few dogs that had repeated sampling and we were unable to demonstrate normalization of immune function when the dogs recovered from illness. Future studies should evaluate if these immune changes resolve with clinical improvement. Given the small sample size, we were unable to correlate immune function and outcomes such as development of secondary infection or death. Understanding the effects of these immunologic changes in the context of outcome would be clinically useful information and future studies should investigate these potential connections.
Acknowledgments
Generous thanks to Dr Hans Rindt and Gabrielle Melillo for their technical assistance.
Conflict of Interest Declaration
Authors declare no conflict of interest.
Off‐label Antimicrobial Declaration
Authors declare no off‐label use of antimicrobials.
Financial assistance: Financial assistance for this study was provided by the University of Missouri.
Presentations: The information in this manuscript was presented as a “Research Snapshot Presentation” at the 2017 Society of Critical Care Medicine Annual Congress in Honolulu, HI.
References
- 1. Webb C, McCord K, Dow S. Neutrophil function in septic dogs. J Vet Intern Med 2007;21:982–989. [DOI] [PubMed] [Google Scholar]
- 2. Johnson V, Burgess B, Morley P, et al. Comparison of cytokine responses between dogs with sepsis and dogs with immune‐mediated hemolytic anemia. Vet Immunol Immunopathol 2016;1:15–20. [DOI] [PubMed] [Google Scholar]
- 3. DeClue AE, Sharp CR, Harmon M. Plasma inflammatory mediator concentrations at ICU admission in dogs with naturally developing sepsis. J Vet Intern Med 2012;26:624–630. [DOI] [PubMed] [Google Scholar]
- 4. Rau S, Kohn B, Richter C, et al. Plasma interleukin‐6 response is predictive for severity and mortality in canine systemic inflammatory response syndrome and sepsis. Vet Clin Pathol 2007;36:253–260. [DOI] [PubMed] [Google Scholar]
- 5. Boomer JS, To K, Chang KC, et al. Immunosuppression in patients who die of sepsis and multiple organ failure. J Am Med Assoc 2011;306:2594–2605. [DOI] [PMC free article] [PubMed] [Google Scholar]
- 6. Aziz M, Jacob A, Wang WL, et al. Current Trends in inflammatory and immunomodulatory mediators in sepsis. J Leukocyte Biol 2013;93:329–342. [DOI] [PMC free article] [PubMed] [Google Scholar]
- 7. Hutchins NA, Unsinger J, Hotchkiss RS, Ayala A. The new normal: Immunomodulatory agents against sepsis immune suppression. Trends Mol Med 2014;20:224–233. [DOI] [PMC free article] [PubMed] [Google Scholar]
- 8. Biswas SK, Lopez‐Collazo E. Endotoxin tolerance: New mechanisms, molecules and clinical significance. Trends Immunol 2009;30:475–487. [DOI] [PubMed] [Google Scholar]
- 9. Hotchkiss RS, Monneret G, Payen D. Sepsis‐induced immunosuppression: From cellular dysfunctions to immunotherapy. Nat Rev Immunol 2013;13:862–874. [DOI] [PMC free article] [PubMed] [Google Scholar]
- 10. Wiersinga WJ, Leopold SJ, Cranendonk DR, van der Poll T. Host innate immune response to sepsis. Virulence 2014;5:36–44. [DOI] [PMC free article] [PubMed] [Google Scholar]
- 11. Hayes G, Mathews K, Doig G, et al. The acute patient physiologic and laboratory evaluation (APPLE) score: A severity of illness stratification system for hospitalized dogs. J Vet Intern Med 2010;24:1034–1047. [DOI] [PubMed] [Google Scholar]
- 12. Deitschel SJ, Kerl ME, Chang CH, DeClue AE. Age‐associated changes to pathogen‐associated molecular pattern‐induced inflammatory mediator production in dogs. J Vet Emerg Crit Care 2010;20:494–502. [DOI] [PubMed] [Google Scholar]
- 13. DeClue AE, Nickell J, Chang CH, Honaker A. Upregulation of pro‐inflammatory cytokine production in response to bacterial pathogen‐associated molecular patterns in dogs with diabetes mellitus undergoing insulin therapy. J Diabetes Sci Technol 2012;6:496–502. [DOI] [PMC free article] [PubMed] [Google Scholar]
- 14. DeClue AE, Yu DH, Prochnow S, et al. Effects of opioids on phagocytic function, oxidative burst capacity, cytokine production and apoptosis in canine leukocytes. Vet J 2014;200:270–275. [DOI] [PubMed] [Google Scholar]
- 15. Karlsson I, Hagman R, Johannisson A, et al. Cytokines as immunological markers for systemic inflammation in dogs with pyometra. Reprod Domest Anim 2012;47:337–341. [DOI] [PubMed] [Google Scholar]
- 16. Axiak‐Bechtel S, Fowler B, Yu DH, et al. Chemotherapy and remission status do not alter pre‐existing innate immune dysfunction in dogs with lymphoma. Res Vet Sci 2014;97:230–237. [DOI] [PubMed] [Google Scholar]
- 17. Axiak‐Bechtel SM, Tsuruta K, Amorim J, et al. Effects of tramadol and o‐desmethyltramadol on canine innate immune system function. Vet Anaesth Anal 2015;42:260–268. [DOI] [PubMed] [Google Scholar]
- 18. Cohn LA, DeClue AE, Reinero CR. Endocrine and immunologic effects of inhaled fluticasone propionate in healthy dogs. J Vet Intern Med 2008;22:37–43. [DOI] [PubMed] [Google Scholar]
- 19. Zhang Y, Axiak‐Bechtel S, Friedman‐Cowan C, et al. Evaluation of immunomodulatory effect of recombinant human granulocyte‐macrophage colony‐stimulating factor on polymorphonuclear cell from dogs with cancer in vitro. Vet Comp Oncol 2017;15:968–979. [DOI] [PubMed] [Google Scholar]
- 20. Rissetto KC, Rindt H, Selting KA, et al. Cloning and expression of canine CD25 for validation of an anti‐human CD25 antibody to compare T regulatory lymphocytes in healthy dogs and dogs with osteosarcoma. Vet Immunol Immunopathol 2010;135:137–145. [DOI] [PubMed] [Google Scholar]
- 21. Cavaillon JM, Adib‐Conquy M. Bench‐to‐bedside review: Endotoxin tolerance as a model of leukocyte reprogramming in sepsis. Crit Care 2006;10:233. [DOI] [PMC free article] [PubMed] [Google Scholar]
- 22. Medvedev AE, Kopydlowski KM, Vogel SN. Inhibition of lipopolysaccharide‐induced signal transduction in endotoxin‐tolerized mouse macrophages: Dysregulation of cytokine, chemokine, and toll‐like receptor 2 and 4 gene expression. J Immunol 2000;164:5564–5574. [DOI] [PubMed] [Google Scholar]
- 23. Draisma A, Pickkers P, Bouw M, van der Hoeven JG. Development of endotoxin tolerance in humans in vivo. Crit Care Med 2009;37:1261–1267. [DOI] [PubMed] [Google Scholar]
- 24. Couper KN, Blount DG, Riley EM. IL‐10: The master regulator of immunity to infection. J Immunol 2008;180:5771–5777. [DOI] [PubMed] [Google Scholar]
- 25. Koppelman B, Neefjes JJ, de Vries JE, de Waal MR. Interleukin‐10 down‐regulates MHC class II alphabeta peptide complexes at the plasma membrane of monocytes by affecting arrival and recycling. Immunity 1997;7:861–871. [DOI] [PubMed] [Google Scholar]
- 26. Nathan C, Cunningham‐Bussel A. Beyond oxidative stress: An immunologist's guide to reactive oxygen species. Nat Rev Immunol 2013;13:349–361. [DOI] [PMC free article] [PubMed] [Google Scholar]
- 27. Hurst NP. Molecular basis of activation and regulation of the phagocyte respiratory burst. Ann Rheum Dis 1987;46:265–272. [DOI] [PMC free article] [PubMed] [Google Scholar]
- 28. Schwulst SJ, Muenzer JT, Chang KC, et al. Lymphocyte phenotyping to distinguish septic from nonseptic critical illness. J Am Coll Surg 2008;206:335–342. [DOI] [PubMed] [Google Scholar]
- 29. Lang JD, Matute‐Bellocorres G. Lymphocytes, apoptosis and sepsis: Making the jump from mice to humans. Crit Care 2009;13:109. [DOI] [PMC free article] [PubMed] [Google Scholar]
- 30. Cao C, Ma T, Chai Y, Shou S. The role of regulatory T cells in immune dysfunction during sepsis. World J Emerg Med 2015;6:5–9. [DOI] [PMC free article] [PubMed] [Google Scholar]
- 31. Yu D, Kim J, Park C, Park J. Serial changes of CD4 + CD25 + FoxP3 + regulatory T cell in canine model of sepsis induced by endotoxin. J Vet Med Sci 2014;76:777–780. [DOI] [PMC free article] [PubMed] [Google Scholar]


