

Abstract
Background
Demographic changes have led to an increase in the number of elderly frail persons and, consequently, systematic geriatric assessment is more important than ever. Frailty Indexes (FI) may be particularly useful to discriminate between various degrees of frailty but are not routinely assessed due, at least in part, to the large number of deficits assessed (from 30 to 70). Therefore, we have developed a new, more concise FI for rapid geriatric assessment (RGA)—the Frail-VIG index (“VIG” is the Spanish/Catalan abbreviation for Comprehensive Geriatric Assessment), which contains 22 simple questions that assess 25 different deficits. Here we describe this FI and report its ability to predict mortality at 24 months.
Methods
Prospective, observational, longitudinal study of geriatric patients followed for 24 months or until death. The study participants were patients (n = 590) admitted to the Acute Geriatric Unit at the at the University Hospital of Vic (Barcelona) during the year 2014. Participants were classified into one of seven groups based on their Frail-VIG score (0–0.15; 0.16–0.25; 0.26–0.35; 0.36–0.45; 0.46–0.55; 0.56–0.65; and 0.66–1). Survival curves for these groups were compared using the log-rank test. ROC curves were used to assess the index’s capacity to predict mortality at 24 months.
Results
Mean (standard deviation) patient age was 86.4 (5.6) years. The 24-month mortality rate was 57.3% for the whole sample. Significant between-group (deceased vs. living) differences (p < 0.05) were observed for most index variables. Survival curves for the seven Frail-VIG groups differed significantly (X2 = 433.4, p < 0.001), with an area under the ROC curve (confidence interval) of 0.90 (0.88–0.92) at 12 months and 0.85 (0.82–0.88) at 24 months. Administration time for the Frail-VIG index ranged from 5 to 10 min.
Conclusions
The Frail-VIG index, which requires less time to administer than previously validated FIs, presents a good discriminative capacity for the degree of frailty and a high predictive capacity for mortality in the present cohort. Although more research is needed to confirm the validity of this instrument in other populations and settings, the Frail-VIG may provide clinicians with a RGA method and also a reliable tool to assess frailty in routine practice.
Electronic supplementary material
The online version of this article (10.1186/s12877-018-0718-2) contains supplementary material, which is available to authorized users.
Keywords: Frail elderly, Frailty index, Geriatric assessment, Multimorbidity, Mortality
Background
Frailty is considered a clinical state in which the individual is more vulnerable to becoming dependent and/or in which there is a higher risk of death if exposed to a stressor [1]. Together with multimorbidity, frailty is one of the most common chronic conditions in the adult population [2], and both are closely associated with adverse health outcomes [3–5]. Despite controversies surrounding the optimum operational definition of frailty, there is a strong consensus among clinicians that frailty should be evaluated whenever feasible [6–8]. Two complementary approaches to assessing frailty that may be useful in different circumstances and for different purposes are Fried’s frailty syndrome approach [9, 10], which may be particularly useful for population screening to identify pre-disability states [11], and Rockwood’s deficit accumulation model [12], which views frailty as a continuum, and which may be particularly useful to discriminate between various degrees of frailty [13].
A wide variety of frailty indices (FIs) have been developed [3, 4, 12, 14, 15] -with the main differences among them being the number of domains [16] and deficits assessed (from 30 to 70 deficits) [12]. In most FIs, the probability of dying increases exponentially as the rate of deficit accumulation increases [14, 17–20]. Current FIs assess frailty on a scale ranging from 0 to 1, with scores from 0.2 [15] to 0.25 [21] indicating frailty. A score of 0.7 is usually considered the cut-off point to indicate that homeostasis has reached its limit and thus any additional deficits would likely result in death [16, 22]. The multidimensional nature of FIs is a characteristic that these instruments share with comprehensive geriatric assessment (CGA). Indeed, the close relation between FIs and CGA is not new: a study published in 2004 demonstrated that it was both clinically justified and operationally feasible to develop an FI based on geriatric assessment (FI-CGA) [23].
Despite the growing number of elderly persons with multimorbidity and frailty [24–26], which implies a need for healthcare providers to make geriatric assessment a routine part of healthcare delivery [27], the use of a complete CGA and/or FIs remain underutilized in many settings [28]. One of the main reasons for this lack of widespread adoption, particularly in the context of acute care hospitals [29–32], could be the amount of time needed to administer these instruments [14]. In this context, and given the importance of performing a situational diagnosis/assessment of the degree of frailty as the starting point for individualized decision-making [33], newer, more pragmatic and faster multidimensional tools are needed [34].
Aims
Based on the multidimensional approach of the CGA and inspired by the simplicity and potential universal applicability of the Rapid Geriatric Assessment (RGA) [34], together with the known value of the FI methodology, we have developed a new FI called the “Frail-VIG index” (VIG is the Spanish/Catalan abbreviation for CGA). In the present observational study, we prospectively applied the Frail-VIG index to 590 patients admitted to the Acute Geriatric Unit (AGU) at the University Hospital of Vic (Barcelona, Spain) to determine the instrument’s capacity to predict mortality at 24 months.
Methods
Study design
This was a prospective, observational, longitudinal study.
Context and participants
The study was conducted at the University Hospital of Vic (Barcelona; Spain), a 200-bed acute care hospital covering a population area of 156,000 inhabitants. All patients admitted to the AGU during the year 2014 were included. Admission criteria to the AGU were: 1) age ≥ 85 years; or 2) cognitive decline; or 3) the presence of advanced chronic conditions identified by the NECPAL (NECesidades PALiativas, in Spanish; Palliative Care Needs, in English) test [35], a validated tool for the early diagnosis of the need for palliative care among individuals with limited life expectancy. No exclusion criteria were defined.
Design and evaluation of the frail-VIG index
To design the most pragmatic instrument possible, the Frail-VIG index was constructed using only variables recorded during the usual clinical evaluation process—as opposed to variables collected as part of an epidemiological study, which is how most other FIs were developed [12, 15, 18, 36, 37]. In our department, the original aim was to systematically perform a CGA for all patients; to achieve this, all health care professionals in the department agreed by consensus to create a checklist that included 40 multidimensional variables. Subsequently, given the need for a quantifiable RGA for decision-making at our acute care hospital [33], a proposal was made to reduce the number of variables, prioritizing those variables with the strongest prognostic capacity for mortality [38].
In the development of the Frail-VIG index, rather than comparing the index to a “gold standard” instrument, we sought to replicate the characteristics of a previously validated instrument [3, 4, 12, 14, 15] and then we evaluated its predictive ability [39]. Our development process focused on two main areas: 1) variable selection and construct development, and 2) demonstration of the predictive validity for mortality. The design of the Frail-VIG index has been previously described [40].
Variable selection and construct development
Published recommendations [15] suggest that all variables included in a FI must have the following characteristics: 1) prevalence of the variable must increase with age and be associated with health problems; 2) it should not saturate too early; 3) it should not be excessively prevalent (> 80% of individuals ≥ age 85) or rare (< 1%); and 4) the variable should cover a range of systems and domains. To ensure the inclusion of variables from a content validation process, we used a multidimensional approach [4] in which we compared the number of variables from each domain relative to the total number of variables for the following five validated FIs and/or multidimensional prognostic tools: the CSHA-FI70 (Original Canadian Study of Health and Aging–Frailty Index) [12], the CSHA-FI40 (Searle version of Canadian Study of Health and Aging–Frailty Index) [15], the FI-CGA [23], the SHARE-FI (Survey of Health, Ageing and Retirement in Europe-Frailty Index) [41], and the MPI (Multidimensional Prognostic Index) [42] (Additional file 1). It is also advisable that the proportion of missing data be < 5% [43].
Theoretically, all FIs should include a minimum number of functional deficits (ranging from 30 to 40) to maintain their predictive capacity [15]; however, by selecting variables according to severity and progression criteria [33] and grouping some of these together (especially on the functional and cognitive domains), we were able to limit the Frail-VIG index to only 22 questions assessing 25 deficits. Like other FIs, the Frail-VIG index is obtained by dividing the accumulated deficits by the total number of potential deficits, for a score ranging from 0.0 (no deficits) to 1.0 (all possible deficits).
Other requirements for the Frail-VIG index was that it meet or exceed the characteristics of existing FIs [4, 16] in terms of the submaximal limit for the FI score (99% of individuals with an FI < 0.7) [16, 22] and the asymmetric distribution density of FI scores [44], and that the score be closely correlated with mortality [14, 17].
Predictive validity
In order to demonstrate the predictive validity of the index, the study design included a two-year follow-up period. We determined final outcomes (living, deceased, or lost to follow up) at month 24 using only data information systems via the Shared Medical Record in Catalonia (HC3) [45], an electronic database accessible to all healthcare providers in Catalonia that allows for healthcare professionals to reliably determine whether the patient is “active” (alive) or deceased (including date of death).
Variables and data sources
The variables included in Frail-VIG index are shown in Table 1. These variables evaluate the following domains: money, telephone and medication management—all of which are common instrumental activities of daily living (ADL); weight loss ≥5% in the last 6 months is considered a marker of nutritional worsening; emotional markers include the presence of depressive syndrome or insomnia/anxiety; the subjective perception of social vulnerability by the health care team is considered an indicator for the social domain. The following geriatric syndromes are assessed: delirium, falls, polypharmacy, and dysphagia. Symptoms with severity criteria include pain and dyspnea. Finally, the presence of chronic diseases (cancer, respiratory, cardiac, neurological, digestive, and renal disease) are also recorded.
Table 1.
Description and characteristics of the Frail-VIG index
| Domain | Variable | Description | Points | ||
|---|---|---|---|---|---|
| Functional | IADLs | Money management | Needs help managing financial matters (bank, shops, restaurants) | Yes | 1 |
| No | 0 | ||||
| Telephone use | Needs help using the telephone | Yes | 1 | ||
| No | 0 | ||||
| Medication management | Needs assistance in preparing or administering medications | Yes | 1 | ||
| No | 0 | ||||
| ADLs | Barthel index (BI) | No dependency (BI ≥ 95) | 0 | ||
| Mild-moderate dependency (BI 90–65) | 1 | ||||
| Moderate-severe dependency (BI 60–25) | 2 | ||||
| Absolute dependency (BI ≤ 20) | 3 | ||||
| Nutritional | Malnutrition | Weight loss ≥ 5% in the last 6 months | Yes | 1 | |
| No | 0 | ||||
| Cognitive | Degree of cognitive impairment | No cognitive impairment | 0 | ||
| Mild-moderate cognitive impairment (equivalent to GDS ≤ 5) | 1 | ||||
| Severe-very severe cognitive impairment (equivalent to GDS ≥ 6) | 2 | ||||
| Emotional | Depressive syndrome | Need for antidepressant medication | Yes | 1 | |
| No | 0 | ||||
| Insomnia/anxiety | Frequent need for benzodiazepines or other psychiatric drugs with a sedative effect for insomnia/anxiety | Yes | 1 | ||
| No | 0 | ||||
| Social | Social vulnerability | Do health care professionals perceive the presence of social vulnerability? | Yes | 1 | |
| No | 0 | ||||
| Geriatric syndromes | Delirium | Presence of delirium and/or behaviour disorder requiring antipsychotic drugs in the last 6 months. | Yes | 1 | |
| No | 0 | ||||
| Falls | In the last 6 months , ≥2 falls or hospitalization due to a fall. | Yes | 1 | ||
| No | 0 | ||||
| Ulcers | Presence of ulcer (pressure or vascular, any grade) | Yes | 1 | ||
| No | 0 | ||||
| Polypharmacy | Taking ≥ 5 drugs | Yes | 1 | ||
| No | 0 | ||||
| Dysphagia | Difficulty swallowing when eating or drinking? Presence of aspiration respiratory infections during the last 6 months ? | Yes | 1 | ||
| No | 0 | ||||
| Severe symptoms | Pain | Need for ≥ 2 conventional analgesics and/or strong opioids for pain control | Yes | 1 | |
| No | 0 | ||||
| Dyspnea | Basal dyspnea impeding the ability to leave the house and/or opioids are frequently needed | Yes | 1 | ||
| No | 0 | ||||
| Diseases (+) | Cancer | Active cancer | Yes | 1 | |
| No | 0 | ||||
| Respiratory | Presence of any type of chronic respiratory disease (COPD, restrictive lung disease...) | Yes | 1 | ||
| No | 0 | ||||
| Cardiac | Presence of any type of chronic heart disease (heart failure, ischemic cardiomyopathy, arrhythmia) | Yes | 1 | ||
| No | 0 | ||||
| Neurological | Presence of any type of neurodegenerative disease (Parkinson, ALS,...) or a history of stroke (ischemic or hemorrhagic). | Yes | 1 | ||
| No | 0 | ||||
| Digestive | Presence of any type of chronic digestive disease (chronic liver disease, cirrhosis, chronic pancreatitis, inflammatory bowel disease,…) | Yes | 1 | ||
| No | 0 | ||||
| Renal | Presence of chronic renal failure (GFR < 60) | Yes | 1 | ||
| No | 0 | ||||
| Frail-VIG index = |
|
||||
ADLs Basic Activities of Daily Living, IAVDs Instrumental Activities of Daily Living, ALS amyotrophic lateral sclerosis. COPD Chronic Obstructive Pulmonary Disease. GFR Glomerular Filtration Rate, GDS Global Deterioration Scale. (+) two point are scored if the patient presents criteria for advanced chronic illness on the NECPAL test (Annex 2; available at: http://ico.gencat.cat/web/.content/minisite/ico/professionals/documents/qualy/arxius/NECPAL-3.0-ENGLISH_full-version.pdf)
In the calculation of the Frail-VIG, binary variables are scored as “0 points” (no deficit) or “1 point” (presence of the deficit), with the exception of advanced chronic illness (defined according to the NECPAL criteria; see Additional file 2), which was scored as 2 points. For ordinal variables, the Frail-VIG uses the well-accepted cut-off points used in routine clinical practice for the Barthel Index (BI), which is used to assess basic ADLs, categorized according to the Saha criteria [46] and Reisberg’s Global Deterioration Scale (GDS), which assesses cognitive impairment, categorizing patients into one of 3 groups [47].
To prevent intercurrent illnesses (that is, the conditions that led to hospitalization) from influencing the Frail-VIG score, the index score identifies only the patient’s baseline condition (that is, ≥ 1 month before hospitalization and/or prior to onset of the clinical process leading to hospital admission). This information is collected on the patient’s first day in the hospital by interview (patient and/or family) to obtain a full medical history and/or by checking the medical record to determine current prescriptions.
Statistical methods
Descriptive statistics of the variables were calculated using the SPSS software program (IBM; Chicago, IL; USA). Statistical significance (p < 0.05) with 95% confidence intervals was obtained by comparing mean values (for quantitative variables) and percentages (for qualitative variables).
Survival estimates were obtained for the 24-month follow-up. The survival analysis was performed using the Survival, pROC, and RMS packages from the R project (https://www.r-project.org). Survival curves were computed according to the Frail-VIG index scores, grouping these according to predefined criteria before the analysis into seven interval ranges (0–0.15, 0.16–0.25, 0.26–0.35, 0.36–0.45, 0.46–0.55, 0.56–0.65, and 0.66–1), and then the survival curves were compared via the log-rank test. The ROC curves were analysed to determine the predictive capacity of the Frail-VIG index.
Results
Cohort description and analysis of the variables
A total of 590 patients were included. Mean (standard deviation; SD) patient age was 86.4 (5.6) years. Women comprised 57.5% (n = 339) of the sample. Most (83.9%) of the patients admitted to the AGU were frail (Frail-VIG index score > 0.25). Fifty-three patients (8.9%) died during hospitalization. No missing values were observed for any of the study variables. Table 2 shows the descriptive results for the study variables.
Table 2.
Descriptive results for the whole sample and comparative outcomes between surviving vs. non-surviving patients
| Variable | Total (n = 590) | Death during the 24-month follow up | p-value | ||
|---|---|---|---|---|---|
| Yes (n = 338) | No (n = 252) | ||||
| Mean age (years) | 86.39 (+/−5.58) | 86.55 (+/−5.76) | 86.17 (+/−5.34) | 0.420 | |
| Sex | Men | 251 (42.5%) | 160 (63.7%) | 91 (36.3%) | 0.006 |
| Women | 339 (57.5%) | 178 (52.5%) | 161 (47.5%) | ||
| Advanced chronic disease | Yes | 260 (44.1%) | 220 (84.6%) | 40(15.4%)) | < 0.001 |
| No | 330 (55.9%) | 118 (35.8%) | 212 (64.25%) | ||
| Length of hospital stay | Mean days | 5.88 (+/−3.26) | 5.88(+/−3.36) | 5.33(+/−3.12) | 0.982 |
| Destination after discharge | Home | 135 (22.9%) | 59 (43.7%) | 76 (56.3%) | < 0.001 |
| Residence | 81 (13.7%) | 45 (55.6%) | 36 (44.4%) | ||
| Intermediate care facility | 321 (54.4%) | 181 (56.4%) | 140 (43.6%) | ||
| Death | 53 (9%) | ||||
| IADLs | (0–1–2-3) | 0.85 (+/−1.15) | 0.53 | 1.27 | < 0.001 |
| ADLs | Mean Barthel index | 62.81 (+/−29.71) | 57.26 | 70.24 | < 0.001 |
| Malnurition | 190 (32.2%) | 175 (92.1%) | 15 (7.9%) | < 0.001 | |
| Cognitive Impairment | None | 231 (39.2%) | 112 (48.5%) | 119 (51.5%) | < 0.001 |
| Mild/Moderate | 257 (43.6%) | 154 (59.9%) | 103 (40.1%) | ||
| Severe | 102 (17.3%) | 72 (70.6%) | 30 (29.4%) | ||
| Emotional Status | Euthymic mood | 306 (51.9%) | 175 (57.2%) | 131 (42.8%) | 0.166 |
| Depressive syndrome | 251 (42.5%) | 139 (55.4%) | 112 (44.6%) | ||
| Not evaluable | 33 (5.6%) | 24 (72.7%) | 9 (27.3%) | ||
| Insomnia | 337 (63.9%) | 214 (63.5%) | 123 (36.5%) | < 0.001 | |
| Social Vulnerability | 19 (3.2%) | 14 (73.7%) | 5 (26.3%) | 0.142 | |
| Geriatric Syndromes | Delirium | 334 (56.6%) | 220 (65.9%) | 114 (34.1%) | < 0.001 |
| Falls | 348 (59%) | 197 (56.6%) | 151 (43.4%) | 0.689 | |
| Ulcers | 76 (12.9%) | 64 (84.2%) | 12 (15.8%) | < 0.001 | |
| Polypharmacy | 474 (80.3%) | 288 (60.8%) | 186 (39.2%) | 0.001 | |
| Dysphagia | 255 (43.2%) | 205 (80.4%) | 50 (19.6%) | < 0.001 | |
| Severe Symptoms | Pain | 146 (24.7%) | 103 (70.5%) | 43 (29.5%) | < 0.001 |
| Dyspnea | 69 (11.7%) | 59 (85.5%) | 10 (14.5%) | < 0.001 | |
| Chronic Diseases | Cancer | 87 (14.7%) | 73 (83.9%) | 14 (16.1%) | < 0.001 |
| Respiratory | 164 (27.8%) | 107 (65.2%) | 57 (34.8%) | 0.015 | |
| Cardiac | 352 (59.7%) | 233 (66.2%) | 119 (33.8%) | < 0.001 | |
| Neurological | 155 (26.8%) | 93 (60.0%) | 62 (40.0%) | 0.427 | |
| Digestive | 68 (11.5%) | 53 (77.9%) | 15 (22.1%) | < 0.001 | |
| Renal | 291 (49.3%) | 208 (71.5%) | 83 (28.5%) | < 0.001 | |
ADLs Basic Activities of Daily Living, IADLs Instrumental Activities of Daily Living
Variable selection and results of construct evaluation
The deficits included in the Frail-VIG index are those commonly associated with age and adverse health outcomes and these deficits were carefully selected to represent the main domains to be assessed (see Additional file 1).
The prevalence rate for each variable was < 80% (except for polypharmacy, which was exactly 80%) and none could be considered rare (< 1%). Although the prevalence for some variables—for example, polypharmacy—was high, none of these variables are universal, even in 85-year old patients [48]. The overall construct validation process [4] shows that the distribution of variables by domain (as a percentage of the overall index) was similar to other validated FIs (see Additional file 1). Despite the high mean age of this population cohort and the large percentage of individuals presenting with advanced chronic conditions, the submaximal limit (0.7) for FI scores was maintained (that is, the Frail-VIG index was < 0.7 in 99.3% of patients). The distribution of scores on the Frail-VIG index tended towards asymmetry (asymmetry coefficient, 0.37) (Fig. 1).
Fig. 1.
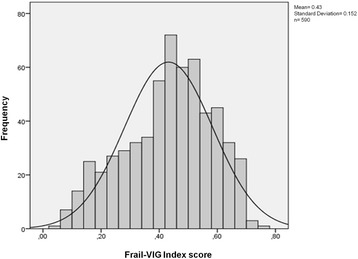
Distribution of Frail-VIG index scores at baseline (n = 590)
Mortality at 24 months
The cohort was followed for 24 months or until death, whichever came first. At 24 months, the mortality rate was 57.3% (n = 338). None of the patients were lost to follow up. Table 2 shows differences in mortality rates for each individual study variable. The mortality rate increased progressively in line with higher Frail-VIG scores (Fig. 2), especially at the 12 month follow up (Fig. 2; panel A).
Fig. 2.
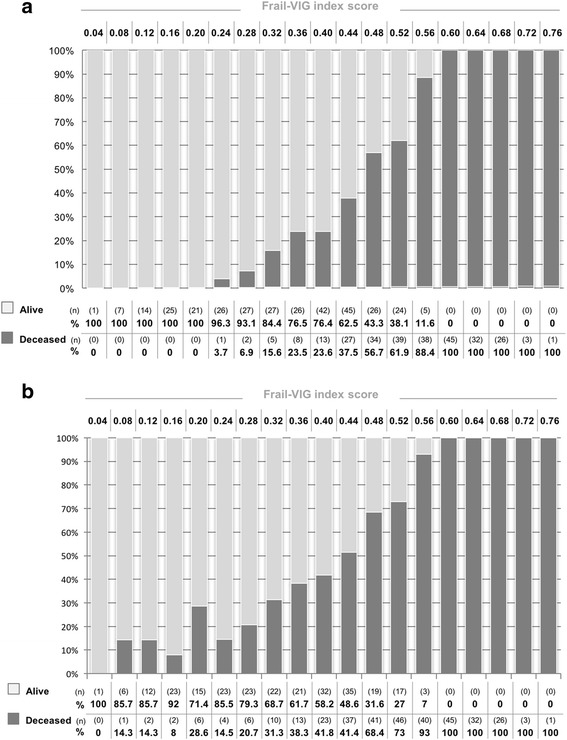
Distribution in number (n) and percentage (%) of surviving and non-surviving patients at 12 (panel a) and 24 (panel b) months according to the Frail-VIG index score
We evaluated the correlation between mortality and the Frail-VIG index by means of the log-rank test (Fig. 3), comparing the seven different survival curves based on the score intervals described in the statistical analysis section above. Highly significant differences were observed between the various range intervals (X2 = 433.4, p < 0.0001). Table 3 shows the number of individuals in each frailty index category who had died at 24 months of follow-up.
Fig. 3.
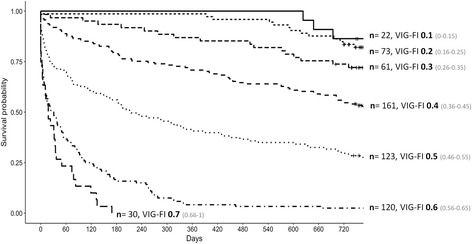
Kaplan–Meier curves according to Frail-VIG index score
Table 3.
People alive and deceased at 12 and 24 months follow-up in each frailty index category
| Frail-VIG index category | 0.1 (0–0.15) | 0.2 (0.16–0.25) | 0.3 (0.26–0.35) | 0.4 (0.36–0.45) | 0.5 (0.46–0.55) | 0.6 (0.56–0.65) | 0.7 (0.66–1) | Total | |
|---|---|---|---|---|---|---|---|---|---|
| 12 months Follow-up | Alive | 22 | 72 | 54 | 113 | 50 | 5 | 0 | 316 |
| Deceased | 0 | 1 | 7 | 48 | 73 | 115 | 30 | 274 | |
| Deceased (%) | 0 | 1.4 | 11.4 | 45.3 | 70.7 | 97.5 | 100 | 46.4 | |
| 24 months Follow-up | Alive | 19 | 61 | 45 | 88 | 36 | 3 | 0 | 252 |
| Deceased | 3 | 12 | 16 | 73 | 87 | 117 | 30 | 338 | |
| Deceased (%) | 13.6 | 16.4 | 26.2 | 45.3 | 70.7 | 97.5 | 100 | 57.3 | |
| Total | 22 | 73 | 61 | 161 | 123 | 120 | 30 | 590 | |
On the ROC curve analysis, the area under the curve (AUC) values at 3, 6, 9, 12 and 24 months were, respectively, as follows: 0.87 (range, 0.84–0.90), 0.88 (0.85–0.91), 0.89 (0.87–0.92), 0.9 (0.88–0.92), and 0.85 (0.82–0.88) (Additional file 3). The optimal cut-off point was 0.46 in all cases, revealing a better performance (as measured by the Youden index) at 12 months (0.62), with a sensitivity and specificity of 0.80 and 0.83, respectively (Additional file 4).
According to the participating clinicians, administration time for the Frail-VIG index ranged from 5 to 10 min.
Discussion
Key results
At the 24 month follow-up, we found statistically significant differences (p < 0.05) between the two groups (living vs. deceased) for most of the Frail-VIG variables, a finding that confirms the index’s discriminative capacity. The only variables that were not statistically significant were 1) social vulnerability—likely due to the limited number of patients with social vulnerability (19 patients; 3.2%), 2) emotional status (although there were significant differences [p 0.016] at the 12-month follow up), and 3) falls (probably because we did not differentiate between severe and non-severe falls).
These results, which met the previously-specified internal validation criteria, support the validity of the Frail-VIG index [16, 44]. All criteria were fully met, both in terms of the variables included and with regard to the construct’s validation criteria.
The strong correlation between the Frail-VIG index score and mortality was consistent with published data [14, 17]. The 12- and 24-month AUC were 0.90 and 0.85, respectively, demonstrating that the Frail-VIG index offers a better prognostic capacity than other previously published FIs (whose AUCs range from 0.6 to 0.8) [4, 14, 49, 50]. A study conducted by Pilotto et al. evaluated several different FIs [51] in a group of hospitalized patients (20 Italian geriatric units; n = 2033), reporting a 12-month AUC of 0.69 for the FI-SOF (Frailty Index-Study of Osteoporotic Fractures) [52], 0.73 for the CSHA-FI70, 0.73 for the FI-CGA, and 0.75 for the MPI. A study by Ritt et al. involving 307 hospitalized inpatients in an AGU in Erlangen (Germany) compared the predictive capacity of 3 different FIs based on CGA, finding an AUC at 6 months that ranged from 0.77 to 0.84 [53].
Although the excellent predictive capacity of the Frail-VIG index may seem surprising, we believe that the following factors may have positively influenced our results: (1) The characteristics of the instrument itself, which incorporates only those variables that are routinely used in conventional CGAs. Moreover, most of these variables are good predictors of mortality, as evidenced by the statistically significant differences between the two groups (alive vs. deceased) for practically all of the individual variables included in the index (Table 2). (2) There were no missing data from the baseline data due to the systematic data collection processes during routine clinical practice of the health care team. Similarly, no data were missing during follow up thanks to the reliability of the “Shared Medical Record” system in Catalonia (HC3). (3) The instrument was administered by a small group of professionals with extensive expertise in geriatric assessment. Although the questionnaire is both short and simple (containing only basic questions with dichotomous response options), we do not know if administration of this instrument by untrained staff or in other settings could lead to different results; nor do we have any data on possible interobserver variability. (4) We cannot rule out the possibility of selection bias caused by the AGU admission criteria, which could have led us to select a population with high mortality rates. (5) The intercurrent process that led to hospital admission may have affected the final mortality results, potentially increasing specifically the mortality rate in those patients who were the most frail prior to admission.
When we compared the results at the 12 and 24 month follow up periods, we found that the prognostic accuracy of the index tends to decrease over time (Fig. 3, Table 3 and Additional files 3 and 4). The most plausible explanation for this finding is the dynamic nature of frailty [54]: the Frail-VIG index score for each patient reflects a static vision of reality; that is, it indicates the patient’s status only at the time of data collection. However, given the patient profile of this cohort (elderly patients with high multimorbidity rates), it is logical to expect that these patients will continue to accumulate deficits during the follow up period, thus increasing their Frail-VIG index score; this would also explain 24 month mortality in individuals whose initial Frail-VIG score (< 0.25) did not indicate the presence of frailty.
Administration of the Frail-VIG index does not preclude the use of the CGA for systematic multidimensional assessment [55], but instead offers the advantage of a RGA: only 5–10 min of time are needed to complete the Frail-VIG; by contrast, the CSHA-FI70 [12] requires around 20–30 min [21] and the FI-CGA [23] about 25 min [56].
Utility of the frail-VIG index
Although more studies will be needed to confirm the benefits of using FIs to assess geriatric patients, we believe the Frail-VIG index to be a valuable tool:
The index can accurately discriminate between frail and non-frail patients. The fact that more than 80% of the patients admitted to the AGU—a unit specifically designed for frail patients—are, in fact, frail, supports the appropriateness of the unit’s admission criteria.
The Frail-VIG index score assesses the degree of frailty as a continuous variable. This can help clinicians make an accurate situational diagnosis [31]: the ability to determine the patient’s approximate biological age (degree of frailty) relative to his/her chronological age, can be particularly relevant when selecting or adjusting the treatment to develop an appropriate therapeutic plan. For instance, identifying advanced, progressive frailty (after potentially reversible causes have been ruled out), helps in analysing the risk/benefit of aggressive interventions. Conversely, assessing the degree of frailty can also be useful in decision-making for patients at risk of undertreatment who, though having fair reserve, could be denied additional diagnostic efforts or specific therapeutic interventions due to age. Frailty assessment using FIs allow us to reduce uncertainty by providing better understanding on the patient’s overall situation, helping to improve the dialogue between the patient, family and health care professionals in regards to expectations and objectives in the shared decision-making process (Fig. 4).
Related to the previous point, quantification of the degree of frailty by means of the Frail-VIG index could facilitate the creation of a common reference for communication with health care professionals in other specialities. In addition, this could potentially allow clinicians to monitor the results of any interventions. Finally, quantification could be highly valuable in patient care and for research purposes [18].
Fig. 4.
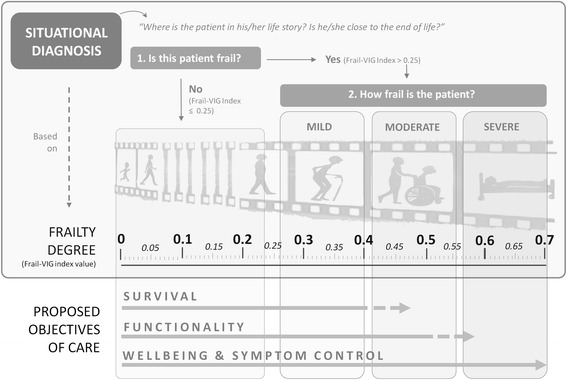
Conceptual Model of Situational Diagnosis (based on degree of frailty) and the proposed care objectives
Study limitations and next steps
The data described here should be interpreted with caution given that our cohort is not representative of the general population. An important limitation of the present study is that the Frail-VIG index has not been validated by comparing it to other instruments in the same cohort, nor compared to other variables (for example, institutionalization or use of resources). Additional studies are required to assess the reliability and reproducibility of this index in other settings and populations. Some study variables were obtained by reviewing the patient’s medications without confirming the suitability of the prescription and/or dose for the patient’s condition; this approach to obtaining certain variables may have biased the study outcomes. Assessment of certain variables (for example, social needs) needs to be improved to increase the reliability and accuracy of the tool. Finally, although the professionals agreed about the time needed to administer the instrument (that is, more than 5 min but less than 10 min), we did not systematically measure (using a timer) these data.
Finally, the next steps in the development of the Frail-VIG index are the following: (1) validate the instrument in an independent cohort, in other settings and distinct populations; (2) demonstrate its applicability and utility for professionals in routine clinical practice; and (3) as with most FIs, the true challenge is to demonstrate whether the routine, systematic use of this tool actually improves the health outcomes of the patients in the “triple aim” framework [57].
Conclusions
The Frail-VIG index was developed to facilitate frailty assessment during routine clinical practice in order to improve the management of at-risk patients. The main benefits of the Frail-VIG index are its simplicity—22 simple, dichotomous questions to assess 25 different deficits—and short administration time (5 to 10 min), which allows physicians’ to incorporate frailty assessment into the overall evaluation of elderly patients. Perhaps more importantly, the Frail-VIG index can reliably discriminate between different degrees of frailty (up to seven categories in the present study) and can accurately predict 12- and 24-month mortality. The results of the current study support the use of the Frail-VIG index in routine clinical practice. Additional research is needed to confirm its validity in a wider range of populations.
Additional files
Percentage of variables by domain versus the other four validated frailty indices. The distribution of variables by domain (as a percentage of the overall index) was similar to other validated FIs: the Original Canadian Study of Health and Aging – Frailty Index (CSHA-FI70), the Searle version of Canadian Study of Health and Aging – Frailty Index (CSHA-FI40), the Frailty Index based on Comprehensive Geriatric Assessment (FI-CGA) and the SHARE-Frailty Index (SHARE-FI). However, the Frail-VIG showed a higher weighting of geriatric syndromes and symptoms and a lower weighting for the functional domain; it should be noted that the Frail-VIG is the only index to include the social domain. (DOCX 14 kb)
Specific NECPAL severity criteria / progression / advanced disease. Severity and/or progression criteria for advanced chronic illness (oncological, pulmonary, cardiovascular, neurological, hepatobiliary-digestive, kidney) defined in the NECPAL test. Abbreviations: FEV1: forced expiratory volume in 1 s. VC: Vital Capacity; DLCO: Diffusion capacity for carbon monoxide; NYHA: New York Hearth Association. EF: Ejection Fraction; PAH: Pulmonary Arterial Hypertension; PAPs: pulmonary artery pressure; GFR: glomerular filtration rate; MS: multiple sclerosis; ALS: amyotrophic lateral sclerosis. (DOCX 15 kb)
ROC curves. (Panel A) Area Under the Curve (AUC) at 3, 6, 9, 12, and 24 months. (Panel B) Changes in the AUC over the course of the follow-up period. This shows how the AUC tends to increase up to month 12 after which the prognostic accuracy begins to decline until month 24. (TIFF 700 kb)
Area Under the Curve (AUC), optimal cut-off point of the Frail-VIG index related to the sensitivity and specificity and Youden’s index at 3, 6, 9, 12, and 24 months. The optimal cut-off point is 0.46 in all cases, with the best performance according to Youden’s index observed at 12 months (0.62), with a sensitivity and specificity of 0.80 and 0.83, respectively. (DOCX 14 kb)
Acknowledgments
We are grateful to Nadina Latorre for her work in following-up patient mortality. We also thank all the professionals who helped with data collection: Anna Torné, Mariona Espaulella, Meritxell Feliu, Teresa Méndez, Christian Ruiz, Gerard Corominas, and Anna Ribera. We wish to thank Bradley Londres for his valuable assistance in editing and improving the manuscript.
Funding
No external funding sources were required.
Availability of data and materials
The anonymised datasets analysed during the current study are available from the corresponding author on reasonable request.
Abbreviations
- ADLs
Basic Activities of Daily Living
- AGU
Acute Geriatric Unit
- ALS
amyotrophic lateral sclerosis
- AUC
Area Under the Curve
- CGA
Comprehensive Geriatric Assessment
- COPD
Chronic Obstructive Pulmonary Disease
- CSHA-FI40
Searle version of Canadian Study of Health and Aging – Frailty Index
- CSHA-FI70
Original Canadian Study of Health and Aging – Frailty Index
- FI
Frailty Index
- FI-CGA
Frailty Index based on Comprehensive Geriatric Assessment
- FI-SOF
Frailty Index-Study of Osteoporotic Fractures
- GDS
Global Deterioration Scale
- GFR
Glomerular Filtration Rate
- IAVDs
Instrumental Activities of Daily Living
- MPI
Multidimensional Prognostic Index
- RGA
Rapid Geriatric Assessment
- SHARE-FI
Survey of Health, Ageing and Retirement in Europe-Frailty Index
Authors’ contributions
JAN, JCM, JE and NMB were responsible for the conception and design of the study. JAN and NMB coordinated and substantially contributed to the data collection. JCC and RO performed the statistical analysis. All authors (JAN, JE, JCM, RO, NMB, MI and RRO) were involved in interpretation of data. JAN wrote the initial draft of the manuscript and all of the other authors (JE, JCM, RO, NMB, MI and RRO) revised the manuscript critically for important intellectual content. All authors (JAN, JE, JCM, RO, NMB, MI and RRO) have provided final approval of the version of the manuscript submitted for publication. All authors (JAN, JE, JCM, RO, NMB, MI and RRO) agree to be accountable for all aspects of the work.
Ethics approval and consent to participate
The study protocol was approved by the Ethics Committee of the University Hospital of Vic (2,014,850 PR80). All patients enrolled in the study provided written informed consent for participation or, if this was not possible due to advanced dementia situation (GDS ≥ 6), by close family relatives. This study was conducted according to the guidelines of the Declaration of Helsinki.
Consent for publication
Not applicable. The manuscript contains no individual person’s identifiable data.
Competing interests
The authors report no conflicts of interest. RRO is a member of the editorial board of BMC Geriatrics. The authors alone are responsible for the content and writing of the paper.
Publisher’s Note
Springer Nature remains neutral with regard to jurisdictional claims in published maps and institutional affiliations.
Footnotes
Electronic supplementary material
The online version of this article (10.1186/s12877-018-0718-2) contains supplementary material, which is available to authorized users.
Contributor Information
Jordi Amblàs-Novellas, Phone: +34 628190415, Email: jordiamblas@gmail.com.
Joan Carles Martori, Email: martori@uvic.cat.
Joan Espaulella, Email: jespaulella@hsc.chv.cat.
Ramon Oller, Email: ramon.oller@uvic.cat.
Núria Molist-Brunet, Email: nmolist@gmail.com.
Marco Inzitari, Email: minzitari@perevirgili.cat.
Roman Romero-Ortuno, Email: roman.romero-ortuno@nhs.net.
References
- 1.Moorhouse P, Rockwood K, Morley JE, Vellas B, Abellan van Kan G, Anker SD, et al. Frailty consensus: a call to action. J Am Med Dir Assoc. 2013;14(6):392–397. doi: 10.1016/j.jamda.2013.03.022. [DOI] [PMC free article] [PubMed] [Google Scholar]
- 2.Harrison JK, Clegg A, Conroy SP, Young J. Managing frailty as a long-term condition. Age Ageing. 2015;44(5):732–735. doi: 10.1093/ageing/afv085. [DOI] [PubMed] [Google Scholar]
- 3.Clegg A, Young J, Iliffe S, Rikkert MO, Rockwood K. Frailty in elderly people. Lancet. 2013;381:752–762. doi: 10.1016/S0140-6736(12)62167-9. [DOI] [PMC free article] [PubMed] [Google Scholar]
- 4.Theou O, Brothers TD, Mitnitski A, Rockwood K. Operationalization of frailty using eight commonly used scales and comparison of their ability to predict all-cause mortality. J Am Geriatr Soc. 2013;61(9):1537–1551. doi: 10.1111/jgs.12420. [DOI] [PubMed] [Google Scholar]
- 5.Ravindrarajah R, Lee DM, Pye SR, Gielen E, Boonen S, Vanderschueren D, et al. The ability of three different models of frailty to predict all-cause mortality: results from the European male aging study (EMAS) Arch Gerontol Geriatr. 2013;57(3):360–368. doi: 10.1016/j.archger.2013.06.010. [DOI] [PubMed] [Google Scholar]
- 6.Rodríguez-Mañas L, Féart C, Mann G, Viña J, Chatterji S, Chodzko-Zajko W, et al. Searching for an operational definition of frailty: a delphi method based consensus statement. The frailty operative definition-consensus conference project. J Gerontol A Biol Sci Med Sci. 2013;68:62–67. doi: 10.1093/gerona/gls119. [DOI] [PMC free article] [PubMed] [Google Scholar]
- 7.Cesari M, Prince M, Thiyagarajan JA, De Carvalho IA, Bernabei R, Chan P, et al. Frailty: an emerging public health priority. J Am Med Dir Assoc. 2016;17(3):188–192. doi: 10.1016/j.jamda.2015.12.016. [DOI] [PubMed] [Google Scholar]
- 8.Hubbard RE, Story DA. Patient frailty: the elephant in the operating room. Anaesthesia. 2014;69(Suppl 1):26–34. doi: 10.1111/anae.12490. [DOI] [PubMed] [Google Scholar]
- 9.Cesari M, Gambassi G, van Kan GA, Vellas B. The frailty phenotype and the frailty index: different instruments for different purposes. Age Ageing. 2014;43(1):10–12. doi: 10.1093/ageing/aft160. [DOI] [PubMed] [Google Scholar]
- 10.Blodgett J, Theou O, Kirkland S, Andreou P, Rockwood K. Frailty in NHANES: comparing the frailty index and phenotype. Arch Gerontol Geriatr. 2015;60(3):464–470. doi: 10.1016/j.archger.2015.01.016. [DOI] [PubMed] [Google Scholar]
- 11.Fried LP, Tangen CM, Walston J, Newman AB, Hirsch C, Gottdiener J, et al. Frailty in older adults: evidence for a phenotype. J Gerontol A Biol Sci Med Sci. 2001;56(3):M146–M156. doi: 10.1093/gerona/56.3.M146. [DOI] [PubMed] [Google Scholar]
- 12.Rockwood K, Song X, MacKnight C, Bergman H, Hogan DB, McDowell I, et al. A global clinical measure of fitness and frailty in elderly people. CMAJ. 2005;173(5):9–13. doi: 10.1503/cmaj.050051. [DOI] [PMC free article] [PubMed] [Google Scholar]
- 13.Armstrong JJ, Stolee P, Hirdes JP, Poss JW. Examining three frailty conceptualizations in their ability to predict negative outcomes for home-care clients. Age Ageing. 2010;39(6):755–758. doi: 10.1093/ageing/afq121. [DOI] [PubMed] [Google Scholar]
- 14.Malmstrom TK, Miller DK, Morley JE. A comparison of four frailty models. J Am Geriatr Soc. 2014;62(4):721–726. doi: 10.1111/jgs.12735. [DOI] [PMC free article] [PubMed] [Google Scholar]
- 15.Searle S, Mitnitski A, Gahbauer E, Gill TM, Rockwood K. A standard procedure for creating a frailty index. BMC Geriatr. 2008;8:24. doi: 10.1186/1471-2318-8-24. [DOI] [PMC free article] [PubMed] [Google Scholar]
- 16.Rockwood K, Mitnitski A. Frailty defined by deficit accumulation and geriatric medicine defined by frailty. Clin Geriatr Med. 2011;27(1):17–26. doi: 10.1016/j.cger.2010.08.008. [DOI] [PubMed] [Google Scholar]
- 17.Mitnitski AB, Mogilner AJ, MacKnight C, Rockwood K. The mortality rate as a function of accumulated deficits in a frailty index. Mech Ageing Dev. 2002;123(11):1457–1460. doi: 10.1016/S0047-6374(02)00082-9. [DOI] [PubMed] [Google Scholar]
- 18.Romero-Ortuno R, Kenny RA. The frailty index in Europeans: association with age and mortality. Age Ageing. 2012;41(5):684–689. doi: 10.1093/ageing/afs051. [DOI] [PMC free article] [PubMed] [Google Scholar]
- 19.Shi J, Song X, Yu P, Tang Z, Mitnitski A, Fang X, et al. Analysis of frailty and survival from late middle age in the Beijing longitudinal study of aging. BMC Geriatr. 2011;11:17. doi: 10.1186/1471-2318-11-17. [DOI] [PMC free article] [PubMed] [Google Scholar]
- 20.Drubbel I, de Wit NJ, Bleijenberg N, Eijkemans RJC, Schuurmans MJ, Numans ME. Prediction of adverse health outcomes in older people using a frailty index based on routine primary care data. J Gerontol A Biol Sci Med Sci. 2013;68(3):301–308. doi: 10.1093/gerona/gls161. [DOI] [PubMed] [Google Scholar]
- 21.Dent E, Kowal P, Hoogendijk EO. Frailty measurement in research and clinical practice: a review. Eur J Intern Med. 2016;31:3–10. doi: 10.1016/j.ejim.2016.03.007. [DOI] [PubMed] [Google Scholar]
- 22.Rockwood K, Mitnitski A. Limits to deficit accumulation in elderly people. Mech Age Dev. 2006;127(5):494–496. doi: 10.1016/j.mad.2006.01.002. [DOI] [PubMed] [Google Scholar]
- 23.Jones DM, Song X, Rockwood K. Operationalizing a frailty index from a standardized comprehensive geriatric assessment. J Am Geriatr Soc. 2004;52(11):1929–1933. doi: 10.1111/j.1532-5415.2004.52521.x. [DOI] [PubMed] [Google Scholar]
- 24.Busse R, Blümel M, Scheller-Kreinsen D, Zentner A. Tackling chronic disease in Europe: Strategies, interventions and challenges. 2010. http://www.euro.who.int/__data/assets/pdf_file/0008/96632/E93736.pdf. Accessed 4 Dec 2017.
- 25.United Nations Department of Economic and Social Affairs (DESA) Population prospects for the twenty-first century: the 2010 United Nations projections. Popul Dev Rev. 2011;37:407–411. doi: 10.1111/j.1728-4457.2011.00425.x. [DOI] [Google Scholar]
- 26.United Nations D of E and SAPD, United Nations, Department of Economic and Social Affairs PD. World Population Ageing 2013. 2013. http://www.un.org/en/development/desa/population/publications/pdf/ageing/WorldPopulationAgeing2013.pdf. Accessed 18 Nov 2017.
- 27.World Health Organisation. Global Strategy and Action Plan on Ageing and Health. 2015. http://www.who.int/mediacentre/factsheets/fs404/en/. Accessed 18 Nov 2017.
- 28.Morley MBJE, Little DOMO, Berg-Weger M. Rapid geriatric assessment: a tool for primary care physicians. J Am Med Dir Assoc. 2017;18(3):195–199. doi: 10.1016/j.jamda.2016.11.017. [DOI] [PubMed] [Google Scholar]
- 29.Hall DE, Arya S, Schmid KK, Carlson MA, Lavedan P, Bailey TL, et al. Association of a Frailty Screening Initiative with Postoperative Survival at 30, 180, and 365 days. JAMA Surg. 2017;152(3):233–240. doi: 10.1001/jamasurg.2016.4219. [DOI] [PMC free article] [PubMed] [Google Scholar]
- 30.Hubbard RE, Peel NM, Samanta M, Gray LC, Mitnitski A, Rockwood K. Frailty status at admission to hospital predicts multiple adverse outcomes. Age Ageing. 2017;46(5):801–806. doi: 10.1093/ageing/afx081. [DOI] [PubMed] [Google Scholar]
- 31.Eamer G, Gibson JA, Gillis C, Hsu AT, Krawczyk M, Macdonald E, et al. Surgical frailty assessment : a missed opportunity. BMC Anesthesiol. 2017;17:99. doi: 10.1186/s12871-017-0390-7. [DOI] [PMC free article] [PubMed] [Google Scholar]
- 32.British Geriatrics Society. Fit for Frailty. Part 1. 2014. http://www.bgs.org.uk/campaigns/fff/fff2_full.pdf. Accessed 1 Feb 2017.
- 33.Amblàs-Novellas J, Espaulella J, Rexach L, Fontecha B, Inzitari M, Blay C, et al. Frailty, severity, progression and shared decision-making: a pragmatic framework for the challenge of clinical complexity at the end of life. Eur Geriatr Med. 2015;6(2):189–194. doi: 10.1016/j.eurger.2015.01.002. [DOI] [Google Scholar]
- 34.Morley JE, Adams EV. Rapid geriatric assessment. J Am Med Dir Assoc. 2015;16(10):808–812. doi: 10.1016/j.jamda.2015.08.004. [DOI] [PubMed] [Google Scholar]
- 35.Gómez-Batiste X, Martínez-Muñoz M, Blay C, Amblàs-Novellas J, Vila L, Costa X, et al. Prevalence and characteristics of patients with advanced chronic conditions in need of palliative care in the general population: a cross-sectional study. Palliat Med. 2014;28(4):302–311. doi: 10.1177/0269216313518266. [DOI] [PubMed] [Google Scholar]
- 36.Brosseau A-A, Dent E, Hubbard R, Melady D, Émond M, Mercier É, et al. Identification of older adults with frailty in the emergency department using a frailty index: results from a multinational study. Age Ageing. 2017;20:1–7. doi: 10.1093/ageing/afx168. [DOI] [PubMed] [Google Scholar]
- 37.Hoogendijk EO, Theou O, Rockwood K, Onwuteaka-Philipsen BD, Deeg DJH, Huisman M. Development and validation of a frailty index in the longitudinal aging study Amsterdam. Aging Clin Exp Res. 2017;29(5):927–933. doi: 10.1007/s40520-016-0689-0. [DOI] [PMC free article] [PubMed] [Google Scholar]
- 38.Amblàs-Novellas J, Murray SA, Espaulella J, Martori J, Oller R, Martínez-Muñoz M, et al. Identifying patients with advanced chronic conditions for a progressive palliative care approach: a cross-sectional study of indicators related to end-of-life trajectories. BMJ Open. 2016;6(9):e012340. doi: 10.1136/bmjopen-2016-012340. [DOI] [PMC free article] [PubMed] [Google Scholar]
- 39.Streiner DL, Norman GR. Health measurement scales: a practical guide to their development and use. 5th ed. Oxford University Press; 2014.
- 40.Amblàs-Novellas J, Martori J, Molist Brunet N, Oller R, Gomez-Batiste X, Espaulella J. Índice Frágil-VIG: diseño y evaluación de un Índice de Fragilidad basado en la Valoración Integral Geriátrica. Rev Esp Geriatr Gerontol. 2016;52(3):119–127. doi: 10.1016/j.regg.2016.09.003. [DOI] [PubMed] [Google Scholar]
- 41.Romero-ortuno R, Walsh CD, Lawlor BA, Kenny RA. A frailty instrument for primary care : findings from the survey of health, ageing and retirement in Europe ( SHARE ) BMC Geriatr. 2010;10:57. doi: 10.1186/1471-2318-10-57. [DOI] [PMC free article] [PubMed] [Google Scholar]
- 42.Pilotto A, Ferrucci L, Franceschi M, Ambrosio LPD, Cascavilla L, Paris F, et al. Development and validation of a multidimensional prognostic index for one-year mortality from comprehensive geriatric assessment in hospitalized older patients. Rejuvenation Res. 2008;11(1):151–161. doi: 10.1089/rej.2007.0569. [DOI] [PMC free article] [PubMed] [Google Scholar]
- 43.Song X, Mitnitski A, Rockwood K. Prevalence and 10-year outcomes of frailty in older adults in relation to deficit accumulation. J Am Geriatr Soc. 2010;58(4):681–687. doi: 10.1111/j.1532-5415.2010.02764.x. [DOI] [PubMed] [Google Scholar]
- 44.Kulminski A, Yashin A, Arbeev K, Akushevich I, Ukraintseva S, Land K, et al. Cumulative index of health disorders as an indicator of aging-associated processes in the elderly: results from analyses of the National Long Term Care Survey. Mech Ageing Dev. 2007;128(3):250–258. doi: 10.1016/j.mad.2006.12.004. [DOI] [PMC free article] [PubMed] [Google Scholar]
- 45.HC3 Shared Medical Record in Catalonia. 2017. http://www.ticsalut.cat/media/upload//arxius/ticSalutHC3ang.pdf. Accessed 20 Nov 2017.
- 46.Shah S, Vanclay F, Cooper B. Improving the sensitivity of the Barthel index for stroke rehabilitation. J Clin Epidemiol. 1989;42(8):703–709. doi: 10.1016/0895-4356(89)90065-6. [DOI] [PubMed] [Google Scholar]
- 47.Reisberg B, Ferris SH, De Leon MJ, Crook T. The global deterioration scale for assessment of primary degenerative dementia. Am J Psychiatry. 1982;139(9):1136–1139. doi: 10.1176/ajp.139.9.1136. [DOI] [PubMed] [Google Scholar]
- 48.Moorhouse P, Rockwood K. Frailty and its quantitative clinical evaluation. J R Coll Physicians Edinb. 2012;42(4):333–340. doi: 10.4997/JRCPE.2012.412. [DOI] [PubMed] [Google Scholar]
- 49.Hogan DB, Freiheit EA, Strain LA, Patten SB, Schmaltz HN, Rolfson D, et al. Comparing frailty measures in their ability to predict adverse outcome among older residents of assisted living. BMC Geriatr. 2012;12:56. doi: 10.1186/1471-2318-12-56. [DOI] [PMC free article] [PubMed] [Google Scholar]
- 50.Peña FG, Theou O, Wallace L, Brothers TD, Gill TM, Gahbauer EA, et al. Comparison of alternate scoring of variables on the performance of the frailty index. BMC Geriatr. 2014;14:25. doi: 10.1186/1471-2318-14-25. [DOI] [PMC free article] [PubMed] [Google Scholar]
- 51.Pilotto A, Rengo F, Marchionni N, Sancarlo D, Fontana A, Panza F, et al. Comparing the prognostic accuracy for all-cause mortality of frailty instruments: a multicentre 1-year follow-up in hospitalized older patients. PLoS One. 2012;7(1):e29090. doi: 10.1371/journal.pone.0029090. [DOI] [PMC free article] [PubMed] [Google Scholar]
- 52.Ensrud KE, Ewing SK, Taylor BC, Fink HA, Cawthon PM, Stone KL, et al. Comparison of 2 frailty indexes for prediction of falls, disability, fractures, and death in older women. Arch Intern Med. 2008;168(4):382–389. doi: 10.1001/archinternmed.2007.113. [DOI] [PubMed] [Google Scholar]
- 53.Ritt M, Rádi K, Schwarts C, Bollheimer L, Sieber C, Gassmann K. A comparison of frailty indexes based on a Conprehensive geriatric assessment for the prediction of adverse outcomes. J Nutr Health Aging. 2016;20(7):760–767. doi: 10.1007/s12603-015-0644-3. [DOI] [PubMed] [Google Scholar]
- 54.Gill TM, Gahbauer EA, Allore HG, Han L. Transitions between frailty states among community-living older persons. Arch Intern Med. 2006;166(4):418–423. doi: 10.1001/archinte.166.4.418. [DOI] [PubMed] [Google Scholar]
- 55.Krishnan M, Beck S, Havelock W, Eeles E, Hubbard RE, Johansen A. Predicting outcome after hip fracture: using a frailty index to integrate comprehensive geriatric assessment results. Age Ageing. 2014;43(1):122–126. doi: 10.1093/ageing/aft084. [DOI] [PubMed] [Google Scholar]
- 56.Evans SJ, Sayers M, Mitnitski A, Rockwood K. The risk of adverse outcomes in hospitalized older patients in relation to a frailty index based on a comprehensive geriatric assessment. Age Ageing. 2014;43(1):127–132. doi: 10.1093/ageing/aft156. [DOI] [PubMed] [Google Scholar]
- 57.Berwick DM, Nolan TW, Whittington J. The triple aim: care, health, and cost. Health Aff (Millwood) 2008;27(3):759–769. doi: 10.1377/hlthaff.27.3.759. [DOI] [PubMed] [Google Scholar]
Associated Data
This section collects any data citations, data availability statements, or supplementary materials included in this article.
Supplementary Materials
Percentage of variables by domain versus the other four validated frailty indices. The distribution of variables by domain (as a percentage of the overall index) was similar to other validated FIs: the Original Canadian Study of Health and Aging – Frailty Index (CSHA-FI70), the Searle version of Canadian Study of Health and Aging – Frailty Index (CSHA-FI40), the Frailty Index based on Comprehensive Geriatric Assessment (FI-CGA) and the SHARE-Frailty Index (SHARE-FI). However, the Frail-VIG showed a higher weighting of geriatric syndromes and symptoms and a lower weighting for the functional domain; it should be noted that the Frail-VIG is the only index to include the social domain. (DOCX 14 kb)
Specific NECPAL severity criteria / progression / advanced disease. Severity and/or progression criteria for advanced chronic illness (oncological, pulmonary, cardiovascular, neurological, hepatobiliary-digestive, kidney) defined in the NECPAL test. Abbreviations: FEV1: forced expiratory volume in 1 s. VC: Vital Capacity; DLCO: Diffusion capacity for carbon monoxide; NYHA: New York Hearth Association. EF: Ejection Fraction; PAH: Pulmonary Arterial Hypertension; PAPs: pulmonary artery pressure; GFR: glomerular filtration rate; MS: multiple sclerosis; ALS: amyotrophic lateral sclerosis. (DOCX 15 kb)
ROC curves. (Panel A) Area Under the Curve (AUC) at 3, 6, 9, 12, and 24 months. (Panel B) Changes in the AUC over the course of the follow-up period. This shows how the AUC tends to increase up to month 12 after which the prognostic accuracy begins to decline until month 24. (TIFF 700 kb)
Area Under the Curve (AUC), optimal cut-off point of the Frail-VIG index related to the sensitivity and specificity and Youden’s index at 3, 6, 9, 12, and 24 months. The optimal cut-off point is 0.46 in all cases, with the best performance according to Youden’s index observed at 12 months (0.62), with a sensitivity and specificity of 0.80 and 0.83, respectively. (DOCX 14 kb)
Data Availability Statement
The anonymised datasets analysed during the current study are available from the corresponding author on reasonable request.