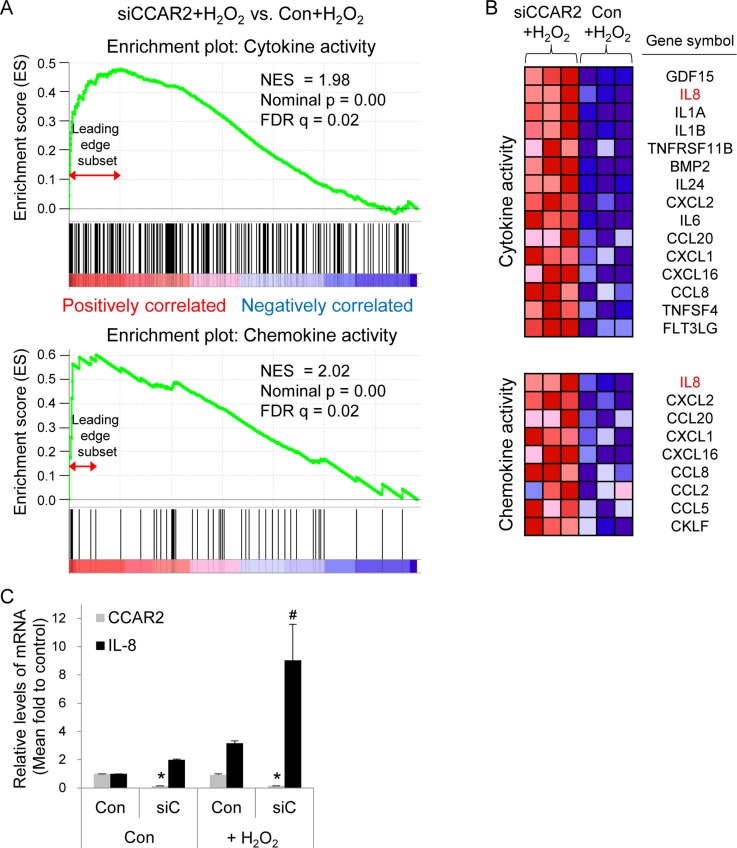
Figure 2. CCAR2 deficiency upregulates cytokine and chemokine following H2O2 treatment.
HeLa cells were transfected with siCCAR2 (siC). Forty-eight hours later, cells were treated with 0.5 mM H2O2 for 2 h. (A) Gene Set Enrichment Analysis (GSEA) of gene expression profile rank gene sets (cytokine and chemokine activity), according to expression values (red, upregulated; blue, downregulated). The upper part of the plot shows progression of the running enrichment score and the maximum peak therein. The lower part shows the genes in the gene set as “hits” against the ranked list of genes. Normalized enrichment score, NES; nominal P-value, nominal p; false discovery rate q-value, FDR q. (B) The corresponding heat-map shows expression values for the top subset of genes (red, upregulated; blue, downregulated). (C) Bar graph shows the relative expression of each mRNA from three independent microarrays. *P < 0.05 (CCAR2) and #P < 0.05 (IL-8), significantly different from control cells.

