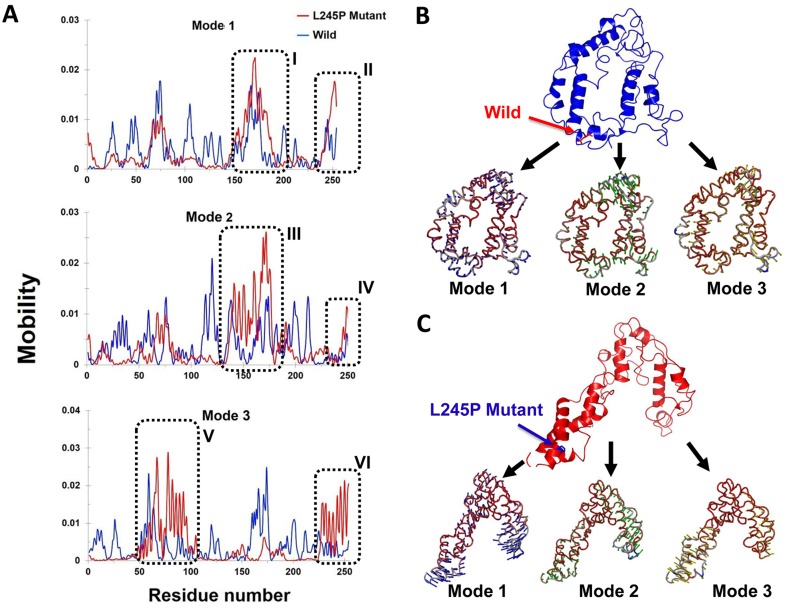
Figure 7. Mobility effects of the p. L245P mutation on the PROM1 protein.
A. Residue based mobility plots of the wild and mutant showing mobility at different residues across different modes. B. Porcupine plots in the three different modes of the wild type (blue) PROM1 protein. This graph shows the number of residues 70-77 and 183-191 playing significant roles in the secondary structure modifications of the mutant form. C. Motion in the three different modes of the L245P mutant PROM1 protein. Arrows in blue, green, and red indicate motions along mode 1, 2, and 3 respectively. These figures clearly show that the L245P mutation affected the overall conformational fluctuation of the system. Our results indicate the most motions in mode 1 located in residues number 183-191 I. and 250-255 (II) (mode 1), 120-180 (III) and 250-255 (IV) (mode 2), as well as 50-100 (V) and 230-255 (VI) (mode 3).

