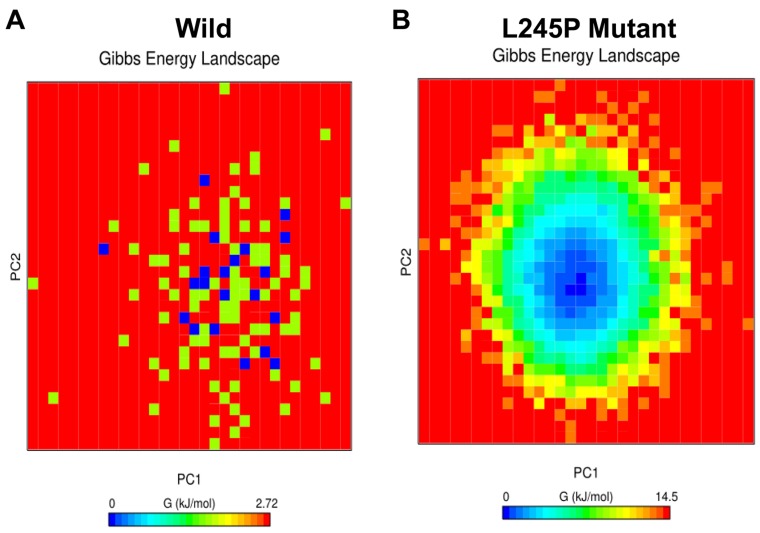
Figure 8. Free energy landscape (FEL).
Projections of FEL of the wild A. and the L245P mutant PROM1 B. conformational space onto PC1 and PC2 produced from PCA. The dark blue indicates the lowest energy configuration and red shows the highest energy configuration. These energy levels induce the instability in the general structure of mutated protein. This observation is consistent with the PCA scatter and the porcupine plot.

